Diamondback Energy Boston Consulting Group Matrix

Actionable Strategy Starts Here
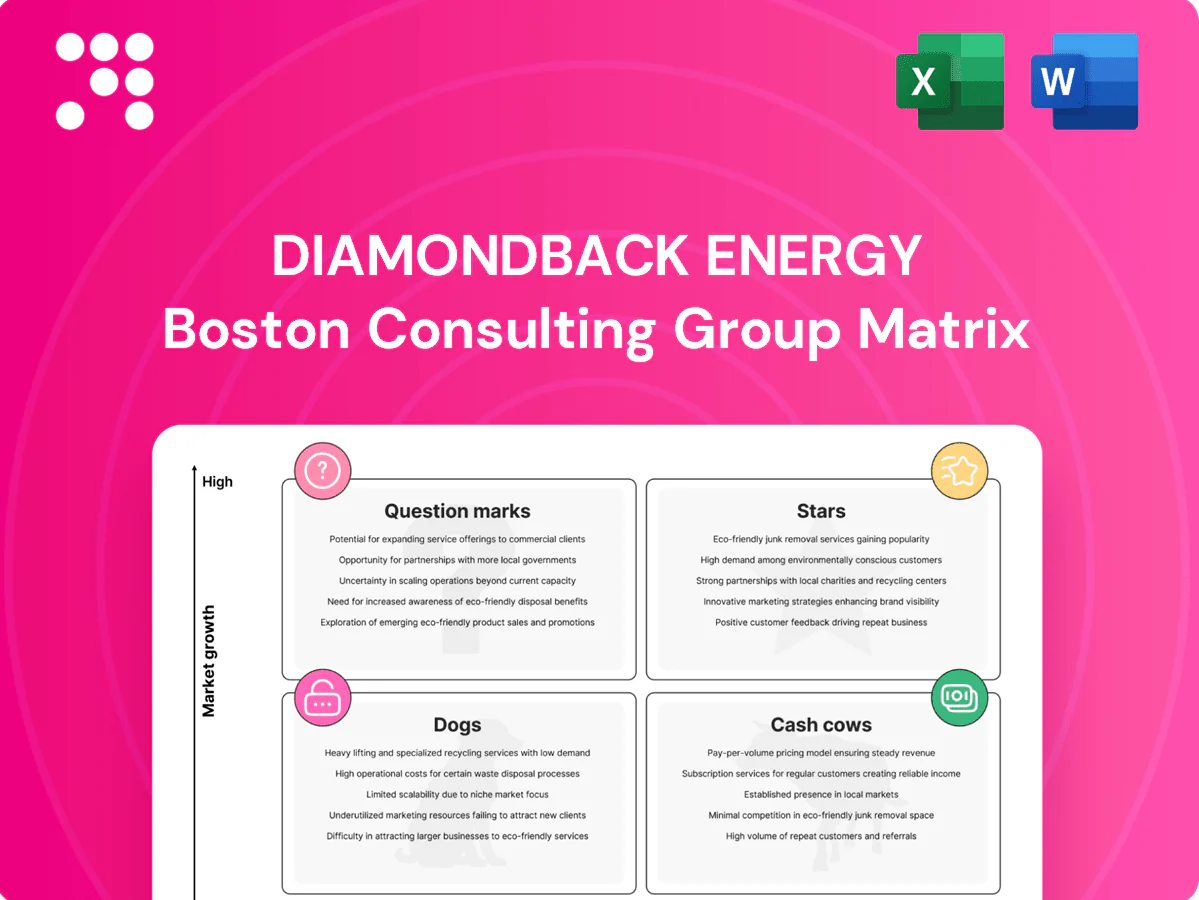
Curious where Diamondback Energy’s assets sit—Stars, Cash Cows, Dogs or Question Marks? This preview sketches the map; the full BCG Matrix gives quadrant-by-quadrant clarity, data-backed recommendations, and a ready-to-present Word report plus an Excel summary. Buy the full version to stop guessing and start reallocating capital with confidence.
Stars

Core Spraberry/Wolfcamp horizontals
Core Spraberry/Wolfcamp horizontals are Diamondback’s flagship Permian development with top-tier rock and well results, producing in the heart of a basin that the EIA reported at roughly 5.5 MMb/d in 2024. Diamondback holds a high share of its production and acreage in the basin, attracting ongoing capital and talent. The play soaks up cash for rigs, completions and midstream but generates high returns, and as basin growth cools it is poised to mature into a monster Cash Cow.
Contiguous Midland Basin blocks
Contiguous Midland Basin blocks give Diamondback roughly 600,000 net acres, enabling long laterals and lower per‑well unit costs through operational scale. This footprint drives market share leadership in core Midland corridors and supports higher capital efficiency. 2024 guidance keeps sustained capex near $1.7 billion to maintain activity and offset declines. Invest now to lock in a future cash surge as decline curves stabilize.

Low-cost operating model
Lean lifting costs (~$3.50/boe in 2024) and disciplined cycle times (≈15% faster Y/Y) let Diamondback win in a volatile oil tape, creating a scale-backed moat; ongoing tech, people and logistics investment (~$250m+/yr) is required to stay sharp, and with share intact this operational edge compounds into Cash Cow economics supporting free cash flow conversion and a market cap near $35bn.

High-return tier‑1 inventory
High-return tier‑1 inventory: deep, proven benches underpin above-market growth; Diamondback reported 2024 proved reserves ~1.9 billion BOE and continues to target high-IRR DUC development, allowing it to press the accelerator while quality locations remain. Development burns cash today for outsized IRR tomorrow; sustain execution and it converts to steady free cash flow.
- Proved reserves: ~1.9B BOE (2024)
- High-IRR wells drive growth
- Capex now, FCF later
Efficient completions and frac design
Efficient completions and frac design drive consistent well productivity through data-driven spacing and fluid optimization, signaling technical leadership in the Permian; Diamondback allocated roughly $2.3 billion capex in 2024 to sustain testing and iteration, aiming to boost IRRs and lower unit costs. Nail completions and it underwrites long-run free cash flow generation.
- Data-led spacing
- Fluid optimization
- 2024 capex ~ $2.3B
- Requires testing & iteration
Spraberry/Wolfcamp horizontals: top-tier Permian wells delivering high IRRs and future FCF
Diamondback’s core Spraberry/Wolfcamp horizontals are Stars: top-tier well results in a Permian producing ~5.5 MMb/d (EIA 2024), driving above-market IRRs and growth while consuming capex today to build future cash cows. 2024 proved reserves ~1.9 BBOE and lean lifting costs (~$3.50/boe) underpin rapid scale; disciplined spending (~$2.3B capex 2024) targets high-return DUCs and efficiency gains, converting to sustained FCF as inventory matures.
| Metric | 2024 |
|---|---|
| Permian output (EIA) | ~5.5 MMb/d |
| Proved reserves | ~1.9 BBOE |
| Lifting cost | ~$3.50/boe |
| Capex | ~$2.3B |
| Market cap | ~$35B |
What is included in the product
 Detailed Word Document
BCG matrix for Diamondback Energy: maps assets into Stars, Cash Cows, Question Marks and Dogs with clear invest/hold/divest advice.

 Customizable Excel Spreadsheet
One-page BCG matrix for Diamondback Energy, placing each unit in a quadrant to pinpoint investment pain points
Cash Cows

Legacy PDP base (mature wells)
Legacy PDP base (mature wells) delivers declining but predictable barrels — roughly a mid-teens decline rate (~12% in 2024) — generating steady cash with minimal incremental capex to hold declines. These cash flows fund dividends, debt service and selective growth bets, with free-cash conversion focused on shareholder returns and bolt-on development. Classic milk-the-base profile in a mature slice of the Permian market.
Midstream/water handling partnerships
Midstream and water-handling partnerships deliver stable, fee-like economics tied to contracted throughput and high utilization, serving as Diamondback’s cash cow in 2024. Low organic growth but solid margins and modest, targeted debottlenecking capex keep cash ticking and predictable. These cash streams are ideal to bankroll upstream development and return programs throughout 2024.

Gas and NGL byproduct streams
Associated gas and NGL byproduct streams monetize oil lifts with minimal incremental lift cost, contributing steady volumes (Diamondback reported ~546 Mboe/d average production in 2024) and modest market growth vs oil. Infrastructure and midstream takeaway in the Permian are largely in place, dampening capex needs. These streams deliver reliable cashflow that requires little promotional spend to sustain.

Hedged production book
Hedged production book smooths cash flows from mature barrels, flattening revenue volatility and stabilizing Diamondback Energy’s P&L through 2024 market swings. It is not a growth engine but reduces downside risk and supports credit metrics, enabling capital allocation to higher-return, higher-growth plays. Limited reinvestment needs make it high-utility for funding new drill programs and M&A.
- Role: cash cow — steady cash, low capex
- Function: volatility dampener in 2024
- Benefit: funds growth projects and protects margins
- Tradeoff: no production growth driver
Operational scale synergies
Operational scale synergies — shared crews, pads and logistics — drive lower per‑unit LOE and F&D, a benefit Diamondback’s 2024 SEC filings attribute to sustained base economics even with slower drilling; minimal incremental spend preserves cash flow while existing infrastructure compounds margin advantages over time.
- Shared crews: lower unit LOE and higher uptime
- Pads/logistics: reduced F&D per barrel
- Low maintenance spend: preserves free cash flow
- Compounding cash edges: reinvest or return to shareholders
Mature PDP, ~12% decline, 546 Mboe/d supports steady cash
Diamondback’s mature PDP base (≈12% decline in 2024) plus ~546 Mboe/d production and fee‑like midstream/water contracts deliver predictable, low‑capex cash flows that fund dividends, debt service and selective upstream growth; hedges smooth volatility, preserving credit metrics while requiring limited reinvestment.
| Metric | 2024 |
|---|---|
| Prod | 546 Mboe/d |
| Decline | ~12% |
| Role | Cash cow |
Delivered as Shown
Diamondback Energy BCG Matrix
The Diamondback Energy BCG Matrix you’re previewing is the exact file you’ll get after purchase. No watermarks, no placeholders—just a fully formatted, analysis-ready matrix tailored to Diamondback’s portfolio and market position. Buy once, download immediately, and start using it in reports or board decks with zero fuss. This is the final product, crafted for clarity and action.

Actionable Strategy Starts Here
Curious where Diamondback Energy’s assets sit—Stars, Cash Cows, Dogs or Question Marks? This preview sketches the map; the full BCG Matrix gives quadrant-by-quadrant clarity, data-backed recommendations, and a ready-to-present Word report plus an Excel summary. Buy the full version to stop guessing and start reallocating capital with confidence.
Stars
Core Spraberry/Wolfcamp horizontals
Core Spraberry/Wolfcamp horizontals are Diamondback’s flagship Permian development with top-tier rock and well results, producing in the heart of a basin that the EIA reported at roughly 5.5 MMb/d in 2024. Diamondback holds a high share of its production and acreage in the basin, attracting ongoing capital and talent. The play soaks up cash for rigs, completions and midstream but generates high returns, and as basin growth cools it is poised to mature into a monster Cash Cow.
Contiguous Midland Basin blocks
Contiguous Midland Basin blocks give Diamondback roughly 600,000 net acres, enabling long laterals and lower per‑well unit costs through operational scale. This footprint drives market share leadership in core Midland corridors and supports higher capital efficiency. 2024 guidance keeps sustained capex near $1.7 billion to maintain activity and offset declines. Invest now to lock in a future cash surge as decline curves stabilize.
Low-cost operating model
Lean lifting costs (~$3.50/boe in 2024) and disciplined cycle times (≈15% faster Y/Y) let Diamondback win in a volatile oil tape, creating a scale-backed moat; ongoing tech, people and logistics investment (~$250m+/yr) is required to stay sharp, and with share intact this operational edge compounds into Cash Cow economics supporting free cash flow conversion and a market cap near $35bn.
High-return tier‑1 inventory
High-return tier‑1 inventory: deep, proven benches underpin above-market growth; Diamondback reported 2024 proved reserves ~1.9 billion BOE and continues to target high-IRR DUC development, allowing it to press the accelerator while quality locations remain. Development burns cash today for outsized IRR tomorrow; sustain execution and it converts to steady free cash flow.
- Proved reserves: ~1.9B BOE (2024)
- High-IRR wells drive growth
- Capex now, FCF later
Efficient completions and frac design
Efficient completions and frac design drive consistent well productivity through data-driven spacing and fluid optimization, signaling technical leadership in the Permian; Diamondback allocated roughly $2.3 billion capex in 2024 to sustain testing and iteration, aiming to boost IRRs and lower unit costs. Nail completions and it underwrites long-run free cash flow generation.
- Data-led spacing
- Fluid optimization
- 2024 capex ~ $2.3B
- Requires testing & iteration
Spraberry/Wolfcamp horizontals: top-tier Permian wells delivering high IRRs and future FCF
Diamondback’s core Spraberry/Wolfcamp horizontals are Stars: top-tier well results in a Permian producing ~5.5 MMb/d (EIA 2024), driving above-market IRRs and growth while consuming capex today to build future cash cows. 2024 proved reserves ~1.9 BBOE and lean lifting costs (~$3.50/boe) underpin rapid scale; disciplined spending (~$2.3B capex 2024) targets high-return DUCs and efficiency gains, converting to sustained FCF as inventory matures.
| Metric | 2024 |
|---|---|
| Permian output (EIA) | ~5.5 MMb/d |
| Proved reserves | ~1.9 BBOE |
| Lifting cost | ~$3.50/boe |
| Capex | ~$2.3B |
| Market cap | ~$35B |
What is included in the product
Detailed Word Document
BCG matrix for Diamondback Energy: maps assets into Stars, Cash Cows, Question Marks and Dogs with clear invest/hold/divest advice.
Customizable Excel Spreadsheet
One-page BCG matrix for Diamondback Energy, placing each unit in a quadrant to pinpoint investment pain points
Cash Cows
Legacy PDP base (mature wells)
Legacy PDP base (mature wells) delivers declining but predictable barrels — roughly a mid-teens decline rate (~12% in 2024) — generating steady cash with minimal incremental capex to hold declines. These cash flows fund dividends, debt service and selective growth bets, with free-cash conversion focused on shareholder returns and bolt-on development. Classic milk-the-base profile in a mature slice of the Permian market.
Midstream/water handling partnerships
Midstream and water-handling partnerships deliver stable, fee-like economics tied to contracted throughput and high utilization, serving as Diamondback’s cash cow in 2024. Low organic growth but solid margins and modest, targeted debottlenecking capex keep cash ticking and predictable. These cash streams are ideal to bankroll upstream development and return programs throughout 2024.
Gas and NGL byproduct streams
Associated gas and NGL byproduct streams monetize oil lifts with minimal incremental lift cost, contributing steady volumes (Diamondback reported ~546 Mboe/d average production in 2024) and modest market growth vs oil. Infrastructure and midstream takeaway in the Permian are largely in place, dampening capex needs. These streams deliver reliable cashflow that requires little promotional spend to sustain.
Hedged production book
Hedged production book smooths cash flows from mature barrels, flattening revenue volatility and stabilizing Diamondback Energy’s P&L through 2024 market swings. It is not a growth engine but reduces downside risk and supports credit metrics, enabling capital allocation to higher-return, higher-growth plays. Limited reinvestment needs make it high-utility for funding new drill programs and M&A.
- Role: cash cow — steady cash, low capex
- Function: volatility dampener in 2024
- Benefit: funds growth projects and protects margins
- Tradeoff: no production growth driver
Operational scale synergies
Operational scale synergies — shared crews, pads and logistics — drive lower per‑unit LOE and F&D, a benefit Diamondback’s 2024 SEC filings attribute to sustained base economics even with slower drilling; minimal incremental spend preserves cash flow while existing infrastructure compounds margin advantages over time.
- Shared crews: lower unit LOE and higher uptime
- Pads/logistics: reduced F&D per barrel
- Low maintenance spend: preserves free cash flow
- Compounding cash edges: reinvest or return to shareholders
Mature PDP, ~12% decline, 546 Mboe/d supports steady cash
Diamondback’s mature PDP base (≈12% decline in 2024) plus ~546 Mboe/d production and fee‑like midstream/water contracts deliver predictable, low‑capex cash flows that fund dividends, debt service and selective upstream growth; hedges smooth volatility, preserving credit metrics while requiring limited reinvestment.
| Metric | 2024 |
|---|---|
| Prod | 546 Mboe/d |
| Decline | ~12% |
| Role | Cash cow |
Delivered as Shown
Diamondback Energy BCG Matrix
The Diamondback Energy BCG Matrix you’re previewing is the exact file you’ll get after purchase. No watermarks, no placeholders—just a fully formatted, analysis-ready matrix tailored to Diamondback’s portfolio and market position. Buy once, download immediately, and start using it in reports or board decks with zero fuss. This is the final product, crafted for clarity and action.
Description
Actionable Strategy Starts Here
Curious where Diamondback Energy’s assets sit—Stars, Cash Cows, Dogs or Question Marks? This preview sketches the map; the full BCG Matrix gives quadrant-by-quadrant clarity, data-backed recommendations, and a ready-to-present Word report plus an Excel summary. Buy the full version to stop guessing and start reallocating capital with confidence.
Stars
Core Spraberry/Wolfcamp horizontals
Core Spraberry/Wolfcamp horizontals are Diamondback’s flagship Permian development with top-tier rock and well results, producing in the heart of a basin that the EIA reported at roughly 5.5 MMb/d in 2024. Diamondback holds a high share of its production and acreage in the basin, attracting ongoing capital and talent. The play soaks up cash for rigs, completions and midstream but generates high returns, and as basin growth cools it is poised to mature into a monster Cash Cow.
Contiguous Midland Basin blocks
Contiguous Midland Basin blocks give Diamondback roughly 600,000 net acres, enabling long laterals and lower per‑well unit costs through operational scale. This footprint drives market share leadership in core Midland corridors and supports higher capital efficiency. 2024 guidance keeps sustained capex near $1.7 billion to maintain activity and offset declines. Invest now to lock in a future cash surge as decline curves stabilize.
Low-cost operating model
Lean lifting costs (~$3.50/boe in 2024) and disciplined cycle times (≈15% faster Y/Y) let Diamondback win in a volatile oil tape, creating a scale-backed moat; ongoing tech, people and logistics investment (~$250m+/yr) is required to stay sharp, and with share intact this operational edge compounds into Cash Cow economics supporting free cash flow conversion and a market cap near $35bn.
High-return tier‑1 inventory
High-return tier‑1 inventory: deep, proven benches underpin above-market growth; Diamondback reported 2024 proved reserves ~1.9 billion BOE and continues to target high-IRR DUC development, allowing it to press the accelerator while quality locations remain. Development burns cash today for outsized IRR tomorrow; sustain execution and it converts to steady free cash flow.
- Proved reserves: ~1.9B BOE (2024)
- High-IRR wells drive growth
- Capex now, FCF later
Efficient completions and frac design
Efficient completions and frac design drive consistent well productivity through data-driven spacing and fluid optimization, signaling technical leadership in the Permian; Diamondback allocated roughly $2.3 billion capex in 2024 to sustain testing and iteration, aiming to boost IRRs and lower unit costs. Nail completions and it underwrites long-run free cash flow generation.
- Data-led spacing
- Fluid optimization
- 2024 capex ~ $2.3B
- Requires testing & iteration
Spraberry/Wolfcamp horizontals: top-tier Permian wells delivering high IRRs and future FCF
Diamondback’s core Spraberry/Wolfcamp horizontals are Stars: top-tier well results in a Permian producing ~5.5 MMb/d (EIA 2024), driving above-market IRRs and growth while consuming capex today to build future cash cows. 2024 proved reserves ~1.9 BBOE and lean lifting costs (~$3.50/boe) underpin rapid scale; disciplined spending (~$2.3B capex 2024) targets high-return DUCs and efficiency gains, converting to sustained FCF as inventory matures.
| Metric | 2024 |
|---|---|
| Permian output (EIA) | ~5.5 MMb/d |
| Proved reserves | ~1.9 BBOE |
| Lifting cost | ~$3.50/boe |
| Capex | ~$2.3B |
| Market cap | ~$35B |
What is included in the product
Detailed Word Document
BCG matrix for Diamondback Energy: maps assets into Stars, Cash Cows, Question Marks and Dogs with clear invest/hold/divest advice.
Customizable Excel Spreadsheet
One-page BCG matrix for Diamondback Energy, placing each unit in a quadrant to pinpoint investment pain points
Cash Cows
Legacy PDP base (mature wells)
Legacy PDP base (mature wells) delivers declining but predictable barrels — roughly a mid-teens decline rate (~12% in 2024) — generating steady cash with minimal incremental capex to hold declines. These cash flows fund dividends, debt service and selective growth bets, with free-cash conversion focused on shareholder returns and bolt-on development. Classic milk-the-base profile in a mature slice of the Permian market.
Midstream/water handling partnerships
Midstream and water-handling partnerships deliver stable, fee-like economics tied to contracted throughput and high utilization, serving as Diamondback’s cash cow in 2024. Low organic growth but solid margins and modest, targeted debottlenecking capex keep cash ticking and predictable. These cash streams are ideal to bankroll upstream development and return programs throughout 2024.
Gas and NGL byproduct streams
Associated gas and NGL byproduct streams monetize oil lifts with minimal incremental lift cost, contributing steady volumes (Diamondback reported ~546 Mboe/d average production in 2024) and modest market growth vs oil. Infrastructure and midstream takeaway in the Permian are largely in place, dampening capex needs. These streams deliver reliable cashflow that requires little promotional spend to sustain.
Hedged production book
Hedged production book smooths cash flows from mature barrels, flattening revenue volatility and stabilizing Diamondback Energy’s P&L through 2024 market swings. It is not a growth engine but reduces downside risk and supports credit metrics, enabling capital allocation to higher-return, higher-growth plays. Limited reinvestment needs make it high-utility for funding new drill programs and M&A.
- Role: cash cow — steady cash, low capex
- Function: volatility dampener in 2024
- Benefit: funds growth projects and protects margins
- Tradeoff: no production growth driver
Operational scale synergies
Operational scale synergies — shared crews, pads and logistics — drive lower per‑unit LOE and F&D, a benefit Diamondback’s 2024 SEC filings attribute to sustained base economics even with slower drilling; minimal incremental spend preserves cash flow while existing infrastructure compounds margin advantages over time.
- Shared crews: lower unit LOE and higher uptime
- Pads/logistics: reduced F&D per barrel
- Low maintenance spend: preserves free cash flow
- Compounding cash edges: reinvest or return to shareholders
Mature PDP, ~12% decline, 546 Mboe/d supports steady cash
Diamondback’s mature PDP base (≈12% decline in 2024) plus ~546 Mboe/d production and fee‑like midstream/water contracts deliver predictable, low‑capex cash flows that fund dividends, debt service and selective upstream growth; hedges smooth volatility, preserving credit metrics while requiring limited reinvestment.
| Metric | 2024 |
|---|---|
| Prod | 546 Mboe/d |
| Decline | ~12% |
| Role | Cash cow |
Delivered as Shown
Diamondback Energy BCG Matrix
The Diamondback Energy BCG Matrix you’re previewing is the exact file you’ll get after purchase. No watermarks, no placeholders—just a fully formatted, analysis-ready matrix tailored to Diamondback’s portfolio and market position. Buy once, download immediately, and start using it in reports or board decks with zero fuss. This is the final product, crafted for clarity and action.











