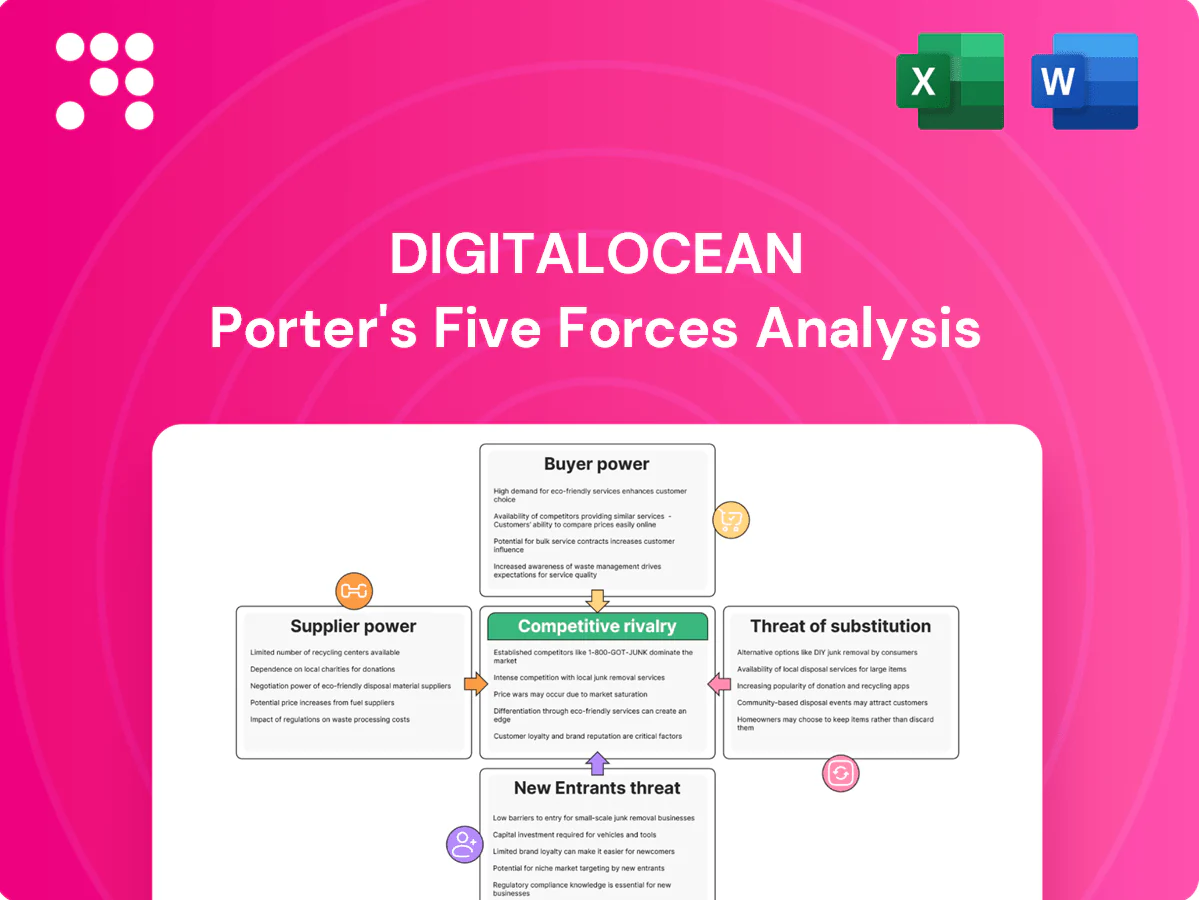
DigitalOcean Porter's Five Forces Analysis

A Must-Have Tool for Decision-Makers
DigitalOcean faces intense rivalry and strong substitute pressure from hyperscalers, with moderate buyer power and relatively low supplier leverage, while barriers to entry are mixed due to commoditized infrastructure but meaningful scale advantages. Strategic differentiation in developer experience and pricing tempers some risks but competitive intensity remains high. This brief snapshot only scratches the surface. Unlock the full Porter's Five Forces Analysis to explore DigitalOcean’s competitive dynamics, market pressures, and strategic advantages in detail.
Suppliers Bargaining Power

Concentrated chip and server OEMs
DigitalOcean depends on a concentrated set of CPU, GPU and server OEMs: x86 vendors accounted for over 90% of server CPU shipments in 2024 and NVIDIA held roughly 80–90% of data-center GPU accelerators, while top server OEMs (Dell, HPE, Lenovo) control ~60% of shipments. Limited alternatives raise input costs and lead times, and suppliers with differentiated roadmaps can extract favorable terms; DO mitigates via multi-vendor sourcing and standardized commodity builds.
Data center colocation landlords
Colocation providers in metros such as Northern Virginia and Silicon Valley control power density, cross-connect ecosystems and expansion slots, giving facility operators elevated bargaining power when power availability is tight.
Long-term colocation contracts and migration frictions lock in terms and switching costs for DigitalOcean, while diversifying regions and negotiating multi-site agreements can temper rate escalations.

Bandwidth and transit providers
IP transit and peering partners directly shape network quality and cost for DigitalOcean, with pricing and SLAs set by a small set of backbone providers; there are roughly nine Tier-1 networks globally and 800+ IXPs worldwide. In regions with fewer Tier-1s or IXPs carrier leverage and price volatility rise, tightening margins. Rising AI and data workloads — Cisco estimating ~21% global IP traffic CAGR through 2027 — concentrate spend on transit. Strategic peering, CDNs and edge caches lower dependency and cap egress costs.

Proprietary software/licensing stack
Some managed offerings (databases, observability, security) depend on commercially stewarded or licensed upstream projects, so vendor price or license changes can compress margins; DigitalOcean reported $633.6 million revenue in 2023, underscoring margin sensitivity for cloud-native SMB-focused plays. Open-source alternatives reduce licensing spend but support SLAs often push customers to paid vendors. Investing in internal tooling lowers long-run supplier exposure.
- Dependency: licensed stacks raise supplier leverage
- Risk: license shifts → margin pressure
- Mitigation: OSS + paid SLA tradeoffs
- Strategic: build internal tooling to reduce exposure
Specialized GPUs and accelerators
AI workloads drive heavy dependence on scarce accelerators; in 2024 NVIDIA held roughly 80 percent of datacenter GPU share and industry lead times stretched 6–12 months, intensifying supplier leverage.
Vendor allocation policies and required prepayments further heighten supplier power, substitution across SKUs is constrained by performance SLAs, while early procurement and diversifying to AMD, Intel, AWS Trainium/Inferentia can partially ease capacity bottlenecks.
- market_share: NVIDIA ~80% (2024)
- lead_times: 6–12 months (2024)
- mitigation: early procurement, multi-vendor options
x86 >90%, GPUs ~80%, lead 6–12m
Supplier power is high: CPU/GPU OEM concentration (x86 >90% CPU shipments, NVIDIA ~80% GPU share in 2024) plus top OEMs ~60% server shipments raise costs and lead times (GPUs 6–12 month lead times in 2024). Colocation and Tier-1/backbone scarcity (≈9 Tier-1s, 800+ IXPs) push up facility and transit leverage. DO mitigation: multi-vendor sourcing, strategic peering, long-term contracts.
| Metric | Value |
|---|---|
| DigitalOcean revenue (2023) | $633.6M |
| x86 share (2024) | >90% |
| NVIDIA DC GPU share (2024) | ~80% |
| GPU lead times (2024) | 6–12 months |
| Top server OEMs share | ~60% |
| Tier-1 networks / IXPs | ≈9 / 800+ |
What is included in the product
 Detailed Word Document
Unpacks competitive intensity around DigitalOcean by evaluating supplier and buyer power, rivalry with hyperscalers and niche hosts, threat of startups and substitutes like serverless, and barriers shaping market entry and profitability.

 Customizable Excel Spreadsheet
A concise one-sheet Porter's Five Forces for DigitalOcean—instantly highlighting competitive pressures, supplier/buyer dynamics and clear pain-point reliefs for strategic action.
Customers Bargaining Power

Low switching costs for SMB developers
By 2024, widespread adoption of Terraform, containers and CI/CD means SMBs can script infrastructure and migrate workloads in hours or days, lowering switching costs. Transparent pricing and API-driven tools allow price/performance comparisons in minutes, increasing customer bargaining power. DigitalOcean counters with platform simplicity, extensive docs and dedicated migration tooling to retain cost-sensitive developers.
Price transparency and comparability
In 2024 per-hour rates, egress fees and storage costs are published transparently across cloud providers, enabling direct price comparability. Buyers systematically benchmark TCO and negotiate credits and committed-use discounts. This transparency compresses margins in commoditized tiers such as basic compute. Bundled credits and usage-based discounts help retain value-conscious users.

Consolidation by scaling startups
As startups scale and consolidate, many centralize workloads on hyperscalers, who held roughly 70% of the IaaS market in 2024 (Gartner), boosting buyer leverage to demand features, stricter SLAs, or discounts to stay. Churn risk notably rises around Series B+ inflection points as customers seek advanced services. DigitalOcean’s managed services and partner ecosystem aim to extend tenure and counter this consolidation pressure.

Demand for performance and SLA guarantees
Latency, uptime, and support responsiveness are pivotal for production workloads, driving larger DigitalOcean customers to demand enhanced SLAs and premium support; failure to meet SLAs can lead to service credits or customer migrations. Tiered support plans and regional redundancy are deployed to meet these expectations and retain high-value clients.
- Latency-sensitive workloads: expect premium SLAs
- Uptime breaches: trigger credits or migrations
- Support tiers: standard to enterprise
- Regional redundancy: reduces migration risk
Multi-cloud procurement norms
- Portability reduces lock-in — 92% multi-cloud (Flexera 2024)
- RFPs amplify price/feature comparisons
- DO strengths: simplicity, predictable egress, developer UX
Multi-cloud buyers and hyperscalers force transparent pricing, squeezing cloud margins
Customer power rose in 2024: 92% of enterprises run multi-cloud (Flexera) and hyperscalers held ~70% IaaS (Gartner), enabling fast price/feature comparisons and lower switching costs.
Transparent per-hour, egress and storage pricing forces TCO benchmarking and discounts, compressing margins in basic compute.
DigitalOcean relies on simplicity, predictable egress, developer UX and tiered support to retain cost-sensitive users.
| Metric | 2024 | Impact |
|---|---|---|
| Multi-cloud | 92% (Flexera) | Reduces lock-in |
| Hyperscaler share | ~70% IaaS (Gartner) | Raises buyer leverage |
| Pricing transparency | Per-hour/egress published | Compresses margins |
Full Version Awaits
DigitalOcean Porter's Five Forces Analysis
This preview is the exact DigitalOcean Porter's Five Forces Analysis you'll receive after purchase—no placeholders or mockups. The full document is professionally formatted, complete and ready to download the moment you buy. What you see here is the final deliverable, prepared for immediate use.

A Must-Have Tool for Decision-Makers
DigitalOcean faces intense rivalry and strong substitute pressure from hyperscalers, with moderate buyer power and relatively low supplier leverage, while barriers to entry are mixed due to commoditized infrastructure but meaningful scale advantages. Strategic differentiation in developer experience and pricing tempers some risks but competitive intensity remains high. This brief snapshot only scratches the surface. Unlock the full Porter's Five Forces Analysis to explore DigitalOcean’s competitive dynamics, market pressures, and strategic advantages in detail.
Suppliers Bargaining Power
Concentrated chip and server OEMs
DigitalOcean depends on a concentrated set of CPU, GPU and server OEMs: x86 vendors accounted for over 90% of server CPU shipments in 2024 and NVIDIA held roughly 80–90% of data-center GPU accelerators, while top server OEMs (Dell, HPE, Lenovo) control ~60% of shipments. Limited alternatives raise input costs and lead times, and suppliers with differentiated roadmaps can extract favorable terms; DO mitigates via multi-vendor sourcing and standardized commodity builds.
Data center colocation landlords
Colocation providers in metros such as Northern Virginia and Silicon Valley control power density, cross-connect ecosystems and expansion slots, giving facility operators elevated bargaining power when power availability is tight.
Long-term colocation contracts and migration frictions lock in terms and switching costs for DigitalOcean, while diversifying regions and negotiating multi-site agreements can temper rate escalations.
Bandwidth and transit providers
IP transit and peering partners directly shape network quality and cost for DigitalOcean, with pricing and SLAs set by a small set of backbone providers; there are roughly nine Tier-1 networks globally and 800+ IXPs worldwide. In regions with fewer Tier-1s or IXPs carrier leverage and price volatility rise, tightening margins. Rising AI and data workloads — Cisco estimating ~21% global IP traffic CAGR through 2027 — concentrate spend on transit. Strategic peering, CDNs and edge caches lower dependency and cap egress costs.
Proprietary software/licensing stack
Some managed offerings (databases, observability, security) depend on commercially stewarded or licensed upstream projects, so vendor price or license changes can compress margins; DigitalOcean reported $633.6 million revenue in 2023, underscoring margin sensitivity for cloud-native SMB-focused plays. Open-source alternatives reduce licensing spend but support SLAs often push customers to paid vendors. Investing in internal tooling lowers long-run supplier exposure.
- Dependency: licensed stacks raise supplier leverage
- Risk: license shifts → margin pressure
- Mitigation: OSS + paid SLA tradeoffs
- Strategic: build internal tooling to reduce exposure
Specialized GPUs and accelerators
AI workloads drive heavy dependence on scarce accelerators; in 2024 NVIDIA held roughly 80 percent of datacenter GPU share and industry lead times stretched 6–12 months, intensifying supplier leverage.
Vendor allocation policies and required prepayments further heighten supplier power, substitution across SKUs is constrained by performance SLAs, while early procurement and diversifying to AMD, Intel, AWS Trainium/Inferentia can partially ease capacity bottlenecks.
- market_share: NVIDIA ~80% (2024)
- lead_times: 6–12 months (2024)
- mitigation: early procurement, multi-vendor options
x86 >90%, GPUs ~80%, lead 6–12m
Supplier power is high: CPU/GPU OEM concentration (x86 >90% CPU shipments, NVIDIA ~80% GPU share in 2024) plus top OEMs ~60% server shipments raise costs and lead times (GPUs 6–12 month lead times in 2024). Colocation and Tier-1/backbone scarcity (≈9 Tier-1s, 800+ IXPs) push up facility and transit leverage. DO mitigation: multi-vendor sourcing, strategic peering, long-term contracts.
| Metric | Value |
|---|---|
| DigitalOcean revenue (2023) | $633.6M |
| x86 share (2024) | >90% |
| NVIDIA DC GPU share (2024) | ~80% |
| GPU lead times (2024) | 6–12 months |
| Top server OEMs share | ~60% |
| Tier-1 networks / IXPs | ≈9 / 800+ |
What is included in the product
Detailed Word Document
Unpacks competitive intensity around DigitalOcean by evaluating supplier and buyer power, rivalry with hyperscalers and niche hosts, threat of startups and substitutes like serverless, and barriers shaping market entry and profitability.
Customizable Excel Spreadsheet
A concise one-sheet Porter's Five Forces for DigitalOcean—instantly highlighting competitive pressures, supplier/buyer dynamics and clear pain-point reliefs for strategic action.
Customers Bargaining Power
Low switching costs for SMB developers
By 2024, widespread adoption of Terraform, containers and CI/CD means SMBs can script infrastructure and migrate workloads in hours or days, lowering switching costs. Transparent pricing and API-driven tools allow price/performance comparisons in minutes, increasing customer bargaining power. DigitalOcean counters with platform simplicity, extensive docs and dedicated migration tooling to retain cost-sensitive developers.
Price transparency and comparability
In 2024 per-hour rates, egress fees and storage costs are published transparently across cloud providers, enabling direct price comparability. Buyers systematically benchmark TCO and negotiate credits and committed-use discounts. This transparency compresses margins in commoditized tiers such as basic compute. Bundled credits and usage-based discounts help retain value-conscious users.
Consolidation by scaling startups
As startups scale and consolidate, many centralize workloads on hyperscalers, who held roughly 70% of the IaaS market in 2024 (Gartner), boosting buyer leverage to demand features, stricter SLAs, or discounts to stay. Churn risk notably rises around Series B+ inflection points as customers seek advanced services. DigitalOcean’s managed services and partner ecosystem aim to extend tenure and counter this consolidation pressure.
Demand for performance and SLA guarantees
Latency, uptime, and support responsiveness are pivotal for production workloads, driving larger DigitalOcean customers to demand enhanced SLAs and premium support; failure to meet SLAs can lead to service credits or customer migrations. Tiered support plans and regional redundancy are deployed to meet these expectations and retain high-value clients.
- Latency-sensitive workloads: expect premium SLAs
- Uptime breaches: trigger credits or migrations
- Support tiers: standard to enterprise
- Regional redundancy: reduces migration risk
Multi-cloud procurement norms
- Portability reduces lock-in — 92% multi-cloud (Flexera 2024)
- RFPs amplify price/feature comparisons
- DO strengths: simplicity, predictable egress, developer UX
Multi-cloud buyers and hyperscalers force transparent pricing, squeezing cloud margins
Customer power rose in 2024: 92% of enterprises run multi-cloud (Flexera) and hyperscalers held ~70% IaaS (Gartner), enabling fast price/feature comparisons and lower switching costs.
Transparent per-hour, egress and storage pricing forces TCO benchmarking and discounts, compressing margins in basic compute.
DigitalOcean relies on simplicity, predictable egress, developer UX and tiered support to retain cost-sensitive users.
| Metric | 2024 | Impact |
|---|---|---|
| Multi-cloud | 92% (Flexera) | Reduces lock-in |
| Hyperscaler share | ~70% IaaS (Gartner) | Raises buyer leverage |
| Pricing transparency | Per-hour/egress published | Compresses margins |
Full Version Awaits
DigitalOcean Porter's Five Forces Analysis
This preview is the exact DigitalOcean Porter's Five Forces Analysis you'll receive after purchase—no placeholders or mockups. The full document is professionally formatted, complete and ready to download the moment you buy. What you see here is the final deliverable, prepared for immediate use.
Original: $10.00
-65%$10.00
$3.50Description
A Must-Have Tool for Decision-Makers
DigitalOcean faces intense rivalry and strong substitute pressure from hyperscalers, with moderate buyer power and relatively low supplier leverage, while barriers to entry are mixed due to commoditized infrastructure but meaningful scale advantages. Strategic differentiation in developer experience and pricing tempers some risks but competitive intensity remains high. This brief snapshot only scratches the surface. Unlock the full Porter's Five Forces Analysis to explore DigitalOcean’s competitive dynamics, market pressures, and strategic advantages in detail.
Suppliers Bargaining Power
Concentrated chip and server OEMs
DigitalOcean depends on a concentrated set of CPU, GPU and server OEMs: x86 vendors accounted for over 90% of server CPU shipments in 2024 and NVIDIA held roughly 80–90% of data-center GPU accelerators, while top server OEMs (Dell, HPE, Lenovo) control ~60% of shipments. Limited alternatives raise input costs and lead times, and suppliers with differentiated roadmaps can extract favorable terms; DO mitigates via multi-vendor sourcing and standardized commodity builds.
Data center colocation landlords
Colocation providers in metros such as Northern Virginia and Silicon Valley control power density, cross-connect ecosystems and expansion slots, giving facility operators elevated bargaining power when power availability is tight.
Long-term colocation contracts and migration frictions lock in terms and switching costs for DigitalOcean, while diversifying regions and negotiating multi-site agreements can temper rate escalations.
Bandwidth and transit providers
IP transit and peering partners directly shape network quality and cost for DigitalOcean, with pricing and SLAs set by a small set of backbone providers; there are roughly nine Tier-1 networks globally and 800+ IXPs worldwide. In regions with fewer Tier-1s or IXPs carrier leverage and price volatility rise, tightening margins. Rising AI and data workloads — Cisco estimating ~21% global IP traffic CAGR through 2027 — concentrate spend on transit. Strategic peering, CDNs and edge caches lower dependency and cap egress costs.
Proprietary software/licensing stack
Some managed offerings (databases, observability, security) depend on commercially stewarded or licensed upstream projects, so vendor price or license changes can compress margins; DigitalOcean reported $633.6 million revenue in 2023, underscoring margin sensitivity for cloud-native SMB-focused plays. Open-source alternatives reduce licensing spend but support SLAs often push customers to paid vendors. Investing in internal tooling lowers long-run supplier exposure.
- Dependency: licensed stacks raise supplier leverage
- Risk: license shifts → margin pressure
- Mitigation: OSS + paid SLA tradeoffs
- Strategic: build internal tooling to reduce exposure
Specialized GPUs and accelerators
AI workloads drive heavy dependence on scarce accelerators; in 2024 NVIDIA held roughly 80 percent of datacenter GPU share and industry lead times stretched 6–12 months, intensifying supplier leverage.
Vendor allocation policies and required prepayments further heighten supplier power, substitution across SKUs is constrained by performance SLAs, while early procurement and diversifying to AMD, Intel, AWS Trainium/Inferentia can partially ease capacity bottlenecks.
- market_share: NVIDIA ~80% (2024)
- lead_times: 6–12 months (2024)
- mitigation: early procurement, multi-vendor options
x86 >90%, GPUs ~80%, lead 6–12m
Supplier power is high: CPU/GPU OEM concentration (x86 >90% CPU shipments, NVIDIA ~80% GPU share in 2024) plus top OEMs ~60% server shipments raise costs and lead times (GPUs 6–12 month lead times in 2024). Colocation and Tier-1/backbone scarcity (≈9 Tier-1s, 800+ IXPs) push up facility and transit leverage. DO mitigation: multi-vendor sourcing, strategic peering, long-term contracts.
| Metric | Value |
|---|---|
| DigitalOcean revenue (2023) | $633.6M |
| x86 share (2024) | >90% |
| NVIDIA DC GPU share (2024) | ~80% |
| GPU lead times (2024) | 6–12 months |
| Top server OEMs share | ~60% |
| Tier-1 networks / IXPs | ≈9 / 800+ |
What is included in the product
Detailed Word Document
Unpacks competitive intensity around DigitalOcean by evaluating supplier and buyer power, rivalry with hyperscalers and niche hosts, threat of startups and substitutes like serverless, and barriers shaping market entry and profitability.
Customizable Excel Spreadsheet
A concise one-sheet Porter's Five Forces for DigitalOcean—instantly highlighting competitive pressures, supplier/buyer dynamics and clear pain-point reliefs for strategic action.
Customers Bargaining Power
Low switching costs for SMB developers
By 2024, widespread adoption of Terraform, containers and CI/CD means SMBs can script infrastructure and migrate workloads in hours or days, lowering switching costs. Transparent pricing and API-driven tools allow price/performance comparisons in minutes, increasing customer bargaining power. DigitalOcean counters with platform simplicity, extensive docs and dedicated migration tooling to retain cost-sensitive developers.
Price transparency and comparability
In 2024 per-hour rates, egress fees and storage costs are published transparently across cloud providers, enabling direct price comparability. Buyers systematically benchmark TCO and negotiate credits and committed-use discounts. This transparency compresses margins in commoditized tiers such as basic compute. Bundled credits and usage-based discounts help retain value-conscious users.
Consolidation by scaling startups
As startups scale and consolidate, many centralize workloads on hyperscalers, who held roughly 70% of the IaaS market in 2024 (Gartner), boosting buyer leverage to demand features, stricter SLAs, or discounts to stay. Churn risk notably rises around Series B+ inflection points as customers seek advanced services. DigitalOcean’s managed services and partner ecosystem aim to extend tenure and counter this consolidation pressure.
Demand for performance and SLA guarantees
Latency, uptime, and support responsiveness are pivotal for production workloads, driving larger DigitalOcean customers to demand enhanced SLAs and premium support; failure to meet SLAs can lead to service credits or customer migrations. Tiered support plans and regional redundancy are deployed to meet these expectations and retain high-value clients.
- Latency-sensitive workloads: expect premium SLAs
- Uptime breaches: trigger credits or migrations
- Support tiers: standard to enterprise
- Regional redundancy: reduces migration risk
Multi-cloud procurement norms
- Portability reduces lock-in — 92% multi-cloud (Flexera 2024)
- RFPs amplify price/feature comparisons
- DO strengths: simplicity, predictable egress, developer UX
Multi-cloud buyers and hyperscalers force transparent pricing, squeezing cloud margins
Customer power rose in 2024: 92% of enterprises run multi-cloud (Flexera) and hyperscalers held ~70% IaaS (Gartner), enabling fast price/feature comparisons and lower switching costs.
Transparent per-hour, egress and storage pricing forces TCO benchmarking and discounts, compressing margins in basic compute.
DigitalOcean relies on simplicity, predictable egress, developer UX and tiered support to retain cost-sensitive users.
| Metric | 2024 | Impact |
|---|---|---|
| Multi-cloud | 92% (Flexera) | Reduces lock-in |
| Hyperscaler share | ~70% IaaS (Gartner) | Raises buyer leverage |
| Pricing transparency | Per-hour/egress published | Compresses margins |
Full Version Awaits
DigitalOcean Porter's Five Forces Analysis
This preview is the exact DigitalOcean Porter's Five Forces Analysis you'll receive after purchase—no placeholders or mockups. The full document is professionally formatted, complete and ready to download the moment you buy. What you see here is the final deliverable, prepared for immediate use.











