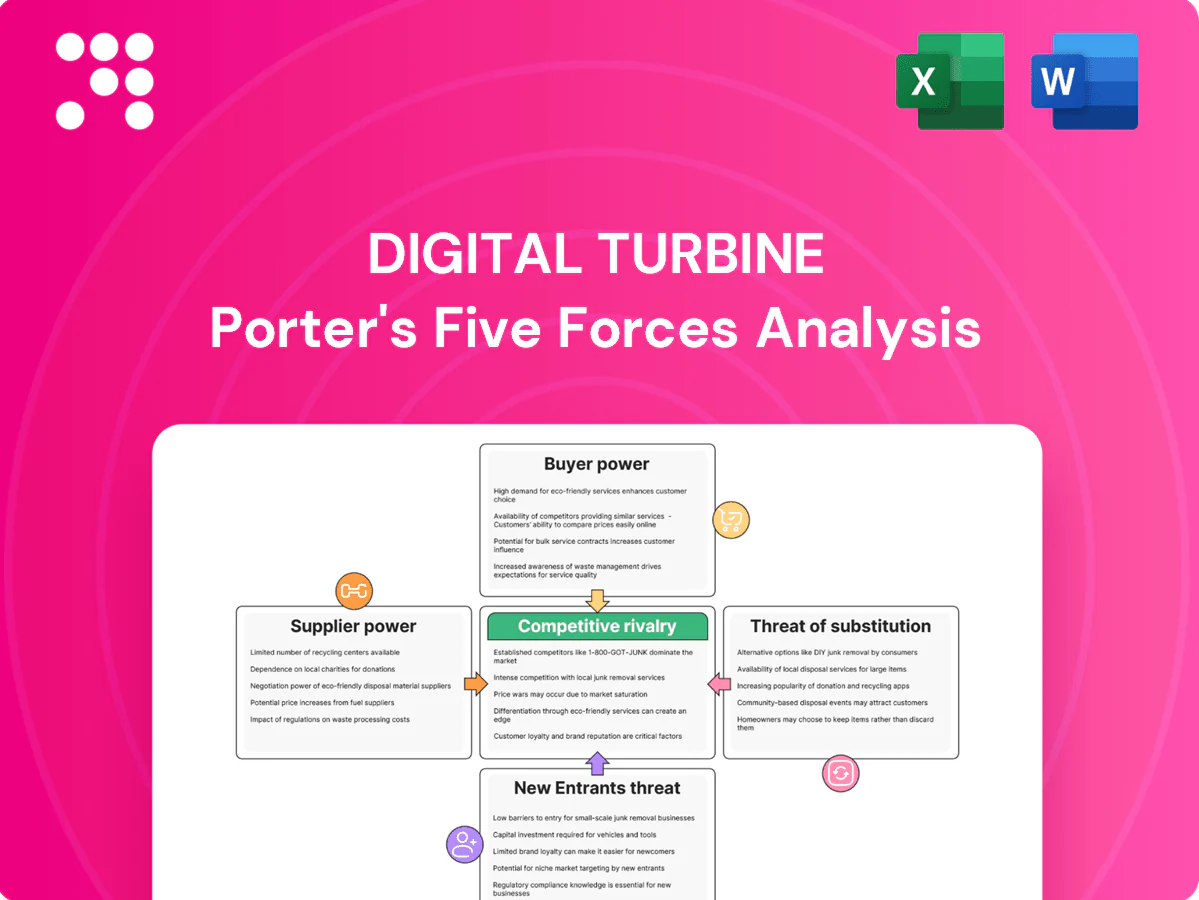
Digital Turbine Porter's Five Forces Analysis

Don't Miss the Bigger Picture
Digital Turbine faces strong buyer scrutiny, platform-dependent supplier dynamics, moderate threat of substitutes, and high competitive rivalry as mobile adtech consolidates; regulatory and scale barriers dampen new entrants. This snapshot only scratches the surface—unlock the full Porter's Five Forces Analysis for force-by-force ratings, visuals, and actionable strategy insights.
Suppliers Bargaining Power

Carrier and OEM gatekeepers
Mobile operators and OEMs exert strong gatekeeper power over on-device placements and preload slots, with global smartphone shipments at ~1.1 billion in 2024 and the top five OEMs capturing roughly 70% of that market, concentrating supplier leverage. Their scale enables aggressive revenue-share and exclusivity demands, while certification and engineering lift make switching carriers/OEMs slow and costly. Multi-year partnerships are common, which can reduce short-term volatility but lock in economics for years.
Platform dependency on Android ecosystem
Google’s OS policies and Privacy Sandbox in 2024 — amid Android’s ~71% global share and OEM licensing rules — constrain access to device-level signals, raising supplier leverage over ad targeting and app distribution. Policy shifts can materially reduce targeting efficacy and force roadmap changes, increasing supplier power. Apple’s iOS (~27% global, ~57% US) limits cross-platform optionality. Compliance engineering has driven development cost/time increases of up to ~15%.

Data, identity, and measurement providers
Attribution partners and anti-fraud vendors drive performance transparency and can materially shift reported ROAS, with iOS attribution moving from deterministic to aggregated models since SKAN/PSA rolled out in 2020–2024. Pricing shifts or signal degradation from SKAN/PSA reduce optimization efficacy and increase UA costs. Diversifying across 2–3 MMPs cuts single-vendor risk but adds integration, latency, and reconciliation overhead. Suppliers gain leverage as 2024 privacy regulation tightens identifier access and compliance burdens.

Cloud and ad tech infrastructure
CDNs, cloud compute and mediation layers underpin Digital Turbine’s delivery and auction stack, and major providers held roughly two-thirds of cloud market share in 2024; usage-based pricing and egress fees squeeze margins at scale. Migration risk raises supplier leverage at renewals, while reserved-capacity deals lower unit costs but demand heavy volume commitments.
- CDNs/cloud compute/mediation: core dependencies
- Pricing pressure: usage + egress fees
- Renewals: vendor leverage via migration risk
- Mitigation: reserved capacity requires volume
Content and premium inventory owners
High-quality app publishers and OEM-owned surfaces are scarce and can command priority placement and higher floor prices. Curated premium supply boosts campaign performance but increases dependency; loss of marquee supply quickly degrades advertiser ROAS and reallocates budgets. In 2024 global mobile ad spend exceeded $300 billion, amplifying supplier leverage.
- Scarcity: few marquee publishers
- Pricing: higher floor prices, priority slots
- Dependency: curated supply raises performance risk
- Impact: loss lowers ROAS, shifts spend
Gatekeeper suppliers squeeze margins: top OEMs, OS dominance and cloud cost pressure
Suppliers hold high leverage: top-5 OEMs ~70% of 1.1B smartphone shipments (2024), Android ~71% and iOS ~27% global share, and mobile ad spend >$300B increase scarcity value. Cloud/CDN majors control ~66% market, driving usage/egress costs. Attribution/privacy shifts (SKAN/PSA) and premium publisher scarcity raise switching costs and margin pressure.
| Supplier | 2024 Metric | Impact |
|---|---|---|
| OEMs | 70% top-5 of 1.1B | High gatekeeper power |
| OS | Android 71%/iOS 27% | Policy risk |
| Cloud/CDN | ~66% share | Cost pressure |
What is included in the product
 Detailed Word Document
Analyzes competitive rivalry, supplier and buyer power, entry barriers, substitutes, and threat of disruption shaping Digital Turbine’s mobile ad-tech position; highlights emerging threats, monetization pressures, and strategic levers to protect market share and margins.

 Customizable Excel Spreadsheet
One-sheet Porter's Five Forces for Digital Turbine—customizable pressure levels and instant spider/radar visuals that simplify competitor, supplier, and buyer dynamics for fast decision-making and easy insertion into decks or dashboards.
Customers Bargaining Power

Advertisers and app developers
Performance advertisers and app developers are highly data-driven and price-sensitive, frequently multi-homing across Meta, Google, AppLovin and others to pressure CPMs and CPIs; Google and Meta together held about 58% of US digital ad spend in 2024 (eMarketer). Budgets shift rapidly when ROAS drops, causing swift reallocation across networks. Proof of incrementality and robust fraud control are essential to retain spend and justify premiums.
Agencies and large UA teams
Agencies and large UA teams centralize multi‑million budgets and enforce strict KPIs, pressuring suppliers for performance-based delivery and custom reporting. They routinely demand flexible billing, bespoke dashboards and staged tests before scaling campaigns. Standardized APIs keep switching costs low, enabling rapid migration between supply partners. To win mandates they often require volume discounts and performance incentives, a trend intensified in 2024.

Global brands seeking reach
Global brands prize premium placements and brand-safety assurances, pushing for fixed CPMs or outcome guarantees; in 2024 global mobile ad spend reached about $370B, increasing pressure on publishers to offer certainty. Digital Turbine’s lack of exclusive audience segments weakens its pricing power versus walled gardens. Co-marketing deals and measurement partnerships (third-party viewability and attribution) help lock multi-quarter commitments and higher-yield deals.

OEMs and carriers as monetization partners
OEMs and carriers act as internal buyers of monetization solutions, using device scale—Android’s roughly 3 billion active devices—as leverage to negotiate higher rev-shares and minimum guarantees.
Failure to hit yield targets risks deal churn and rapid de-prioritization; joint roadmap alignment and product co-development reduce friction and help secure exclusive inventory.
- Negotiation leverage: device scale ~3B
- Terms: rev-shares + minimum guarantees
- Risk: yield miss → deal churn
- Mitigation: joint roadmap → exclusive inventory
Regional and emerging-market buyers
Regional and emerging-market buyers exert stronger bargaining power as price elasticity is higher in cost-sensitive markets, pushing CPMs down and increasing demand for freemium or low-cost bundles; currency volatility and flexible payment terms (local invoicing, longer DSO) become common negotiation levers. Local competitors pack tailored bundles and reseller deals, while localization and lightweight SDKs raise retention and reduce churn in fragmented app ecosystems.
- price sensitivity: higher CPM pressure
- currency risk: payment-term leverage
- local bundles: competitive parity
- SDK/localization: improved stickiness
Duopoly has ~58% ad spend; Android OEMs demand higher rev-shares
Advertisers and app developers are highly price-sensitive and multi-home, pushing CPMs/CPIs down; Google+Meta held ~58% of US digital ad spend in 2024 (eMarketer).
Agencies and UA teams demand performance guarantees, flexible billing and APIs, lowering switching costs and increasing negotiation leverage.
OEMs/carriers leverage Android scale (~3B devices) to extract higher rev-shares and minimum guarantees; global mobile ad spend was ~$370B in 2024.
| Metric | 2024 Value |
|---|---|
| Google+Meta US ad share | ~58% (eMarketer) |
| Global mobile ad spend | ~$370B |
| Android active devices | ~3B |
Preview the Actual Deliverable
Digital Turbine Porter's Five Forces Analysis
This preview shows the exact Porter's Five Forces analysis for Digital Turbine you'll receive immediately after purchase—no placeholders or samples. The full document is professionally formatted, ready for download and use the moment you buy. What you see here is the final deliverable, available instantly with purchase.

Don't Miss the Bigger Picture
Digital Turbine faces strong buyer scrutiny, platform-dependent supplier dynamics, moderate threat of substitutes, and high competitive rivalry as mobile adtech consolidates; regulatory and scale barriers dampen new entrants. This snapshot only scratches the surface—unlock the full Porter's Five Forces Analysis for force-by-force ratings, visuals, and actionable strategy insights.
Suppliers Bargaining Power
Carrier and OEM gatekeepers
Mobile operators and OEMs exert strong gatekeeper power over on-device placements and preload slots, with global smartphone shipments at ~1.1 billion in 2024 and the top five OEMs capturing roughly 70% of that market, concentrating supplier leverage. Their scale enables aggressive revenue-share and exclusivity demands, while certification and engineering lift make switching carriers/OEMs slow and costly. Multi-year partnerships are common, which can reduce short-term volatility but lock in economics for years.
Platform dependency on Android ecosystem
Google’s OS policies and Privacy Sandbox in 2024 — amid Android’s ~71% global share and OEM licensing rules — constrain access to device-level signals, raising supplier leverage over ad targeting and app distribution. Policy shifts can materially reduce targeting efficacy and force roadmap changes, increasing supplier power. Apple’s iOS (~27% global, ~57% US) limits cross-platform optionality. Compliance engineering has driven development cost/time increases of up to ~15%.
Data, identity, and measurement providers
Attribution partners and anti-fraud vendors drive performance transparency and can materially shift reported ROAS, with iOS attribution moving from deterministic to aggregated models since SKAN/PSA rolled out in 2020–2024. Pricing shifts or signal degradation from SKAN/PSA reduce optimization efficacy and increase UA costs. Diversifying across 2–3 MMPs cuts single-vendor risk but adds integration, latency, and reconciliation overhead. Suppliers gain leverage as 2024 privacy regulation tightens identifier access and compliance burdens.
Cloud and ad tech infrastructure
CDNs, cloud compute and mediation layers underpin Digital Turbine’s delivery and auction stack, and major providers held roughly two-thirds of cloud market share in 2024; usage-based pricing and egress fees squeeze margins at scale. Migration risk raises supplier leverage at renewals, while reserved-capacity deals lower unit costs but demand heavy volume commitments.
- CDNs/cloud compute/mediation: core dependencies
- Pricing pressure: usage + egress fees
- Renewals: vendor leverage via migration risk
- Mitigation: reserved capacity requires volume
Content and premium inventory owners
High-quality app publishers and OEM-owned surfaces are scarce and can command priority placement and higher floor prices. Curated premium supply boosts campaign performance but increases dependency; loss of marquee supply quickly degrades advertiser ROAS and reallocates budgets. In 2024 global mobile ad spend exceeded $300 billion, amplifying supplier leverage.
- Scarcity: few marquee publishers
- Pricing: higher floor prices, priority slots
- Dependency: curated supply raises performance risk
- Impact: loss lowers ROAS, shifts spend
Gatekeeper suppliers squeeze margins: top OEMs, OS dominance and cloud cost pressure
Suppliers hold high leverage: top-5 OEMs ~70% of 1.1B smartphone shipments (2024), Android ~71% and iOS ~27% global share, and mobile ad spend >$300B increase scarcity value. Cloud/CDN majors control ~66% market, driving usage/egress costs. Attribution/privacy shifts (SKAN/PSA) and premium publisher scarcity raise switching costs and margin pressure.
| Supplier | 2024 Metric | Impact |
|---|---|---|
| OEMs | 70% top-5 of 1.1B | High gatekeeper power |
| OS | Android 71%/iOS 27% | Policy risk |
| Cloud/CDN | ~66% share | Cost pressure |
What is included in the product
Detailed Word Document
Analyzes competitive rivalry, supplier and buyer power, entry barriers, substitutes, and threat of disruption shaping Digital Turbine’s mobile ad-tech position; highlights emerging threats, monetization pressures, and strategic levers to protect market share and margins.
Customizable Excel Spreadsheet
One-sheet Porter's Five Forces for Digital Turbine—customizable pressure levels and instant spider/radar visuals that simplify competitor, supplier, and buyer dynamics for fast decision-making and easy insertion into decks or dashboards.
Customers Bargaining Power
Advertisers and app developers
Performance advertisers and app developers are highly data-driven and price-sensitive, frequently multi-homing across Meta, Google, AppLovin and others to pressure CPMs and CPIs; Google and Meta together held about 58% of US digital ad spend in 2024 (eMarketer). Budgets shift rapidly when ROAS drops, causing swift reallocation across networks. Proof of incrementality and robust fraud control are essential to retain spend and justify premiums.
Agencies and large UA teams
Agencies and large UA teams centralize multi‑million budgets and enforce strict KPIs, pressuring suppliers for performance-based delivery and custom reporting. They routinely demand flexible billing, bespoke dashboards and staged tests before scaling campaigns. Standardized APIs keep switching costs low, enabling rapid migration between supply partners. To win mandates they often require volume discounts and performance incentives, a trend intensified in 2024.
Global brands seeking reach
Global brands prize premium placements and brand-safety assurances, pushing for fixed CPMs or outcome guarantees; in 2024 global mobile ad spend reached about $370B, increasing pressure on publishers to offer certainty. Digital Turbine’s lack of exclusive audience segments weakens its pricing power versus walled gardens. Co-marketing deals and measurement partnerships (third-party viewability and attribution) help lock multi-quarter commitments and higher-yield deals.
OEMs and carriers as monetization partners
OEMs and carriers act as internal buyers of monetization solutions, using device scale—Android’s roughly 3 billion active devices—as leverage to negotiate higher rev-shares and minimum guarantees.
Failure to hit yield targets risks deal churn and rapid de-prioritization; joint roadmap alignment and product co-development reduce friction and help secure exclusive inventory.
- Negotiation leverage: device scale ~3B
- Terms: rev-shares + minimum guarantees
- Risk: yield miss → deal churn
- Mitigation: joint roadmap → exclusive inventory
Regional and emerging-market buyers
Regional and emerging-market buyers exert stronger bargaining power as price elasticity is higher in cost-sensitive markets, pushing CPMs down and increasing demand for freemium or low-cost bundles; currency volatility and flexible payment terms (local invoicing, longer DSO) become common negotiation levers. Local competitors pack tailored bundles and reseller deals, while localization and lightweight SDKs raise retention and reduce churn in fragmented app ecosystems.
- price sensitivity: higher CPM pressure
- currency risk: payment-term leverage
- local bundles: competitive parity
- SDK/localization: improved stickiness
Duopoly has ~58% ad spend; Android OEMs demand higher rev-shares
Advertisers and app developers are highly price-sensitive and multi-home, pushing CPMs/CPIs down; Google+Meta held ~58% of US digital ad spend in 2024 (eMarketer).
Agencies and UA teams demand performance guarantees, flexible billing and APIs, lowering switching costs and increasing negotiation leverage.
OEMs/carriers leverage Android scale (~3B devices) to extract higher rev-shares and minimum guarantees; global mobile ad spend was ~$370B in 2024.
| Metric | 2024 Value |
|---|---|
| Google+Meta US ad share | ~58% (eMarketer) |
| Global mobile ad spend | ~$370B |
| Android active devices | ~3B |
Preview the Actual Deliverable
Digital Turbine Porter's Five Forces Analysis
This preview shows the exact Porter's Five Forces analysis for Digital Turbine you'll receive immediately after purchase—no placeholders or samples. The full document is professionally formatted, ready for download and use the moment you buy. What you see here is the final deliverable, available instantly with purchase.
Original: $10.00
-65%$10.00
$3.50Description
Don't Miss the Bigger Picture
Digital Turbine faces strong buyer scrutiny, platform-dependent supplier dynamics, moderate threat of substitutes, and high competitive rivalry as mobile adtech consolidates; regulatory and scale barriers dampen new entrants. This snapshot only scratches the surface—unlock the full Porter's Five Forces Analysis for force-by-force ratings, visuals, and actionable strategy insights.
Suppliers Bargaining Power
Carrier and OEM gatekeepers
Mobile operators and OEMs exert strong gatekeeper power over on-device placements and preload slots, with global smartphone shipments at ~1.1 billion in 2024 and the top five OEMs capturing roughly 70% of that market, concentrating supplier leverage. Their scale enables aggressive revenue-share and exclusivity demands, while certification and engineering lift make switching carriers/OEMs slow and costly. Multi-year partnerships are common, which can reduce short-term volatility but lock in economics for years.
Platform dependency on Android ecosystem
Google’s OS policies and Privacy Sandbox in 2024 — amid Android’s ~71% global share and OEM licensing rules — constrain access to device-level signals, raising supplier leverage over ad targeting and app distribution. Policy shifts can materially reduce targeting efficacy and force roadmap changes, increasing supplier power. Apple’s iOS (~27% global, ~57% US) limits cross-platform optionality. Compliance engineering has driven development cost/time increases of up to ~15%.
Data, identity, and measurement providers
Attribution partners and anti-fraud vendors drive performance transparency and can materially shift reported ROAS, with iOS attribution moving from deterministic to aggregated models since SKAN/PSA rolled out in 2020–2024. Pricing shifts or signal degradation from SKAN/PSA reduce optimization efficacy and increase UA costs. Diversifying across 2–3 MMPs cuts single-vendor risk but adds integration, latency, and reconciliation overhead. Suppliers gain leverage as 2024 privacy regulation tightens identifier access and compliance burdens.
Cloud and ad tech infrastructure
CDNs, cloud compute and mediation layers underpin Digital Turbine’s delivery and auction stack, and major providers held roughly two-thirds of cloud market share in 2024; usage-based pricing and egress fees squeeze margins at scale. Migration risk raises supplier leverage at renewals, while reserved-capacity deals lower unit costs but demand heavy volume commitments.
- CDNs/cloud compute/mediation: core dependencies
- Pricing pressure: usage + egress fees
- Renewals: vendor leverage via migration risk
- Mitigation: reserved capacity requires volume
Content and premium inventory owners
High-quality app publishers and OEM-owned surfaces are scarce and can command priority placement and higher floor prices. Curated premium supply boosts campaign performance but increases dependency; loss of marquee supply quickly degrades advertiser ROAS and reallocates budgets. In 2024 global mobile ad spend exceeded $300 billion, amplifying supplier leverage.
- Scarcity: few marquee publishers
- Pricing: higher floor prices, priority slots
- Dependency: curated supply raises performance risk
- Impact: loss lowers ROAS, shifts spend
Gatekeeper suppliers squeeze margins: top OEMs, OS dominance and cloud cost pressure
Suppliers hold high leverage: top-5 OEMs ~70% of 1.1B smartphone shipments (2024), Android ~71% and iOS ~27% global share, and mobile ad spend >$300B increase scarcity value. Cloud/CDN majors control ~66% market, driving usage/egress costs. Attribution/privacy shifts (SKAN/PSA) and premium publisher scarcity raise switching costs and margin pressure.
| Supplier | 2024 Metric | Impact |
|---|---|---|
| OEMs | 70% top-5 of 1.1B | High gatekeeper power |
| OS | Android 71%/iOS 27% | Policy risk |
| Cloud/CDN | ~66% share | Cost pressure |
What is included in the product
Detailed Word Document
Analyzes competitive rivalry, supplier and buyer power, entry barriers, substitutes, and threat of disruption shaping Digital Turbine’s mobile ad-tech position; highlights emerging threats, monetization pressures, and strategic levers to protect market share and margins.
Customizable Excel Spreadsheet
One-sheet Porter's Five Forces for Digital Turbine—customizable pressure levels and instant spider/radar visuals that simplify competitor, supplier, and buyer dynamics for fast decision-making and easy insertion into decks or dashboards.
Customers Bargaining Power
Advertisers and app developers
Performance advertisers and app developers are highly data-driven and price-sensitive, frequently multi-homing across Meta, Google, AppLovin and others to pressure CPMs and CPIs; Google and Meta together held about 58% of US digital ad spend in 2024 (eMarketer). Budgets shift rapidly when ROAS drops, causing swift reallocation across networks. Proof of incrementality and robust fraud control are essential to retain spend and justify premiums.
Agencies and large UA teams
Agencies and large UA teams centralize multi‑million budgets and enforce strict KPIs, pressuring suppliers for performance-based delivery and custom reporting. They routinely demand flexible billing, bespoke dashboards and staged tests before scaling campaigns. Standardized APIs keep switching costs low, enabling rapid migration between supply partners. To win mandates they often require volume discounts and performance incentives, a trend intensified in 2024.
Global brands seeking reach
Global brands prize premium placements and brand-safety assurances, pushing for fixed CPMs or outcome guarantees; in 2024 global mobile ad spend reached about $370B, increasing pressure on publishers to offer certainty. Digital Turbine’s lack of exclusive audience segments weakens its pricing power versus walled gardens. Co-marketing deals and measurement partnerships (third-party viewability and attribution) help lock multi-quarter commitments and higher-yield deals.
OEMs and carriers as monetization partners
OEMs and carriers act as internal buyers of monetization solutions, using device scale—Android’s roughly 3 billion active devices—as leverage to negotiate higher rev-shares and minimum guarantees.
Failure to hit yield targets risks deal churn and rapid de-prioritization; joint roadmap alignment and product co-development reduce friction and help secure exclusive inventory.
- Negotiation leverage: device scale ~3B
- Terms: rev-shares + minimum guarantees
- Risk: yield miss → deal churn
- Mitigation: joint roadmap → exclusive inventory
Regional and emerging-market buyers
Regional and emerging-market buyers exert stronger bargaining power as price elasticity is higher in cost-sensitive markets, pushing CPMs down and increasing demand for freemium or low-cost bundles; currency volatility and flexible payment terms (local invoicing, longer DSO) become common negotiation levers. Local competitors pack tailored bundles and reseller deals, while localization and lightweight SDKs raise retention and reduce churn in fragmented app ecosystems.
- price sensitivity: higher CPM pressure
- currency risk: payment-term leverage
- local bundles: competitive parity
- SDK/localization: improved stickiness
Duopoly has ~58% ad spend; Android OEMs demand higher rev-shares
Advertisers and app developers are highly price-sensitive and multi-home, pushing CPMs/CPIs down; Google+Meta held ~58% of US digital ad spend in 2024 (eMarketer).
Agencies and UA teams demand performance guarantees, flexible billing and APIs, lowering switching costs and increasing negotiation leverage.
OEMs/carriers leverage Android scale (~3B devices) to extract higher rev-shares and minimum guarantees; global mobile ad spend was ~$370B in 2024.
| Metric | 2024 Value |
|---|---|
| Google+Meta US ad share | ~58% (eMarketer) |
| Global mobile ad spend | ~$370B |
| Android active devices | ~3B |
Preview the Actual Deliverable
Digital Turbine Porter's Five Forces Analysis
This preview shows the exact Porter's Five Forces analysis for Digital Turbine you'll receive immediately after purchase—no placeholders or samples. The full document is professionally formatted, ready for download and use the moment you buy. What you see here is the final deliverable, available instantly with purchase.











