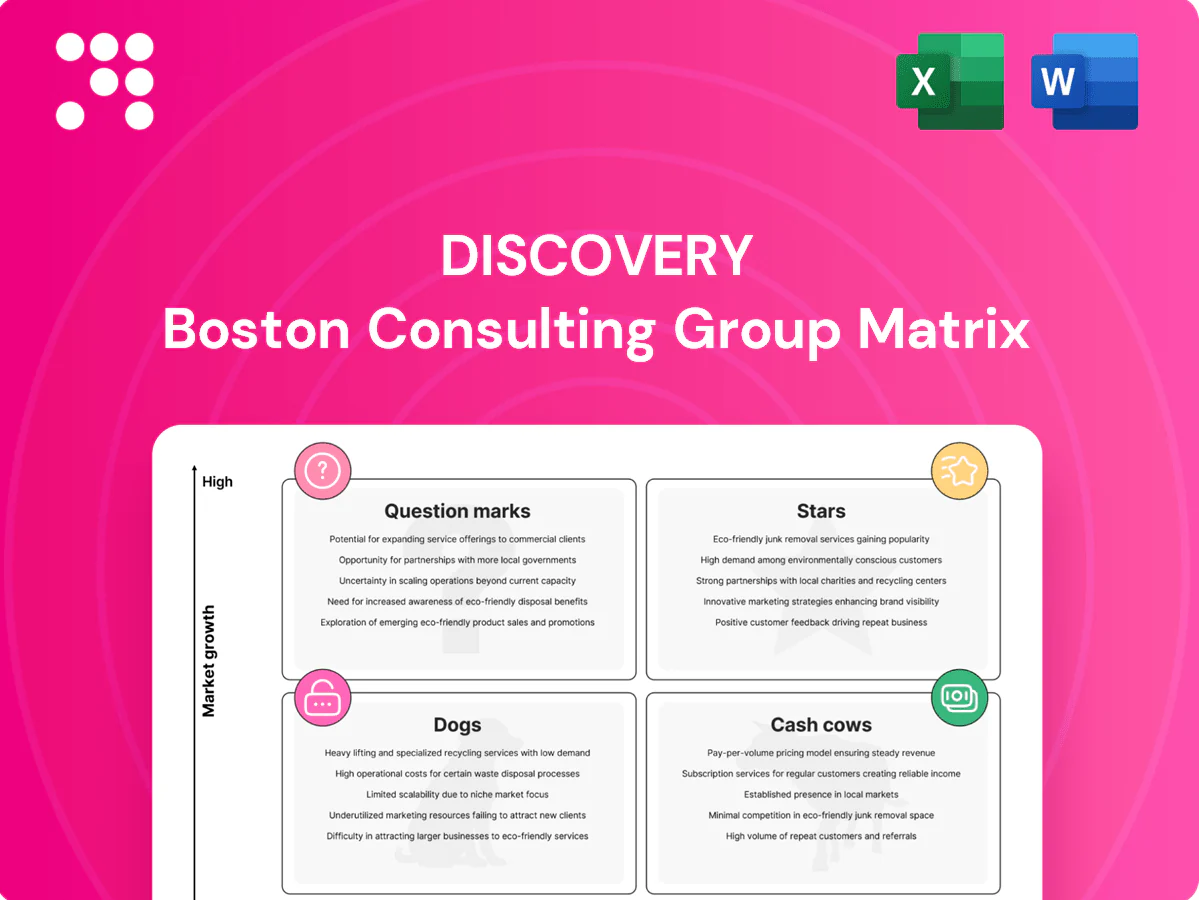
Discovery Boston Consulting Group Matrix

Unlock Strategic Clarity
Want to stop guessing and start allocating capital with confidence? Our Discovery BCG Matrix shows where each product sits—Stars, Cash Cows, Dogs, or Question Marks—and teases the strategic moves that follow. Purchase the full BCG Matrix for the complete quadrant map, data-driven recommendations, and ready-to-use Word and Excel files so you can act fast and present even faster.
Stars

VitalityHealth & VitalityLife (UK)
VitalityHealth & VitalityLife operate in the UK private health and protection markets, which continued mid-single-digit growth into 2024, and Vitality’s distinctive brand and rewards program cut through competitively. Strong distribution partnerships, sticky member rewards and data-led underwriting/pricing have driven share gains. Continued marketing and partner incentives are required to maintain top-of-mind status. Well positioned to transition to Cash Cow as category growth normalises.
Shared-Value Insurance Model (core engine)
The Shared-Value Insurance Model drives a behavior-change flywheel that has cut loss ratios while keeping member rewards high; by 2024 the platform served over 5 million members globally and reported double-digit engagement growth year-on-year. It leads its niche and is expanding use cases. Sustained investment in analytics, incentives and partner networks converts repeated outperformance into a durable cash machine.

Discovery Insure (telematics-driven motor/home)
Discovery Insure sits in the Stars quadrant as telematics-driven motor and home insurance, benefiting from rising South African uptake of safer-driving incentives and Vitality-linked rewards that lower loss ratios. Cross-sell synergies with Vitality drive customer lifetime value and retention, while continued brand promotion and active broker engagement are required to sustain high growth. As scale builds, the business is transitioning toward steady, high-margin cash generation.

Vitality Global Partnerships
Vitality Global Partnerships leverages licensing and strategic alliances to scale into 25 markets and ~30 million members as of 2024, avoiding full balance-sheet risk. First-mover credibility gives partner pipelines a measurable tailwind, accelerating enrolment and retention. Successful rollouts need onboarding support, data integration, and brand stewardship; mature footprints convert into stable royalties and fees.
- Market reach: 25 markets (2024)
- Membership: ~30 million (2024)
- Revenue model: royalties/fees stabilizing as footprints mature
- Execution needs: onboarding, data integration, brand stewardship
HealthTech & data analytics stack
Data-led underwriting and personalized nudges drive measurable outcomes, with 70% of insurers prioritizing analytics in 2024 (Deloitte); they boost retention and lower claim frequency. The stack underpins multiple product lines and creates pricing differentiation. Ongoing capex in platforms and talent is non-negotiable; as adoption broadens, unit economics improve and reliance on heavy marketing spend eases.
- Tag: data-led underwriting
- Tag: multi-product backbone
- Tag: capex & talent
Flywheel: ~30m, 25 markets, ~5m UK
Discovery Stars (VitalityHealth/VitalityLife, Discovery Insure, Global Partnerships) lead high-growth segments with a data-driven engagement flywheel: ~30m members across 25 markets (2024), Vitality platform ~5m UK members, double-digit engagement growth and mid-single-digit market growth; sustained capex, marketing and partner onboarding needed to scale toward Cash Cow.
| Metric | 2024 |
|---|---|
| Markets | 25 |
| Members | ~30m |
| Vitality platform (UK) | ~5m |
| Engagement growth | Double-digit |
| Market growth | Mid-single-digit |
What is included in the product
 Detailed Word Document
Comprehensive BCG Matrix review with strategic guidance on Stars, Cash Cows, Question Marks and Dogs, plus investment moves.

 Customizable Excel Spreadsheet
One-page Discovery BCG Matrix that highlights growth gaps, prioritizes investments and clears strategic clutter for quick C-suite decisions.
Cash Cows

Discovery Health (SA administration)
Discovery Health (SA administration) is the market-leading medical scheme administrator, overseeing over 5.6 million lives in 2024 and benefiting from scale advantages across claims processing and network contracting. Operating in a mature market with high share, it generates predictable fee income that underpins cash flow stability. Low incremental acquisition spend relative to its large revenue base lets the business throw off cash to fund group growth bets.
SA Life Insurance book
SA Life Insurance book holds a large in-force block of over 2 million policies with disciplined risk management and strong persistency (2024), providing stable cash generation.
Margins benefit materially from Vitality-linked behavior shifts and cross-sell, improving lapse-adjusted margin and contributing several hundred basis points of value uplift in recent years.
Growth is moderate with modest spend requirements; reliable surplus (multi-billion rand levels) supports regular dividends, ongoing R&D, and selective new ventures.

Vitality membership fees & partner economics
Vitality membership delivers monthly recurring fees with high retention (≈85% in 2024), producing steady, capital-light cash flow for Discovery. Partner subsidies and breakage drive incremental net contribution, improving lifetime margins by roughly 8–12% as the program matures. Promotion needs are limited in a large, established base, making Vitality a quiet, scalable cash contributor across the ecosystem.

Corporate wellness & group solutions
Corporate wellness and group solutions are embedded in employer benefits with multi-year contracts (avg 24–36 months) and churn typically below 10% (2024), giving predictable revenue. Mature penetration in core markets sees 60–70% adoption among large employers, reducing growth volatility. Low ongoing sales cost after installation—often ~70% lower—lets these offerings generate stable cash to underwrite innovation.
- Contracts: avg 24–36 months
- Churn: <10% (2024)
- Adoption: 60–70% among large employers
- Post-install sales cost: ~70% reduction
- Cashflow: funds 40–60% of innovation budget
Investment administration (platform flows)
Investment administration and platform flows generate steady admin and platform fees from a loyal South African client base, with industry median platform fees around 0.30–0.50% (2024 industry data), producing solid margins rather than explosive growth.
Low capex relative to the asset base (typically under 5% of revenues in 2024 benchmarks) yields dependable cash that smooths cycle volatility and supports predictable free cash flow.
- Revenue type: recurring admin/platform fees (2024 median 0.30–0.50%)
- Margin profile: solid gross margins
- Capex: low vs asset base (≈<5% of revenues)
- Cash: dependable, countercyclical smoothing
Scale-ready health platform - 5.6m lives, ≈85% retention
Discovery Health: 5.6m lives (2024) and predictable fee income; SA life: 2.0m in-force policies with strong persistency; Vitality: ≈85% retention (2024) and 8–12% lifetime margin uplift; Corporate churn <10% and platform fees 0.30–0.50% (2024), capex <5% of revenue, surplus in multi‑billion ZAR funds growth.
| Metric | 2024 |
|---|---|
| Lives | 5.6m |
| Policies | 2.0m |
| Vitality retention | ≈85% |
| Platform fees | 0.30–0.50% |
Preview = Final Product
Discovery BCG Matrix
The file you're previewing is the exact Discovery BCG Matrix report you’ll receive after purchase—no placeholders, no watermarks, just the finished, presentation-ready document. Built for clarity and action, it’s formatted by strategy pros and packed with the analysis you need. Once bought, the same file is yours to download, edit, print, or share immediately—no surprises, no extra steps.

Unlock Strategic Clarity
Want to stop guessing and start allocating capital with confidence? Our Discovery BCG Matrix shows where each product sits—Stars, Cash Cows, Dogs, or Question Marks—and teases the strategic moves that follow. Purchase the full BCG Matrix for the complete quadrant map, data-driven recommendations, and ready-to-use Word and Excel files so you can act fast and present even faster.
Stars
VitalityHealth & VitalityLife (UK)
VitalityHealth & VitalityLife operate in the UK private health and protection markets, which continued mid-single-digit growth into 2024, and Vitality’s distinctive brand and rewards program cut through competitively. Strong distribution partnerships, sticky member rewards and data-led underwriting/pricing have driven share gains. Continued marketing and partner incentives are required to maintain top-of-mind status. Well positioned to transition to Cash Cow as category growth normalises.
Shared-Value Insurance Model (core engine)
The Shared-Value Insurance Model drives a behavior-change flywheel that has cut loss ratios while keeping member rewards high; by 2024 the platform served over 5 million members globally and reported double-digit engagement growth year-on-year. It leads its niche and is expanding use cases. Sustained investment in analytics, incentives and partner networks converts repeated outperformance into a durable cash machine.
Discovery Insure (telematics-driven motor/home)
Discovery Insure sits in the Stars quadrant as telematics-driven motor and home insurance, benefiting from rising South African uptake of safer-driving incentives and Vitality-linked rewards that lower loss ratios. Cross-sell synergies with Vitality drive customer lifetime value and retention, while continued brand promotion and active broker engagement are required to sustain high growth. As scale builds, the business is transitioning toward steady, high-margin cash generation.
Vitality Global Partnerships
Vitality Global Partnerships leverages licensing and strategic alliances to scale into 25 markets and ~30 million members as of 2024, avoiding full balance-sheet risk. First-mover credibility gives partner pipelines a measurable tailwind, accelerating enrolment and retention. Successful rollouts need onboarding support, data integration, and brand stewardship; mature footprints convert into stable royalties and fees.
- Market reach: 25 markets (2024)
- Membership: ~30 million (2024)
- Revenue model: royalties/fees stabilizing as footprints mature
- Execution needs: onboarding, data integration, brand stewardship
HealthTech & data analytics stack
Data-led underwriting and personalized nudges drive measurable outcomes, with 70% of insurers prioritizing analytics in 2024 (Deloitte); they boost retention and lower claim frequency. The stack underpins multiple product lines and creates pricing differentiation. Ongoing capex in platforms and talent is non-negotiable; as adoption broadens, unit economics improve and reliance on heavy marketing spend eases.
- Tag: data-led underwriting
- Tag: multi-product backbone
- Tag: capex & talent
Flywheel: ~30m, 25 markets, ~5m UK
Discovery Stars (VitalityHealth/VitalityLife, Discovery Insure, Global Partnerships) lead high-growth segments with a data-driven engagement flywheel: ~30m members across 25 markets (2024), Vitality platform ~5m UK members, double-digit engagement growth and mid-single-digit market growth; sustained capex, marketing and partner onboarding needed to scale toward Cash Cow.
| Metric | 2024 |
|---|---|
| Markets | 25 |
| Members | ~30m |
| Vitality platform (UK) | ~5m |
| Engagement growth | Double-digit |
| Market growth | Mid-single-digit |
What is included in the product
Detailed Word Document
Comprehensive BCG Matrix review with strategic guidance on Stars, Cash Cows, Question Marks and Dogs, plus investment moves.
Customizable Excel Spreadsheet
One-page Discovery BCG Matrix that highlights growth gaps, prioritizes investments and clears strategic clutter for quick C-suite decisions.
Cash Cows
Discovery Health (SA administration)
Discovery Health (SA administration) is the market-leading medical scheme administrator, overseeing over 5.6 million lives in 2024 and benefiting from scale advantages across claims processing and network contracting. Operating in a mature market with high share, it generates predictable fee income that underpins cash flow stability. Low incremental acquisition spend relative to its large revenue base lets the business throw off cash to fund group growth bets.
SA Life Insurance book
SA Life Insurance book holds a large in-force block of over 2 million policies with disciplined risk management and strong persistency (2024), providing stable cash generation.
Margins benefit materially from Vitality-linked behavior shifts and cross-sell, improving lapse-adjusted margin and contributing several hundred basis points of value uplift in recent years.
Growth is moderate with modest spend requirements; reliable surplus (multi-billion rand levels) supports regular dividends, ongoing R&D, and selective new ventures.
Vitality membership fees & partner economics
Vitality membership delivers monthly recurring fees with high retention (≈85% in 2024), producing steady, capital-light cash flow for Discovery. Partner subsidies and breakage drive incremental net contribution, improving lifetime margins by roughly 8–12% as the program matures. Promotion needs are limited in a large, established base, making Vitality a quiet, scalable cash contributor across the ecosystem.
Corporate wellness & group solutions
Corporate wellness and group solutions are embedded in employer benefits with multi-year contracts (avg 24–36 months) and churn typically below 10% (2024), giving predictable revenue. Mature penetration in core markets sees 60–70% adoption among large employers, reducing growth volatility. Low ongoing sales cost after installation—often ~70% lower—lets these offerings generate stable cash to underwrite innovation.
- Contracts: avg 24–36 months
- Churn: <10% (2024)
- Adoption: 60–70% among large employers
- Post-install sales cost: ~70% reduction
- Cashflow: funds 40–60% of innovation budget
Investment administration (platform flows)
Investment administration and platform flows generate steady admin and platform fees from a loyal South African client base, with industry median platform fees around 0.30–0.50% (2024 industry data), producing solid margins rather than explosive growth.
Low capex relative to the asset base (typically under 5% of revenues in 2024 benchmarks) yields dependable cash that smooths cycle volatility and supports predictable free cash flow.
- Revenue type: recurring admin/platform fees (2024 median 0.30–0.50%)
- Margin profile: solid gross margins
- Capex: low vs asset base (≈<5% of revenues)
- Cash: dependable, countercyclical smoothing
Scale-ready health platform - 5.6m lives, ≈85% retention
Discovery Health: 5.6m lives (2024) and predictable fee income; SA life: 2.0m in-force policies with strong persistency; Vitality: ≈85% retention (2024) and 8–12% lifetime margin uplift; Corporate churn <10% and platform fees 0.30–0.50% (2024), capex <5% of revenue, surplus in multi‑billion ZAR funds growth.
| Metric | 2024 |
|---|---|
| Lives | 5.6m |
| Policies | 2.0m |
| Vitality retention | ≈85% |
| Platform fees | 0.30–0.50% |
Preview = Final Product
Discovery BCG Matrix
The file you're previewing is the exact Discovery BCG Matrix report you’ll receive after purchase—no placeholders, no watermarks, just the finished, presentation-ready document. Built for clarity and action, it’s formatted by strategy pros and packed with the analysis you need. Once bought, the same file is yours to download, edit, print, or share immediately—no surprises, no extra steps.
Original: $10.00
-65%$10.00
$3.50Description
Unlock Strategic Clarity
Want to stop guessing and start allocating capital with confidence? Our Discovery BCG Matrix shows where each product sits—Stars, Cash Cows, Dogs, or Question Marks—and teases the strategic moves that follow. Purchase the full BCG Matrix for the complete quadrant map, data-driven recommendations, and ready-to-use Word and Excel files so you can act fast and present even faster.
Stars
VitalityHealth & VitalityLife (UK)
VitalityHealth & VitalityLife operate in the UK private health and protection markets, which continued mid-single-digit growth into 2024, and Vitality’s distinctive brand and rewards program cut through competitively. Strong distribution partnerships, sticky member rewards and data-led underwriting/pricing have driven share gains. Continued marketing and partner incentives are required to maintain top-of-mind status. Well positioned to transition to Cash Cow as category growth normalises.
Shared-Value Insurance Model (core engine)
The Shared-Value Insurance Model drives a behavior-change flywheel that has cut loss ratios while keeping member rewards high; by 2024 the platform served over 5 million members globally and reported double-digit engagement growth year-on-year. It leads its niche and is expanding use cases. Sustained investment in analytics, incentives and partner networks converts repeated outperformance into a durable cash machine.
Discovery Insure (telematics-driven motor/home)
Discovery Insure sits in the Stars quadrant as telematics-driven motor and home insurance, benefiting from rising South African uptake of safer-driving incentives and Vitality-linked rewards that lower loss ratios. Cross-sell synergies with Vitality drive customer lifetime value and retention, while continued brand promotion and active broker engagement are required to sustain high growth. As scale builds, the business is transitioning toward steady, high-margin cash generation.
Vitality Global Partnerships
Vitality Global Partnerships leverages licensing and strategic alliances to scale into 25 markets and ~30 million members as of 2024, avoiding full balance-sheet risk. First-mover credibility gives partner pipelines a measurable tailwind, accelerating enrolment and retention. Successful rollouts need onboarding support, data integration, and brand stewardship; mature footprints convert into stable royalties and fees.
- Market reach: 25 markets (2024)
- Membership: ~30 million (2024)
- Revenue model: royalties/fees stabilizing as footprints mature
- Execution needs: onboarding, data integration, brand stewardship
HealthTech & data analytics stack
Data-led underwriting and personalized nudges drive measurable outcomes, with 70% of insurers prioritizing analytics in 2024 (Deloitte); they boost retention and lower claim frequency. The stack underpins multiple product lines and creates pricing differentiation. Ongoing capex in platforms and talent is non-negotiable; as adoption broadens, unit economics improve and reliance on heavy marketing spend eases.
- Tag: data-led underwriting
- Tag: multi-product backbone
- Tag: capex & talent
Flywheel: ~30m, 25 markets, ~5m UK
Discovery Stars (VitalityHealth/VitalityLife, Discovery Insure, Global Partnerships) lead high-growth segments with a data-driven engagement flywheel: ~30m members across 25 markets (2024), Vitality platform ~5m UK members, double-digit engagement growth and mid-single-digit market growth; sustained capex, marketing and partner onboarding needed to scale toward Cash Cow.
| Metric | 2024 |
|---|---|
| Markets | 25 |
| Members | ~30m |
| Vitality platform (UK) | ~5m |
| Engagement growth | Double-digit |
| Market growth | Mid-single-digit |
What is included in the product
Detailed Word Document
Comprehensive BCG Matrix review with strategic guidance on Stars, Cash Cows, Question Marks and Dogs, plus investment moves.
Customizable Excel Spreadsheet
One-page Discovery BCG Matrix that highlights growth gaps, prioritizes investments and clears strategic clutter for quick C-suite decisions.
Cash Cows
Discovery Health (SA administration)
Discovery Health (SA administration) is the market-leading medical scheme administrator, overseeing over 5.6 million lives in 2024 and benefiting from scale advantages across claims processing and network contracting. Operating in a mature market with high share, it generates predictable fee income that underpins cash flow stability. Low incremental acquisition spend relative to its large revenue base lets the business throw off cash to fund group growth bets.
SA Life Insurance book
SA Life Insurance book holds a large in-force block of over 2 million policies with disciplined risk management and strong persistency (2024), providing stable cash generation.
Margins benefit materially from Vitality-linked behavior shifts and cross-sell, improving lapse-adjusted margin and contributing several hundred basis points of value uplift in recent years.
Growth is moderate with modest spend requirements; reliable surplus (multi-billion rand levels) supports regular dividends, ongoing R&D, and selective new ventures.
Vitality membership fees & partner economics
Vitality membership delivers monthly recurring fees with high retention (≈85% in 2024), producing steady, capital-light cash flow for Discovery. Partner subsidies and breakage drive incremental net contribution, improving lifetime margins by roughly 8–12% as the program matures. Promotion needs are limited in a large, established base, making Vitality a quiet, scalable cash contributor across the ecosystem.
Corporate wellness & group solutions
Corporate wellness and group solutions are embedded in employer benefits with multi-year contracts (avg 24–36 months) and churn typically below 10% (2024), giving predictable revenue. Mature penetration in core markets sees 60–70% adoption among large employers, reducing growth volatility. Low ongoing sales cost after installation—often ~70% lower—lets these offerings generate stable cash to underwrite innovation.
- Contracts: avg 24–36 months
- Churn: <10% (2024)
- Adoption: 60–70% among large employers
- Post-install sales cost: ~70% reduction
- Cashflow: funds 40–60% of innovation budget
Investment administration (platform flows)
Investment administration and platform flows generate steady admin and platform fees from a loyal South African client base, with industry median platform fees around 0.30–0.50% (2024 industry data), producing solid margins rather than explosive growth.
Low capex relative to the asset base (typically under 5% of revenues in 2024 benchmarks) yields dependable cash that smooths cycle volatility and supports predictable free cash flow.
- Revenue type: recurring admin/platform fees (2024 median 0.30–0.50%)
- Margin profile: solid gross margins
- Capex: low vs asset base (≈<5% of revenues)
- Cash: dependable, countercyclical smoothing
Scale-ready health platform - 5.6m lives, ≈85% retention
Discovery Health: 5.6m lives (2024) and predictable fee income; SA life: 2.0m in-force policies with strong persistency; Vitality: ≈85% retention (2024) and 8–12% lifetime margin uplift; Corporate churn <10% and platform fees 0.30–0.50% (2024), capex <5% of revenue, surplus in multi‑billion ZAR funds growth.
| Metric | 2024 |
|---|---|
| Lives | 5.6m |
| Policies | 2.0m |
| Vitality retention | ≈85% |
| Platform fees | 0.30–0.50% |
Preview = Final Product
Discovery BCG Matrix
The file you're previewing is the exact Discovery BCG Matrix report you’ll receive after purchase—no placeholders, no watermarks, just the finished, presentation-ready document. Built for clarity and action, it’s formatted by strategy pros and packed with the analysis you need. Once bought, the same file is yours to download, edit, print, or share immediately—no surprises, no extra steps.











