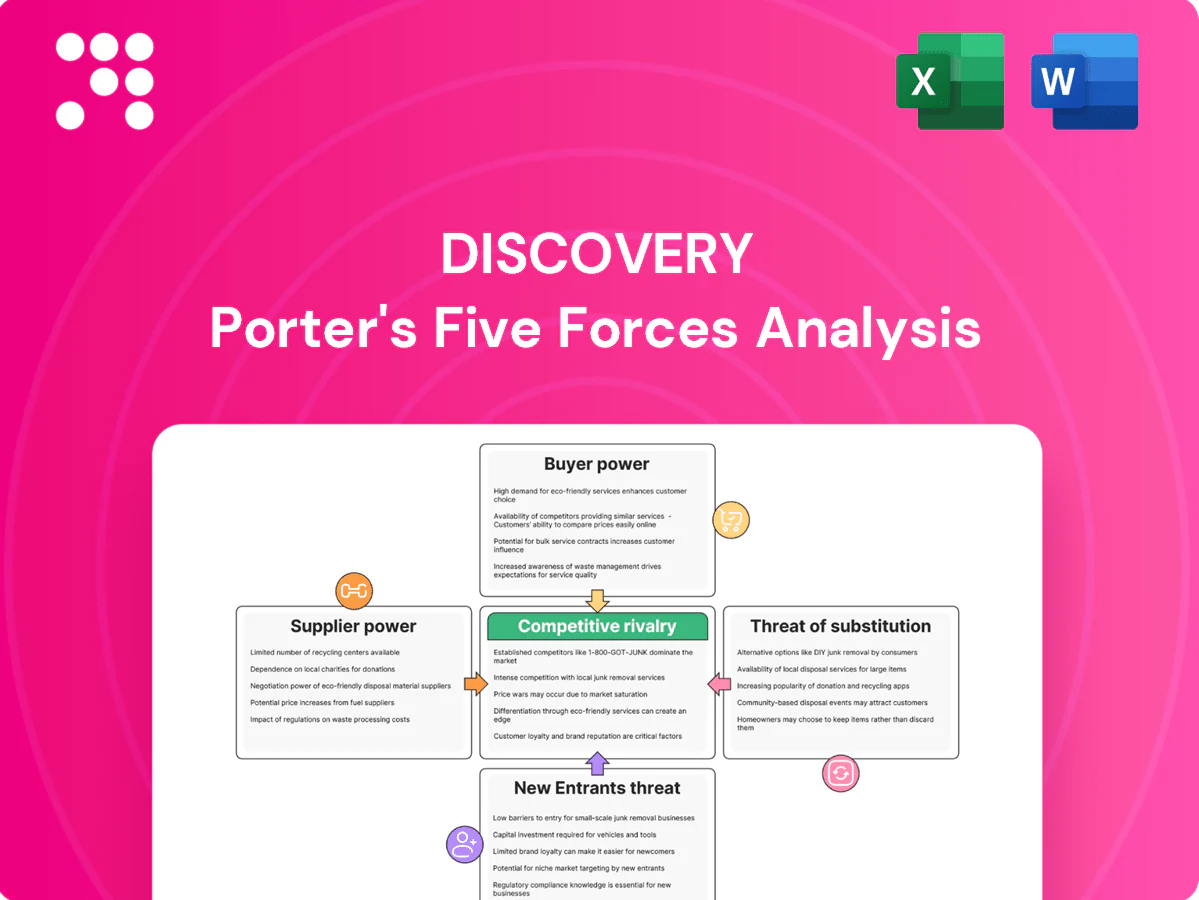
Discovery Porter's Five Forces Analysis

From Overview to Strategy Blueprint
Discover how Discovery navigates competitive rivalry, supplier and buyer power, threats from new entrants and substitutes, and industry regulation in this concise Porter's Five Forces snapshot. This overview highlights strategic pressures shaping profitability and growth. Ready for deeper, data-driven insights? Unlock the full Porter's Five Forces Analysis to inform investment and strategy decisions.
Suppliers Bargaining Power

Concentrated reinsurers
Discovery relies on a small panel of highly rated reinsurers to optimize capital and cede catastrophe exposure, giving those reinsurers pricing and term leverage in negotiations.
Diversifying across counterparties reduces single-counterparty exposure, but 2024 capacity cycles and concentration (top 10 reinsurers ~70% market share) can tighten terms and raise ceding costs.
Strong loss experience, robust actuarial data and transparent claims history improve Discovery's bargaining position and can partially offset supplier power.
Healthcare provider networks
Access to hospitals, clinicians and diagnostic networks is critical for product value and claims outcomes; in South Africa private medical schemes cover ~16% (~9.6m people) in 2024 and in the UK the NHS still provides roughly 80% of hospital activity with the private sector supplying much of elective capacity, letting large hospital groups and specialist clusters command favourable tariffs. Long-term contracts and selective networks improve rate control but can restrict member choice, while clinical quality programmes and data-sharing (outcome registries, claims analytics) can rebalance bargaining power by linking payment to performance.

Data, analytics, and tech vendors
Telematics, wearables and cloud platforms drive underwriting precision—usage-based policies cover ~20% of US auto policies in 2024 and telematics programs report 15–25% lower claim frequency. Vendor switching costs and integration complexity raise dependency, while partnerships with device makers and big cloud players (AWS ~32%, Azure ~23% market share in 2024) can compress margins; proprietary analytics reduce supplier leverage over time.

Distribution partners and intermediaries
Brokers, IFAs and bancassurance partners drive Discovery’s new business volumes and product mix, with high-producing intermediaries able to negotiate higher commissions and co-funded marketing support. Discovery’s expanding direct and digital channels reduce but do not eliminate reliance on these intermediaries, keeping supplier bargaining power significant. Performance-linked remuneration and product exclusivity are used to better align incentives and protect margins.
- Channels: brokers/IFAs/bancassurance
- Leverage: high-producer commission demands
- Mitigant: direct/digital distribution
- Alignment: performance pay and exclusivity
Rewards and lifestyle partners
Loyalty, travel, retail and gym partners are core to Vitality rewards; popular brands leverage member demand to negotiate premium visibility and economics, with 2024 industry benchmarks showing top partners capture about 30% of program spend, boosting their leverage.
- Partner concentration: top brands ≈30% of spend (2024)
- Ecosystem breadth: hundreds of partners dilute single-partner power
- Data ROI: analytics enable balanced commercial terms
Concentrated reinsurers, hospitals and cloud vendors amplify supplier power and switching costs
Discovery faces concentrated supplier power from reinsurers (top 10 ≈70% share in 2024) and large hospital groups (SA private schemes ≈16% population, ~9.6m). Tech and cloud vendors (AWS ≈32%, Azure ≈23% in 2024) and telematics/device providers (usage-based ≈20% US auto) raise switching costs. Brokers and top Vitality partners (top brands ≈30% of spend) retain negotiating leverage despite direct channels and proprietary analytics.
| Supplier | 2024 metric |
|---|---|
| Reinsurers | Top10 ≈70% share |
| SA private schemes | 16% pop, ~9.6m |
| Cloud | AWS 32%, Azure 23% |
| Telematics | Usage-based ≈20% US auto |
What is included in the product
 Detailed Word Document
Tailored Porter's Five Forces analysis for Discovery that uncovers key competitive drivers, buyer and supplier power, substitutes and entry threats, and identifies disruptive forces and strategic levers to protect market share and inform investor or internal strategy materials.

 Customizable Excel Spreadsheet
One-sheet Porter's Five Forces for Discovery that visualizes competitive pressure in a radar chart, lets you tweak force levels with new data, and exports cleanly into decks—so teams can quickly spot threats, test scenarios, and align strategy without complex tools.
Customers Bargaining Power

Price-sensitive retail customers
Price-sensitive retail customers increasingly compare premiums and benefits across digital platforms; in 2024 about 62% of insurance shoppers used online comparison tools, intensifying price pressure on commoditized covers. Discovery counters with Vitality-linked savings and benefits that complicate like-for-like comparisons and support higher perceived value. Persistency rises when perceived value outweighs headline price.
Employer groups and schemes
Employer groups purchase at scale and insist on tailored benefits with measurable wellness ROI, driving packaging of services around utilization and absence reduction. They negotiate discounts, service levels and aggregated data insights to benchmark outcomes. Multi-year (typically 3–5 year) contracts stabilize volumes but concentrate bargaining power. Demonstrated productivity and health outcomes are key levers to defend pricing.

Intermediary influence
Brokers and IFAs steer client choices and regularly extract concessions, with 2024 industry data showing intermediaries account for a dominant share of retail product flows, boosting indirect buyer power. High broker reliance raises negotiation leverage, while adviser training, service excellence and unique propositions build loyalty. Expanding digital self-serve journeys—now managing a growing share of onboarding in 2024—reduce friction and adviser dependency.

Switching costs via ecosystem
Discovery's rewards tiers, points, and integrated Vitality-style benefits raise behavioral switching costs by embedding daily health and financial habits, and bundling health, life, and investments deepens lock-in; in 2024 portability rules and one-click buy-now convenience in some markets reduced friction, producing a moderated buyer power versus pure commodity insurers.
- Rewards tiers raise behavioral costs
- Bundling deepens lock-in
- 2024 portability/checkout ease switching
- Net: buyer power moderated vs commodity insurers
Regulatory and consumer advocacy
Regulatory rules on fairness, disclosures and claims handling strengthen customer rights, restricting pricing flexibility and increasing service obligations while boosting trust; Discovery’s prevention-led model and outcome-focused offerings reduce churn and partially cushion margin pressure.
- Stricter disclosures → higher compliance burden
- Claims rules → limited price levers
- Prevention model → lower churn, better outcomes
Market shifts: 62% use online comparators; brokers gain leverage; 3–5 yr employer deals stabilize volume
Retail: 62% of 2024 shoppers used online comparison tools, raising price sensitivity. Employer groups buy at scale with 3–5 year contracts, concentrating leverage. Brokers hold a dominant share of flows, increasing negotiation power, while Vitality bundling and regulation (stricter disclosures/claims) moderate churn and limit pricing flexibility.
| Buyer segment | 2024 metric | Impact |
|---|---|---|
| Retail | 62% online comparators | Price pressure |
| Employers | 3–5 yr contracts | Volume stability |
| Brokers | Dominant share | Negotiation leverage |
Preview the Actual Deliverable
Discovery Porter's Five Forces Analysis
This preview shows the exact Discovery Porter's Five Forces Analysis you'll receive after purchase—fully formatted and ready to use. No placeholders or samples: the document displayed is the final deliverable. You'll get instant access to this identical file once you buy.

From Overview to Strategy Blueprint
Discover how Discovery navigates competitive rivalry, supplier and buyer power, threats from new entrants and substitutes, and industry regulation in this concise Porter's Five Forces snapshot. This overview highlights strategic pressures shaping profitability and growth. Ready for deeper, data-driven insights? Unlock the full Porter's Five Forces Analysis to inform investment and strategy decisions.
Suppliers Bargaining Power
Concentrated reinsurers
Discovery relies on a small panel of highly rated reinsurers to optimize capital and cede catastrophe exposure, giving those reinsurers pricing and term leverage in negotiations.
Diversifying across counterparties reduces single-counterparty exposure, but 2024 capacity cycles and concentration (top 10 reinsurers ~70% market share) can tighten terms and raise ceding costs.
Strong loss experience, robust actuarial data and transparent claims history improve Discovery's bargaining position and can partially offset supplier power.
Healthcare provider networks
Access to hospitals, clinicians and diagnostic networks is critical for product value and claims outcomes; in South Africa private medical schemes cover ~16% (~9.6m people) in 2024 and in the UK the NHS still provides roughly 80% of hospital activity with the private sector supplying much of elective capacity, letting large hospital groups and specialist clusters command favourable tariffs. Long-term contracts and selective networks improve rate control but can restrict member choice, while clinical quality programmes and data-sharing (outcome registries, claims analytics) can rebalance bargaining power by linking payment to performance.
Data, analytics, and tech vendors
Telematics, wearables and cloud platforms drive underwriting precision—usage-based policies cover ~20% of US auto policies in 2024 and telematics programs report 15–25% lower claim frequency. Vendor switching costs and integration complexity raise dependency, while partnerships with device makers and big cloud players (AWS ~32%, Azure ~23% market share in 2024) can compress margins; proprietary analytics reduce supplier leverage over time.
Distribution partners and intermediaries
Brokers, IFAs and bancassurance partners drive Discovery’s new business volumes and product mix, with high-producing intermediaries able to negotiate higher commissions and co-funded marketing support. Discovery’s expanding direct and digital channels reduce but do not eliminate reliance on these intermediaries, keeping supplier bargaining power significant. Performance-linked remuneration and product exclusivity are used to better align incentives and protect margins.
- Channels: brokers/IFAs/bancassurance
- Leverage: high-producer commission demands
- Mitigant: direct/digital distribution
- Alignment: performance pay and exclusivity
Rewards and lifestyle partners
Loyalty, travel, retail and gym partners are core to Vitality rewards; popular brands leverage member demand to negotiate premium visibility and economics, with 2024 industry benchmarks showing top partners capture about 30% of program spend, boosting their leverage.
- Partner concentration: top brands ≈30% of spend (2024)
- Ecosystem breadth: hundreds of partners dilute single-partner power
- Data ROI: analytics enable balanced commercial terms
Concentrated reinsurers, hospitals and cloud vendors amplify supplier power and switching costs
Discovery faces concentrated supplier power from reinsurers (top 10 ≈70% share in 2024) and large hospital groups (SA private schemes ≈16% population, ~9.6m). Tech and cloud vendors (AWS ≈32%, Azure ≈23% in 2024) and telematics/device providers (usage-based ≈20% US auto) raise switching costs. Brokers and top Vitality partners (top brands ≈30% of spend) retain negotiating leverage despite direct channels and proprietary analytics.
| Supplier | 2024 metric |
|---|---|
| Reinsurers | Top10 ≈70% share |
| SA private schemes | 16% pop, ~9.6m |
| Cloud | AWS 32%, Azure 23% |
| Telematics | Usage-based ≈20% US auto |
What is included in the product
Detailed Word Document
Tailored Porter's Five Forces analysis for Discovery that uncovers key competitive drivers, buyer and supplier power, substitutes and entry threats, and identifies disruptive forces and strategic levers to protect market share and inform investor or internal strategy materials.
Customizable Excel Spreadsheet
One-sheet Porter's Five Forces for Discovery that visualizes competitive pressure in a radar chart, lets you tweak force levels with new data, and exports cleanly into decks—so teams can quickly spot threats, test scenarios, and align strategy without complex tools.
Customers Bargaining Power
Price-sensitive retail customers
Price-sensitive retail customers increasingly compare premiums and benefits across digital platforms; in 2024 about 62% of insurance shoppers used online comparison tools, intensifying price pressure on commoditized covers. Discovery counters with Vitality-linked savings and benefits that complicate like-for-like comparisons and support higher perceived value. Persistency rises when perceived value outweighs headline price.
Employer groups and schemes
Employer groups purchase at scale and insist on tailored benefits with measurable wellness ROI, driving packaging of services around utilization and absence reduction. They negotiate discounts, service levels and aggregated data insights to benchmark outcomes. Multi-year (typically 3–5 year) contracts stabilize volumes but concentrate bargaining power. Demonstrated productivity and health outcomes are key levers to defend pricing.
Intermediary influence
Brokers and IFAs steer client choices and regularly extract concessions, with 2024 industry data showing intermediaries account for a dominant share of retail product flows, boosting indirect buyer power. High broker reliance raises negotiation leverage, while adviser training, service excellence and unique propositions build loyalty. Expanding digital self-serve journeys—now managing a growing share of onboarding in 2024—reduce friction and adviser dependency.
Switching costs via ecosystem
Discovery's rewards tiers, points, and integrated Vitality-style benefits raise behavioral switching costs by embedding daily health and financial habits, and bundling health, life, and investments deepens lock-in; in 2024 portability rules and one-click buy-now convenience in some markets reduced friction, producing a moderated buyer power versus pure commodity insurers.
- Rewards tiers raise behavioral costs
- Bundling deepens lock-in
- 2024 portability/checkout ease switching
- Net: buyer power moderated vs commodity insurers
Regulatory and consumer advocacy
Regulatory rules on fairness, disclosures and claims handling strengthen customer rights, restricting pricing flexibility and increasing service obligations while boosting trust; Discovery’s prevention-led model and outcome-focused offerings reduce churn and partially cushion margin pressure.
- Stricter disclosures → higher compliance burden
- Claims rules → limited price levers
- Prevention model → lower churn, better outcomes
Market shifts: 62% use online comparators; brokers gain leverage; 3–5 yr employer deals stabilize volume
Retail: 62% of 2024 shoppers used online comparison tools, raising price sensitivity. Employer groups buy at scale with 3–5 year contracts, concentrating leverage. Brokers hold a dominant share of flows, increasing negotiation power, while Vitality bundling and regulation (stricter disclosures/claims) moderate churn and limit pricing flexibility.
| Buyer segment | 2024 metric | Impact |
|---|---|---|
| Retail | 62% online comparators | Price pressure |
| Employers | 3–5 yr contracts | Volume stability |
| Brokers | Dominant share | Negotiation leverage |
Preview the Actual Deliverable
Discovery Porter's Five Forces Analysis
This preview shows the exact Discovery Porter's Five Forces Analysis you'll receive after purchase—fully formatted and ready to use. No placeholders or samples: the document displayed is the final deliverable. You'll get instant access to this identical file once you buy.
Original: $10.00
-65%$10.00
$3.50Description
From Overview to Strategy Blueprint
Discover how Discovery navigates competitive rivalry, supplier and buyer power, threats from new entrants and substitutes, and industry regulation in this concise Porter's Five Forces snapshot. This overview highlights strategic pressures shaping profitability and growth. Ready for deeper, data-driven insights? Unlock the full Porter's Five Forces Analysis to inform investment and strategy decisions.
Suppliers Bargaining Power
Concentrated reinsurers
Discovery relies on a small panel of highly rated reinsurers to optimize capital and cede catastrophe exposure, giving those reinsurers pricing and term leverage in negotiations.
Diversifying across counterparties reduces single-counterparty exposure, but 2024 capacity cycles and concentration (top 10 reinsurers ~70% market share) can tighten terms and raise ceding costs.
Strong loss experience, robust actuarial data and transparent claims history improve Discovery's bargaining position and can partially offset supplier power.
Healthcare provider networks
Access to hospitals, clinicians and diagnostic networks is critical for product value and claims outcomes; in South Africa private medical schemes cover ~16% (~9.6m people) in 2024 and in the UK the NHS still provides roughly 80% of hospital activity with the private sector supplying much of elective capacity, letting large hospital groups and specialist clusters command favourable tariffs. Long-term contracts and selective networks improve rate control but can restrict member choice, while clinical quality programmes and data-sharing (outcome registries, claims analytics) can rebalance bargaining power by linking payment to performance.
Data, analytics, and tech vendors
Telematics, wearables and cloud platforms drive underwriting precision—usage-based policies cover ~20% of US auto policies in 2024 and telematics programs report 15–25% lower claim frequency. Vendor switching costs and integration complexity raise dependency, while partnerships with device makers and big cloud players (AWS ~32%, Azure ~23% market share in 2024) can compress margins; proprietary analytics reduce supplier leverage over time.
Distribution partners and intermediaries
Brokers, IFAs and bancassurance partners drive Discovery’s new business volumes and product mix, with high-producing intermediaries able to negotiate higher commissions and co-funded marketing support. Discovery’s expanding direct and digital channels reduce but do not eliminate reliance on these intermediaries, keeping supplier bargaining power significant. Performance-linked remuneration and product exclusivity are used to better align incentives and protect margins.
- Channels: brokers/IFAs/bancassurance
- Leverage: high-producer commission demands
- Mitigant: direct/digital distribution
- Alignment: performance pay and exclusivity
Rewards and lifestyle partners
Loyalty, travel, retail and gym partners are core to Vitality rewards; popular brands leverage member demand to negotiate premium visibility and economics, with 2024 industry benchmarks showing top partners capture about 30% of program spend, boosting their leverage.
- Partner concentration: top brands ≈30% of spend (2024)
- Ecosystem breadth: hundreds of partners dilute single-partner power
- Data ROI: analytics enable balanced commercial terms
Concentrated reinsurers, hospitals and cloud vendors amplify supplier power and switching costs
Discovery faces concentrated supplier power from reinsurers (top 10 ≈70% share in 2024) and large hospital groups (SA private schemes ≈16% population, ~9.6m). Tech and cloud vendors (AWS ≈32%, Azure ≈23% in 2024) and telematics/device providers (usage-based ≈20% US auto) raise switching costs. Brokers and top Vitality partners (top brands ≈30% of spend) retain negotiating leverage despite direct channels and proprietary analytics.
| Supplier | 2024 metric |
|---|---|
| Reinsurers | Top10 ≈70% share |
| SA private schemes | 16% pop, ~9.6m |
| Cloud | AWS 32%, Azure 23% |
| Telematics | Usage-based ≈20% US auto |
What is included in the product
Detailed Word Document
Tailored Porter's Five Forces analysis for Discovery that uncovers key competitive drivers, buyer and supplier power, substitutes and entry threats, and identifies disruptive forces and strategic levers to protect market share and inform investor or internal strategy materials.
Customizable Excel Spreadsheet
One-sheet Porter's Five Forces for Discovery that visualizes competitive pressure in a radar chart, lets you tweak force levels with new data, and exports cleanly into decks—so teams can quickly spot threats, test scenarios, and align strategy without complex tools.
Customers Bargaining Power
Price-sensitive retail customers
Price-sensitive retail customers increasingly compare premiums and benefits across digital platforms; in 2024 about 62% of insurance shoppers used online comparison tools, intensifying price pressure on commoditized covers. Discovery counters with Vitality-linked savings and benefits that complicate like-for-like comparisons and support higher perceived value. Persistency rises when perceived value outweighs headline price.
Employer groups and schemes
Employer groups purchase at scale and insist on tailored benefits with measurable wellness ROI, driving packaging of services around utilization and absence reduction. They negotiate discounts, service levels and aggregated data insights to benchmark outcomes. Multi-year (typically 3–5 year) contracts stabilize volumes but concentrate bargaining power. Demonstrated productivity and health outcomes are key levers to defend pricing.
Intermediary influence
Brokers and IFAs steer client choices and regularly extract concessions, with 2024 industry data showing intermediaries account for a dominant share of retail product flows, boosting indirect buyer power. High broker reliance raises negotiation leverage, while adviser training, service excellence and unique propositions build loyalty. Expanding digital self-serve journeys—now managing a growing share of onboarding in 2024—reduce friction and adviser dependency.
Switching costs via ecosystem
Discovery's rewards tiers, points, and integrated Vitality-style benefits raise behavioral switching costs by embedding daily health and financial habits, and bundling health, life, and investments deepens lock-in; in 2024 portability rules and one-click buy-now convenience in some markets reduced friction, producing a moderated buyer power versus pure commodity insurers.
- Rewards tiers raise behavioral costs
- Bundling deepens lock-in
- 2024 portability/checkout ease switching
- Net: buyer power moderated vs commodity insurers
Regulatory and consumer advocacy
Regulatory rules on fairness, disclosures and claims handling strengthen customer rights, restricting pricing flexibility and increasing service obligations while boosting trust; Discovery’s prevention-led model and outcome-focused offerings reduce churn and partially cushion margin pressure.
- Stricter disclosures → higher compliance burden
- Claims rules → limited price levers
- Prevention model → lower churn, better outcomes
Market shifts: 62% use online comparators; brokers gain leverage; 3–5 yr employer deals stabilize volume
Retail: 62% of 2024 shoppers used online comparison tools, raising price sensitivity. Employer groups buy at scale with 3–5 year contracts, concentrating leverage. Brokers hold a dominant share of flows, increasing negotiation power, while Vitality bundling and regulation (stricter disclosures/claims) moderate churn and limit pricing flexibility.
| Buyer segment | 2024 metric | Impact |
|---|---|---|
| Retail | 62% online comparators | Price pressure |
| Employers | 3–5 yr contracts | Volume stability |
| Brokers | Dominant share | Negotiation leverage |
Preview the Actual Deliverable
Discovery Porter's Five Forces Analysis
This preview shows the exact Discovery Porter's Five Forces Analysis you'll receive after purchase—fully formatted and ready to use. No placeholders or samples: the document displayed is the final deliverable. You'll get instant access to this identical file once you buy.











