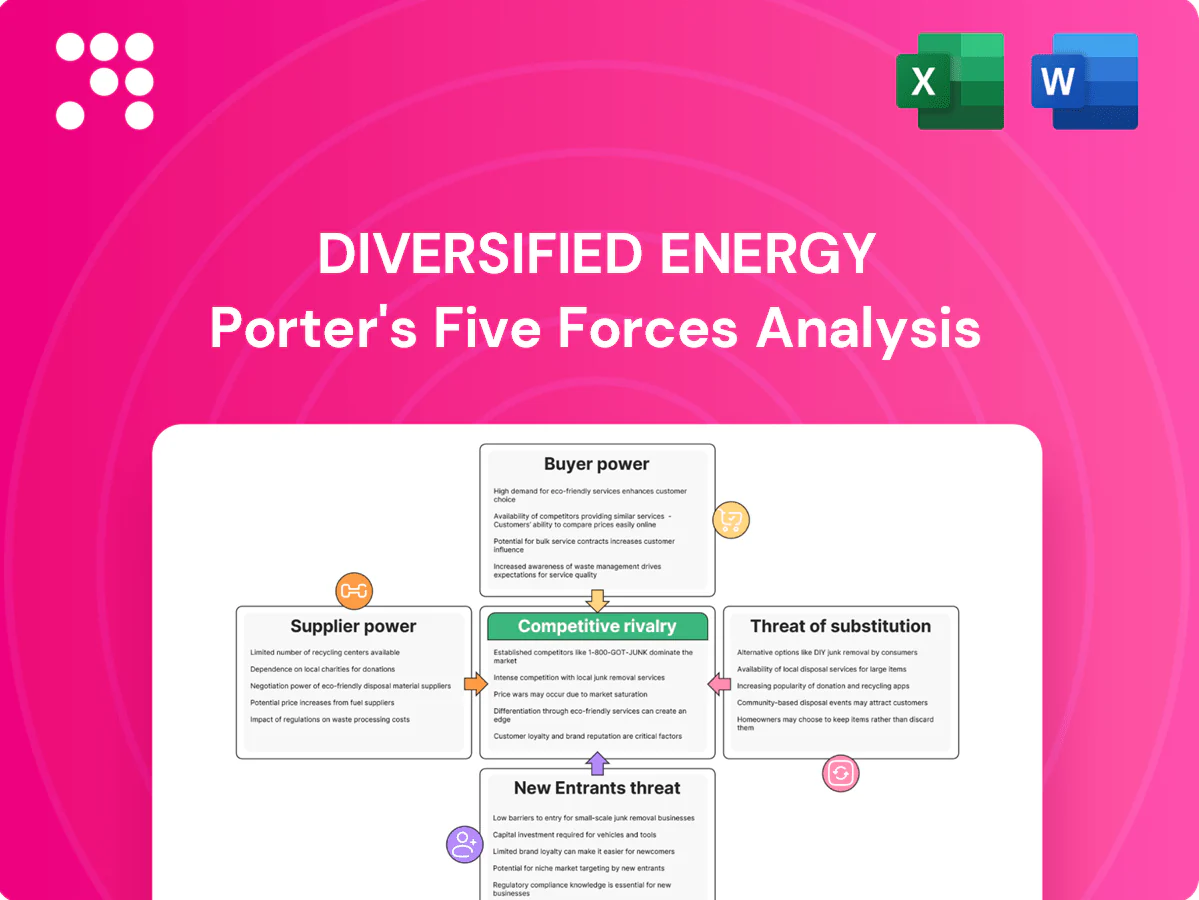
Diversified Energy Porter's Five Forces Analysis

From Overview to Strategy Blueprint
Diversified Energy faces nuanced competitive dynamics—strong buyer scrutiny, concentrated supplier influence, and moderate threat from new entrants and substitutes that shape margins and growth prospects. This snapshot highlights key tensions but omits force-by-force ratings and visuals. Unlock the full Porter’s Five Forces Analysis to access data-driven insights, strategic implications, and ready-to-use slides for investment or planning decisions.
Suppliers Bargaining Power

Concentrated midstream capacity
Access to gathering and pipeline takeaway in Appalachia is concentrated among a few midstream operators—EQT Midstream, Enterprise, Enbridge and TC Energy—allowing them to raise switching costs for producers. Appalachia supplies roughly one-third of US marketed natural gas, so tariff structures and volume commitments can effectively lock terms for large volumes. Limited spare capacity in constrained corridors elevates fees and seasonal differentials. This concentration gives midstream partners moderate-to-high leverage on price and service levels.
Specialized oilfield services
Workovers, compression and well optimization rely on specialized vendors, and Baker Hughes reported roughly 600 US rigs in 2024, concentrating demand near mature assets and narrowing local vendor options. Regional labor/equipment tightness has driven day rates up materially during peak seasons, though diversified vendor rosters and multiyear contracts commonly temper supplier price pressure.

Equipment and parts dependence
Compression units, valves, and artificial lift parts are sourced from fewer than 10 major OEMs, concentrating supplier power; lead times commonly range 8–24 weeks and maintenance windows constrain asset flexibility. Fleet standardization lowers SKU variety and bargaining power, cutting procurement complexity and inventory needs. However, unplanned outages instantly shift leverage to suppliers, driving expedited orders and premium pricing.

Mineral owners and royalty terms
Royalty owners effectively supply access to production through leases; typical US oil and gas royalty rates remain around 12.5% which caps operator margins. Legacy lease terms limit re-negotiation, though new bolt-on acquisitions often require bonus or uplift incentives to secure participation. Aggregated mineral rights reduce counterparty power, while fragmented ownership increases bargaining leverage; strict compliance and timely payments are essential to preserve access.
- royalty rate: ~12.5%
- legacy leases: low renegotiation
- bolt-ons: require incentives
- aggregation: lowers supplier power
- fragmentation: raises supplier power
- compliance: critical to maintain access
Power and emissions services
Electricity for field operations and recurring emissions-monitoring vendors create steady operating costs, and 2024 regulatory timelines have increased demand for specialized monitoring and abatement providers. Evolving methane rules narrow vendor options ahead of compliance deadlines, which can compress supply and raise prices. Larger operators can leverage scale to secure favorable contracts and deploy advanced technologies more cost-effectively.
- Recurring power and vendor costs: steady burden
- 2024 rules: increased reliance on specialized monitors
- Deadlines: compress options, push pricing up
- Scale: better contracts, access to advanced abatement
Appalachia supplies ~33% of US gas; concentrated midstream and long OEM lead times tighten suppliers
Supplier power is moderate-to-high: Appalachia supplies ~33% of US marketed gas and takeaway is concentrated among EQT Midstream, Enterprise, Enbridge and TC Energy, raising switching costs and fees. Baker Hughes reported ~600 US rigs in 2024, tightening vendor options; OEM lead times run 8–24 weeks. Royalty rates ~12.5% cap margins; 2024 methane rules increased demand for specialized monitors.
| Metric | Value |
|---|---|
| Appalachia share | ~33% |
| Major midstream | 4 firms |
| Rigs (2024) | ~600 |
| Royalty rate | ~12.5% |
| OEM lead time | 8–24 wks |
What is included in the product
 Detailed Word Document
Tailored Porter's Five Forces analysis for Diversified Energy that uncovers key drivers of competition, customer and supplier influence, and market entry risks, while identifying disruptive substitutes and emerging threats to market share. Provides strategic commentary on pricing power, profitability pressures, and barriers protecting incumbents.

 Customizable Excel Spreadsheet
A clear one-sheet Porter's Five Forces for Diversified Energy that maps supplier, buyer, competitive, substitute and regulatory pressures—perfect for quick strategic decisions and boardroom use.
Customers Bargaining Power

Utility and power buyers
Regional utilities and power generators buy tens to hundreds of Bcf annually and demand pipeline-quality gas with strict specs, giving them scale-driven leverage; U.S. gas-fired generation accounted for about 40% of electricity in 2024. Their ability to shift between spot (Henry Hub avg ~$3.30/MMBtu in 2024) and contract volumes increases bargaining power, while seasonal winter/summer demand swings concentrate pricing leverage. Long-term offtake contracts (typically 5–15 years) mitigate spot exposure by supplying volume certainty and partially rebalancing supplier power.
Marketers and aggregators
Marketers and aggregators pool supply and arbitrage basis across hubs, squeezing producer netbacks as they capture thin hub spreads; U.S. dry gas averaged about 102 Bcf/d in 2024 while Henry Hub averaged near $3/MMBtu in 2024. They can switch quickly among producers based on price and access to multiple hubs reduces dependency on any single supplier. Creditworthy buyers facilitate volume sales but extract tighter pricing and tougher payment terms.

Industrial end-users
In 2024 industrial end-users—especially petrochemical and manufacturing—prioritize reliability and delivered cost, with the US industrial sector using roughly 30% of national natural gas consumption. Buyers can dual-source across basins or fuels, raising leverage in negotiations. Firm transport and quality specifications become key bargaining points. Producers often trade lower prices for stability via take-or-pay or volume commitments.

LNG and Gulf Coast demand pull
Growing LNG and Gulf Coast demand pulls Appalachian gas via pipeline arbitrage; US LNG export capacity reached about 12.8 Bcf/d in 2024, tightening takeaway and lifting basis volatility. Buyers indexed to global LNG prices can insist discounts at Appalachian origin; producers lacking firm transport often concede margin to access premium export markets, strengthening sophisticated buyers’ bargaining power.
- Basis volatility up → buyers leverage timing
- 12.8 Bcf/d US LNG capacity (2024)
- Limited firm transport → producer margin pressure
- Global-linked buyers secure origin discounts
Spot market exposure
Short-term sales on the spot market face high price transparency and intense competition; spot trades represented roughly one-third of global LNG flows in 2023–24. Buyers exploit real-time spreads and storage dynamics to capture margins. Without hedges or long-term contracts, producers typically accept prevailing spot terms, while diversified marketing reduces single-buyer dependence.
- Spot share ≈ one-third of LNG trade (2023–24)
- Buyers leverage spreads and storage
- Diversified marketing lowers counterparty risk
Regional buyers press pricing as gas at $3.30/MMBtu
Regional buyers and generators (gas ≈40% of US power in 2024) wield scale-driven leverage, switching between spot (Henry Hub ≈$3.30/MMBtu in 2024) and contracts to press pricing. Marketers, aggregators and industrials (US dry gas ≈102 Bcf/d; industrial ≈30% consumption) arbitrage basis and demand firm terms. LNG exports (≈12.8 Bcf/d in 2024) and ~1/3 spot LNG share raise buyer sophistication and discounting pressure.
| Metric | 2024 |
|---|---|
| Henry Hub | $3.30/MMBtu |
| US dry gas | ≈102 Bcf/d |
| US gas share of power | ≈40% |
| US LNG capacity | ≈12.8 Bcf/d |
| Spot LNG share | ≈33% |
Same Document Delivered
Diversified Energy Porter's Five Forces Analysis
This preview shows the exact document you'll receive immediately after purchase—no surprises, no placeholders. The Diversified Energy Porter's Five Forces Analysis evaluates supplier power, buyer power, threat of new entrants, threat of substitutes, and competitive rivalry, with concise conclusions on strategic risks and opportunities. The report is professionally written and fully formatted for immediate use. You’ll get instant access to this same file once you buy.

From Overview to Strategy Blueprint
Diversified Energy faces nuanced competitive dynamics—strong buyer scrutiny, concentrated supplier influence, and moderate threat from new entrants and substitutes that shape margins and growth prospects. This snapshot highlights key tensions but omits force-by-force ratings and visuals. Unlock the full Porter’s Five Forces Analysis to access data-driven insights, strategic implications, and ready-to-use slides for investment or planning decisions.
Suppliers Bargaining Power
Concentrated midstream capacity
Access to gathering and pipeline takeaway in Appalachia is concentrated among a few midstream operators—EQT Midstream, Enterprise, Enbridge and TC Energy—allowing them to raise switching costs for producers. Appalachia supplies roughly one-third of US marketed natural gas, so tariff structures and volume commitments can effectively lock terms for large volumes. Limited spare capacity in constrained corridors elevates fees and seasonal differentials. This concentration gives midstream partners moderate-to-high leverage on price and service levels.
Specialized oilfield services
Workovers, compression and well optimization rely on specialized vendors, and Baker Hughes reported roughly 600 US rigs in 2024, concentrating demand near mature assets and narrowing local vendor options. Regional labor/equipment tightness has driven day rates up materially during peak seasons, though diversified vendor rosters and multiyear contracts commonly temper supplier price pressure.
Equipment and parts dependence
Compression units, valves, and artificial lift parts are sourced from fewer than 10 major OEMs, concentrating supplier power; lead times commonly range 8–24 weeks and maintenance windows constrain asset flexibility. Fleet standardization lowers SKU variety and bargaining power, cutting procurement complexity and inventory needs. However, unplanned outages instantly shift leverage to suppliers, driving expedited orders and premium pricing.
Mineral owners and royalty terms
Royalty owners effectively supply access to production through leases; typical US oil and gas royalty rates remain around 12.5% which caps operator margins. Legacy lease terms limit re-negotiation, though new bolt-on acquisitions often require bonus or uplift incentives to secure participation. Aggregated mineral rights reduce counterparty power, while fragmented ownership increases bargaining leverage; strict compliance and timely payments are essential to preserve access.
- royalty rate: ~12.5%
- legacy leases: low renegotiation
- bolt-ons: require incentives
- aggregation: lowers supplier power
- fragmentation: raises supplier power
- compliance: critical to maintain access
Power and emissions services
Electricity for field operations and recurring emissions-monitoring vendors create steady operating costs, and 2024 regulatory timelines have increased demand for specialized monitoring and abatement providers. Evolving methane rules narrow vendor options ahead of compliance deadlines, which can compress supply and raise prices. Larger operators can leverage scale to secure favorable contracts and deploy advanced technologies more cost-effectively.
- Recurring power and vendor costs: steady burden
- 2024 rules: increased reliance on specialized monitors
- Deadlines: compress options, push pricing up
- Scale: better contracts, access to advanced abatement
Appalachia supplies ~33% of US gas; concentrated midstream and long OEM lead times tighten suppliers
Supplier power is moderate-to-high: Appalachia supplies ~33% of US marketed gas and takeaway is concentrated among EQT Midstream, Enterprise, Enbridge and TC Energy, raising switching costs and fees. Baker Hughes reported ~600 US rigs in 2024, tightening vendor options; OEM lead times run 8–24 weeks. Royalty rates ~12.5% cap margins; 2024 methane rules increased demand for specialized monitors.
| Metric | Value |
|---|---|
| Appalachia share | ~33% |
| Major midstream | 4 firms |
| Rigs (2024) | ~600 |
| Royalty rate | ~12.5% |
| OEM lead time | 8–24 wks |
What is included in the product
Detailed Word Document
Tailored Porter's Five Forces analysis for Diversified Energy that uncovers key drivers of competition, customer and supplier influence, and market entry risks, while identifying disruptive substitutes and emerging threats to market share. Provides strategic commentary on pricing power, profitability pressures, and barriers protecting incumbents.
Customizable Excel Spreadsheet
A clear one-sheet Porter's Five Forces for Diversified Energy that maps supplier, buyer, competitive, substitute and regulatory pressures—perfect for quick strategic decisions and boardroom use.
Customers Bargaining Power
Utility and power buyers
Regional utilities and power generators buy tens to hundreds of Bcf annually and demand pipeline-quality gas with strict specs, giving them scale-driven leverage; U.S. gas-fired generation accounted for about 40% of electricity in 2024. Their ability to shift between spot (Henry Hub avg ~$3.30/MMBtu in 2024) and contract volumes increases bargaining power, while seasonal winter/summer demand swings concentrate pricing leverage. Long-term offtake contracts (typically 5–15 years) mitigate spot exposure by supplying volume certainty and partially rebalancing supplier power.
Marketers and aggregators
Marketers and aggregators pool supply and arbitrage basis across hubs, squeezing producer netbacks as they capture thin hub spreads; U.S. dry gas averaged about 102 Bcf/d in 2024 while Henry Hub averaged near $3/MMBtu in 2024. They can switch quickly among producers based on price and access to multiple hubs reduces dependency on any single supplier. Creditworthy buyers facilitate volume sales but extract tighter pricing and tougher payment terms.
Industrial end-users
In 2024 industrial end-users—especially petrochemical and manufacturing—prioritize reliability and delivered cost, with the US industrial sector using roughly 30% of national natural gas consumption. Buyers can dual-source across basins or fuels, raising leverage in negotiations. Firm transport and quality specifications become key bargaining points. Producers often trade lower prices for stability via take-or-pay or volume commitments.
LNG and Gulf Coast demand pull
Growing LNG and Gulf Coast demand pulls Appalachian gas via pipeline arbitrage; US LNG export capacity reached about 12.8 Bcf/d in 2024, tightening takeaway and lifting basis volatility. Buyers indexed to global LNG prices can insist discounts at Appalachian origin; producers lacking firm transport often concede margin to access premium export markets, strengthening sophisticated buyers’ bargaining power.
- Basis volatility up → buyers leverage timing
- 12.8 Bcf/d US LNG capacity (2024)
- Limited firm transport → producer margin pressure
- Global-linked buyers secure origin discounts
Spot market exposure
Short-term sales on the spot market face high price transparency and intense competition; spot trades represented roughly one-third of global LNG flows in 2023–24. Buyers exploit real-time spreads and storage dynamics to capture margins. Without hedges or long-term contracts, producers typically accept prevailing spot terms, while diversified marketing reduces single-buyer dependence.
- Spot share ≈ one-third of LNG trade (2023–24)
- Buyers leverage spreads and storage
- Diversified marketing lowers counterparty risk
Regional buyers press pricing as gas at $3.30/MMBtu
Regional buyers and generators (gas ≈40% of US power in 2024) wield scale-driven leverage, switching between spot (Henry Hub ≈$3.30/MMBtu in 2024) and contracts to press pricing. Marketers, aggregators and industrials (US dry gas ≈102 Bcf/d; industrial ≈30% consumption) arbitrage basis and demand firm terms. LNG exports (≈12.8 Bcf/d in 2024) and ~1/3 spot LNG share raise buyer sophistication and discounting pressure.
| Metric | 2024 |
|---|---|
| Henry Hub | $3.30/MMBtu |
| US dry gas | ≈102 Bcf/d |
| US gas share of power | ≈40% |
| US LNG capacity | ≈12.8 Bcf/d |
| Spot LNG share | ≈33% |
Same Document Delivered
Diversified Energy Porter's Five Forces Analysis
This preview shows the exact document you'll receive immediately after purchase—no surprises, no placeholders. The Diversified Energy Porter's Five Forces Analysis evaluates supplier power, buyer power, threat of new entrants, threat of substitutes, and competitive rivalry, with concise conclusions on strategic risks and opportunities. The report is professionally written and fully formatted for immediate use. You’ll get instant access to this same file once you buy.
Original: $10.00
-65%$10.00
$3.50Description
From Overview to Strategy Blueprint
Diversified Energy faces nuanced competitive dynamics—strong buyer scrutiny, concentrated supplier influence, and moderate threat from new entrants and substitutes that shape margins and growth prospects. This snapshot highlights key tensions but omits force-by-force ratings and visuals. Unlock the full Porter’s Five Forces Analysis to access data-driven insights, strategic implications, and ready-to-use slides for investment or planning decisions.
Suppliers Bargaining Power
Concentrated midstream capacity
Access to gathering and pipeline takeaway in Appalachia is concentrated among a few midstream operators—EQT Midstream, Enterprise, Enbridge and TC Energy—allowing them to raise switching costs for producers. Appalachia supplies roughly one-third of US marketed natural gas, so tariff structures and volume commitments can effectively lock terms for large volumes. Limited spare capacity in constrained corridors elevates fees and seasonal differentials. This concentration gives midstream partners moderate-to-high leverage on price and service levels.
Specialized oilfield services
Workovers, compression and well optimization rely on specialized vendors, and Baker Hughes reported roughly 600 US rigs in 2024, concentrating demand near mature assets and narrowing local vendor options. Regional labor/equipment tightness has driven day rates up materially during peak seasons, though diversified vendor rosters and multiyear contracts commonly temper supplier price pressure.
Equipment and parts dependence
Compression units, valves, and artificial lift parts are sourced from fewer than 10 major OEMs, concentrating supplier power; lead times commonly range 8–24 weeks and maintenance windows constrain asset flexibility. Fleet standardization lowers SKU variety and bargaining power, cutting procurement complexity and inventory needs. However, unplanned outages instantly shift leverage to suppliers, driving expedited orders and premium pricing.
Mineral owners and royalty terms
Royalty owners effectively supply access to production through leases; typical US oil and gas royalty rates remain around 12.5% which caps operator margins. Legacy lease terms limit re-negotiation, though new bolt-on acquisitions often require bonus or uplift incentives to secure participation. Aggregated mineral rights reduce counterparty power, while fragmented ownership increases bargaining leverage; strict compliance and timely payments are essential to preserve access.
- royalty rate: ~12.5%
- legacy leases: low renegotiation
- bolt-ons: require incentives
- aggregation: lowers supplier power
- fragmentation: raises supplier power
- compliance: critical to maintain access
Power and emissions services
Electricity for field operations and recurring emissions-monitoring vendors create steady operating costs, and 2024 regulatory timelines have increased demand for specialized monitoring and abatement providers. Evolving methane rules narrow vendor options ahead of compliance deadlines, which can compress supply and raise prices. Larger operators can leverage scale to secure favorable contracts and deploy advanced technologies more cost-effectively.
- Recurring power and vendor costs: steady burden
- 2024 rules: increased reliance on specialized monitors
- Deadlines: compress options, push pricing up
- Scale: better contracts, access to advanced abatement
Appalachia supplies ~33% of US gas; concentrated midstream and long OEM lead times tighten suppliers
Supplier power is moderate-to-high: Appalachia supplies ~33% of US marketed gas and takeaway is concentrated among EQT Midstream, Enterprise, Enbridge and TC Energy, raising switching costs and fees. Baker Hughes reported ~600 US rigs in 2024, tightening vendor options; OEM lead times run 8–24 weeks. Royalty rates ~12.5% cap margins; 2024 methane rules increased demand for specialized monitors.
| Metric | Value |
|---|---|
| Appalachia share | ~33% |
| Major midstream | 4 firms |
| Rigs (2024) | ~600 |
| Royalty rate | ~12.5% |
| OEM lead time | 8–24 wks |
What is included in the product
Detailed Word Document
Tailored Porter's Five Forces analysis for Diversified Energy that uncovers key drivers of competition, customer and supplier influence, and market entry risks, while identifying disruptive substitutes and emerging threats to market share. Provides strategic commentary on pricing power, profitability pressures, and barriers protecting incumbents.
Customizable Excel Spreadsheet
A clear one-sheet Porter's Five Forces for Diversified Energy that maps supplier, buyer, competitive, substitute and regulatory pressures—perfect for quick strategic decisions and boardroom use.
Customers Bargaining Power
Utility and power buyers
Regional utilities and power generators buy tens to hundreds of Bcf annually and demand pipeline-quality gas with strict specs, giving them scale-driven leverage; U.S. gas-fired generation accounted for about 40% of electricity in 2024. Their ability to shift between spot (Henry Hub avg ~$3.30/MMBtu in 2024) and contract volumes increases bargaining power, while seasonal winter/summer demand swings concentrate pricing leverage. Long-term offtake contracts (typically 5–15 years) mitigate spot exposure by supplying volume certainty and partially rebalancing supplier power.
Marketers and aggregators
Marketers and aggregators pool supply and arbitrage basis across hubs, squeezing producer netbacks as they capture thin hub spreads; U.S. dry gas averaged about 102 Bcf/d in 2024 while Henry Hub averaged near $3/MMBtu in 2024. They can switch quickly among producers based on price and access to multiple hubs reduces dependency on any single supplier. Creditworthy buyers facilitate volume sales but extract tighter pricing and tougher payment terms.
Industrial end-users
In 2024 industrial end-users—especially petrochemical and manufacturing—prioritize reliability and delivered cost, with the US industrial sector using roughly 30% of national natural gas consumption. Buyers can dual-source across basins or fuels, raising leverage in negotiations. Firm transport and quality specifications become key bargaining points. Producers often trade lower prices for stability via take-or-pay or volume commitments.
LNG and Gulf Coast demand pull
Growing LNG and Gulf Coast demand pulls Appalachian gas via pipeline arbitrage; US LNG export capacity reached about 12.8 Bcf/d in 2024, tightening takeaway and lifting basis volatility. Buyers indexed to global LNG prices can insist discounts at Appalachian origin; producers lacking firm transport often concede margin to access premium export markets, strengthening sophisticated buyers’ bargaining power.
- Basis volatility up → buyers leverage timing
- 12.8 Bcf/d US LNG capacity (2024)
- Limited firm transport → producer margin pressure
- Global-linked buyers secure origin discounts
Spot market exposure
Short-term sales on the spot market face high price transparency and intense competition; spot trades represented roughly one-third of global LNG flows in 2023–24. Buyers exploit real-time spreads and storage dynamics to capture margins. Without hedges or long-term contracts, producers typically accept prevailing spot terms, while diversified marketing reduces single-buyer dependence.
- Spot share ≈ one-third of LNG trade (2023–24)
- Buyers leverage spreads and storage
- Diversified marketing lowers counterparty risk
Regional buyers press pricing as gas at $3.30/MMBtu
Regional buyers and generators (gas ≈40% of US power in 2024) wield scale-driven leverage, switching between spot (Henry Hub ≈$3.30/MMBtu in 2024) and contracts to press pricing. Marketers, aggregators and industrials (US dry gas ≈102 Bcf/d; industrial ≈30% consumption) arbitrage basis and demand firm terms. LNG exports (≈12.8 Bcf/d in 2024) and ~1/3 spot LNG share raise buyer sophistication and discounting pressure.
| Metric | 2024 |
|---|---|
| Henry Hub | $3.30/MMBtu |
| US dry gas | ≈102 Bcf/d |
| US gas share of power | ≈40% |
| US LNG capacity | ≈12.8 Bcf/d |
| Spot LNG share | ≈33% |
Same Document Delivered
Diversified Energy Porter's Five Forces Analysis
This preview shows the exact document you'll receive immediately after purchase—no surprises, no placeholders. The Diversified Energy Porter's Five Forces Analysis evaluates supplier power, buyer power, threat of new entrants, threat of substitutes, and competitive rivalry, with concise conclusions on strategic risks and opportunities. The report is professionally written and fully formatted for immediate use. You’ll get instant access to this same file once you buy.











