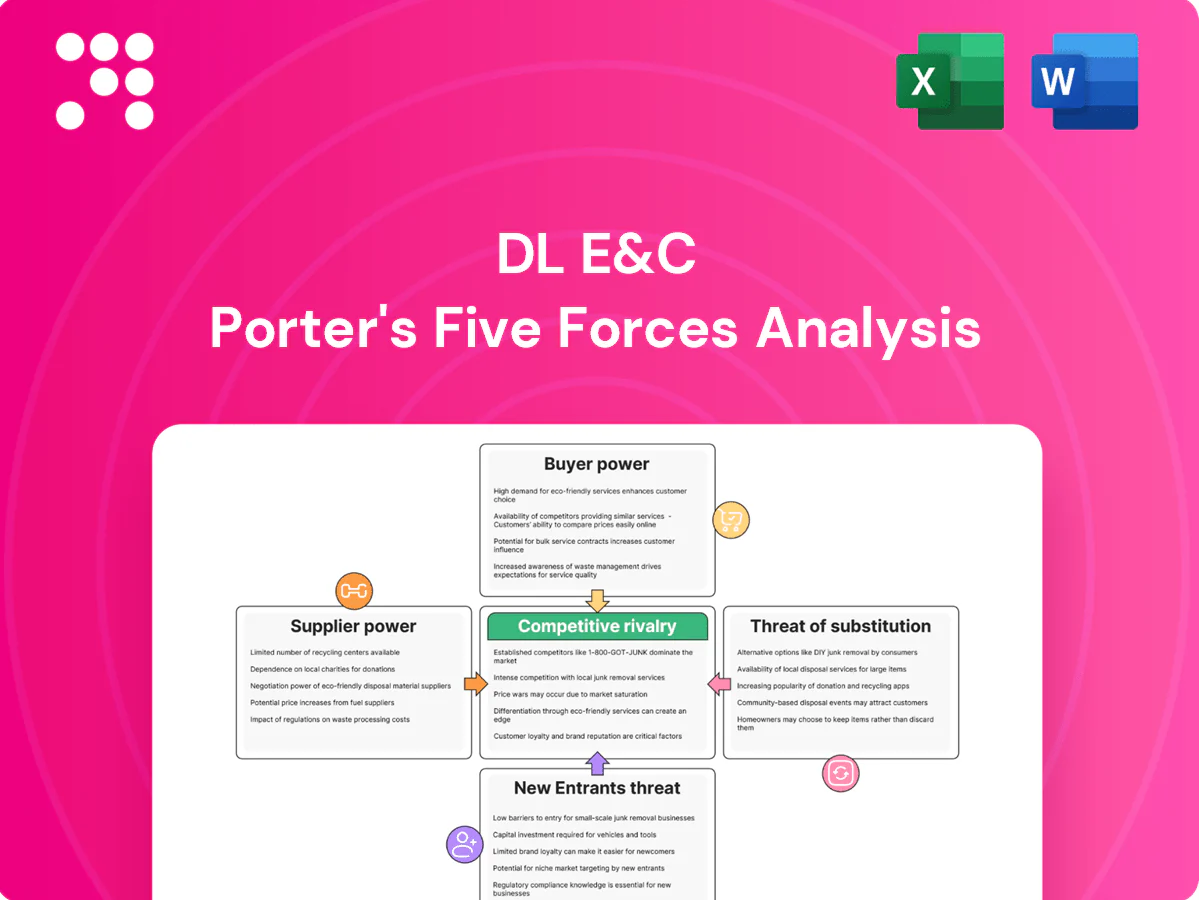
DL E&C Porter's Five Forces Analysis

From Overview to Strategy Blueprint
DL E&C faces intense rivalry, variable supplier power, rising buyer expectations, moderate entry barriers, and selective substitute threats shaping its margins and growth prospects. This snapshot highlights key pressures but omits force-by-force ratings and scenario analysis. Unlock the full Porter's Five Forces report for detailed ratings, visuals, and strategic implications. Get the consultant-grade Excel and Word deliverables to act decisively.
Suppliers Bargaining Power

Critical materials concentration
Steel, cement and petrochemical equipment suppliers are highly concentrated and globally coordinated, with China producing about 56% of global crude steel in 2024, amplifying market power. Price swings and allocation limits can squeeze EPC margins on fixed-price contracts, and DL E&C relies on long-term supply agreements and financial hedges to manage cost volatility. Substitution options are limited; geographic diversification of sourcing reduces but does not eliminate exposure.
Specialized OEM dependence
Large compressors, turbines and reactors are concentrated among OEMs such as Siemens Energy, GE Vernova and Mitsubishi Heavy, with engineering lead times commonly of 12–24 months and strong IP protection. High switching costs arise from integrated design and warranty constraints, letting suppliers influence delivery schedules and specs. Framework agreements and multi-vendor qualification lower risk but do not eliminate supplier leverage.

Skilled subcontractor scarcity
Complex civil and plant works require scarce high-skill subcontractors and craft labor, and tight local markets pushed subcontractor rates up about 10% in 2024, increasing schedule risk. DL E&C’s prequalified pools and training programs now cover roughly 65% of skilled demand, moderating price exposure. Cross-border mobilization still adds 2–4 week logistical and compliance frictions, raising mobilization costs.

Logistics and site access risks
Heavy-lift logistics, ports, and last-mile access can gate project critical paths; in 2024 persistent port congestion and carrier capacity tightness amplified supplier leverage and risk to schedules. Freight carriers and site service providers gain bargaining power under disruption, raising spot premiums; DL E&C uses early logistics engineering and multiple-route hedges to mitigate delay exposure. Force majeure clauses only partially protect against cost overruns and schedule slippage.
- 2024: sustained port congestion increased supplier leverage
- Early logistics engineering reduces critical-path risk
- Multiple routes hedge carrier concentration
- Force majeure limits do not fully cover cost overruns
Digital tools and data lock-in
BIM/CAD, project controls and IIoT platforms create strong data lock-in through proprietary formats and workflows, with BIM adoption surpassing 60% in construction by 2024, increasing suppliers' leverage. License and support terms can add 10–20% to lifecycle costs and constrain agility. Standardized open formats (IFC) reduce dependency but remain imperfect; co-developing trades flexibility for operational reliability.
- Vendor lock-in: proprietary data formats
- Costs: license/support 10–20% lifecycle uplift
- Mitigants: IFC/open standards; co-development trade-offs
Supply squeeze: China steel 56%, OEM 12-24 months, subs +10%
Suppliers exert high leverage: steel concentration (China ~56% of crude steel, 2024) and OEMs (12–24 month lead times) drive price and schedule risk. Subcontractor rates rose ~10% in 2024; DL E&C prequalification covers ~65% of skilled demand. BIM adoption >60% (2024) and license/support add 10–20% lifecycle cost, limiting substitution.
| Metric | 2024 Value |
|---|---|
| China crude steel share | 56% |
| OEM lead times | 12–24 months |
| Subcontractor rate increase | ~10% |
| Prequalified skilled coverage | 65% |
| BIM adoption | >60% |
| License/support uplift | 10–20% |
What is included in the product
 Detailed Word Document
Uncovers key drivers of competition, customer influence, and market entry risks tailored to DL E&C; evaluates supplier and buyer power, threat of substitutes and new entrants, and rivalry intensity with strategic implications and editable output for investor and internal reports.

 Customizable Excel Spreadsheet
DL E&C Porter's Five Forces offers a one-sheet, customizable snapshot that instantly relieves decision-making pain by highlighting competitive pressures and strategic risks. Swap in new data, generate a spider chart for quick boardroom visuals, and drop the clean layout straight into pitch decks—no macros or finance jargon required.
Customers Bargaining Power

Government and SOE dominance
In 2024 public owners and SOEs continued to award mega-projects (>US$1bn) under strict procurement rules, concentrating buying power in a few large clients. Their scale and access to alternatives heighten price pressure and contractual stringency, pushing risk onto contractors. Payment terms and liquidated damages commonly shift cashflow and performance risk to EPCs, so DL E&C competes by showcasing a strong delivery track record and compliance credentials.
Competitive tendering intensity
Most DL E&C projects in 2024 are awarded through transparent, bid-based procurement, enabling buyers to pit multiple qualified EPCs on price and terms. Even best-value or design-build awards preserve buyer leverage through strict evaluation criteria. Pre-bid engineering costs frequently become sunk for contractors, compressing margins and raising tendering discipline.

LSTK and risk transfer
Lump-sum turnkey (LSTK) contracts shift cost, schedule and performance risks to contractors, forcing DL E&C to absorb claims that compress EPC margins and raise working capital needs; performance bonds and guarantees commonly run around 10% of contract value. Buyers insist on warranties and liquidated damages, squeezing margins and cash flow. DL E&C responds with selective bidding and rigorous risk pricing to protect returns.

Global sourcing options
In 2024 buyers increasingly source internationally, expanding vendor slates; currency arbitrage, supplier financing and enhanced export credit support in 2024 sharpen buyer bargaining power. DL E&C must match commercial terms as well as technical capability. Local content rules can partially rebalance dynamics.
- Global sourcing expands vendor choice
- Export credit and financing boost buyer leverage
- Commercial terms as critical as technical fit
- Local content rules limit but do not eliminate pressure
Lifecycle service expectations
Clients increasingly demand EPC plus O&M and digital performance monitoring; 2024 digital transformation spending hit an estimated 2.8 trillion USD, raising expectations for lifecycle services. Bundled outcome contracts boost customer switching power when contractors lack end-to-end offerings. DL E&C’s core EPC competence mitigates risk, but limited aftermarket footprint weakens negotiating leverage; strategic partnerships fill coverage gaps.
- Lifecycle demand: EPC+O&M+digital
- Switching power rises with bundled outcomes
- DL E&C strong in EPC; aftermarket presence critical
- Partnerships used to cover service gaps
Buyers leverage >US$1bn EPC awards, LSTK and ~10% bonds compress EPC margins
In 2024 buyers concentrated mega-project awards (>US$1bn), enforcing LSTK terms that shift risk and ~10% performance guarantees to contractors, squeezing EPC margins. Transparent bidding and global sourcing plus $2.8tr digital spend increased buyer leverage; bundled EPC+O&M raises switching power. DL E&C counters with selective bidding, risk pricing and partnerships.
| Metric | 2024 |
|---|---|
| Mega-project threshold | >US$1bn |
| Performance bonds | ~10% of contract |
| Digital transformation spend | US$2.8tr |
Preview the Actual Deliverable
DL E&C Porter's Five Forces Analysis
This preview is the exact DL E&C Porter's Five Forces Analysis you'll receive after purchase—fully written, formatted, and ready to download. It contains the complete competitive assessment, including supplier power, buyer power, competitive rivalry, threat of substitution, and barriers to entry. No placeholders, no samples—what you see here is the deliverable available instantly after payment.

From Overview to Strategy Blueprint
DL E&C faces intense rivalry, variable supplier power, rising buyer expectations, moderate entry barriers, and selective substitute threats shaping its margins and growth prospects. This snapshot highlights key pressures but omits force-by-force ratings and scenario analysis. Unlock the full Porter's Five Forces report for detailed ratings, visuals, and strategic implications. Get the consultant-grade Excel and Word deliverables to act decisively.
Suppliers Bargaining Power
Critical materials concentration
Steel, cement and petrochemical equipment suppliers are highly concentrated and globally coordinated, with China producing about 56% of global crude steel in 2024, amplifying market power. Price swings and allocation limits can squeeze EPC margins on fixed-price contracts, and DL E&C relies on long-term supply agreements and financial hedges to manage cost volatility. Substitution options are limited; geographic diversification of sourcing reduces but does not eliminate exposure.
Specialized OEM dependence
Large compressors, turbines and reactors are concentrated among OEMs such as Siemens Energy, GE Vernova and Mitsubishi Heavy, with engineering lead times commonly of 12–24 months and strong IP protection. High switching costs arise from integrated design and warranty constraints, letting suppliers influence delivery schedules and specs. Framework agreements and multi-vendor qualification lower risk but do not eliminate supplier leverage.
Skilled subcontractor scarcity
Complex civil and plant works require scarce high-skill subcontractors and craft labor, and tight local markets pushed subcontractor rates up about 10% in 2024, increasing schedule risk. DL E&C’s prequalified pools and training programs now cover roughly 65% of skilled demand, moderating price exposure. Cross-border mobilization still adds 2–4 week logistical and compliance frictions, raising mobilization costs.
Logistics and site access risks
Heavy-lift logistics, ports, and last-mile access can gate project critical paths; in 2024 persistent port congestion and carrier capacity tightness amplified supplier leverage and risk to schedules. Freight carriers and site service providers gain bargaining power under disruption, raising spot premiums; DL E&C uses early logistics engineering and multiple-route hedges to mitigate delay exposure. Force majeure clauses only partially protect against cost overruns and schedule slippage.
- 2024: sustained port congestion increased supplier leverage
- Early logistics engineering reduces critical-path risk
- Multiple routes hedge carrier concentration
- Force majeure limits do not fully cover cost overruns
Digital tools and data lock-in
BIM/CAD, project controls and IIoT platforms create strong data lock-in through proprietary formats and workflows, with BIM adoption surpassing 60% in construction by 2024, increasing suppliers' leverage. License and support terms can add 10–20% to lifecycle costs and constrain agility. Standardized open formats (IFC) reduce dependency but remain imperfect; co-developing trades flexibility for operational reliability.
- Vendor lock-in: proprietary data formats
- Costs: license/support 10–20% lifecycle uplift
- Mitigants: IFC/open standards; co-development trade-offs
Supply squeeze: China steel 56%, OEM 12-24 months, subs +10%
Suppliers exert high leverage: steel concentration (China ~56% of crude steel, 2024) and OEMs (12–24 month lead times) drive price and schedule risk. Subcontractor rates rose ~10% in 2024; DL E&C prequalification covers ~65% of skilled demand. BIM adoption >60% (2024) and license/support add 10–20% lifecycle cost, limiting substitution.
| Metric | 2024 Value |
|---|---|
| China crude steel share | 56% |
| OEM lead times | 12–24 months |
| Subcontractor rate increase | ~10% |
| Prequalified skilled coverage | 65% |
| BIM adoption | >60% |
| License/support uplift | 10–20% |
What is included in the product
Detailed Word Document
Uncovers key drivers of competition, customer influence, and market entry risks tailored to DL E&C; evaluates supplier and buyer power, threat of substitutes and new entrants, and rivalry intensity with strategic implications and editable output for investor and internal reports.
Customizable Excel Spreadsheet
DL E&C Porter's Five Forces offers a one-sheet, customizable snapshot that instantly relieves decision-making pain by highlighting competitive pressures and strategic risks. Swap in new data, generate a spider chart for quick boardroom visuals, and drop the clean layout straight into pitch decks—no macros or finance jargon required.
Customers Bargaining Power
Government and SOE dominance
In 2024 public owners and SOEs continued to award mega-projects (>US$1bn) under strict procurement rules, concentrating buying power in a few large clients. Their scale and access to alternatives heighten price pressure and contractual stringency, pushing risk onto contractors. Payment terms and liquidated damages commonly shift cashflow and performance risk to EPCs, so DL E&C competes by showcasing a strong delivery track record and compliance credentials.
Competitive tendering intensity
Most DL E&C projects in 2024 are awarded through transparent, bid-based procurement, enabling buyers to pit multiple qualified EPCs on price and terms. Even best-value or design-build awards preserve buyer leverage through strict evaluation criteria. Pre-bid engineering costs frequently become sunk for contractors, compressing margins and raising tendering discipline.
LSTK and risk transfer
Lump-sum turnkey (LSTK) contracts shift cost, schedule and performance risks to contractors, forcing DL E&C to absorb claims that compress EPC margins and raise working capital needs; performance bonds and guarantees commonly run around 10% of contract value. Buyers insist on warranties and liquidated damages, squeezing margins and cash flow. DL E&C responds with selective bidding and rigorous risk pricing to protect returns.
Global sourcing options
In 2024 buyers increasingly source internationally, expanding vendor slates; currency arbitrage, supplier financing and enhanced export credit support in 2024 sharpen buyer bargaining power. DL E&C must match commercial terms as well as technical capability. Local content rules can partially rebalance dynamics.
- Global sourcing expands vendor choice
- Export credit and financing boost buyer leverage
- Commercial terms as critical as technical fit
- Local content rules limit but do not eliminate pressure
Lifecycle service expectations
Clients increasingly demand EPC plus O&M and digital performance monitoring; 2024 digital transformation spending hit an estimated 2.8 trillion USD, raising expectations for lifecycle services. Bundled outcome contracts boost customer switching power when contractors lack end-to-end offerings. DL E&C’s core EPC competence mitigates risk, but limited aftermarket footprint weakens negotiating leverage; strategic partnerships fill coverage gaps.
- Lifecycle demand: EPC+O&M+digital
- Switching power rises with bundled outcomes
- DL E&C strong in EPC; aftermarket presence critical
- Partnerships used to cover service gaps
Buyers leverage >US$1bn EPC awards, LSTK and ~10% bonds compress EPC margins
In 2024 buyers concentrated mega-project awards (>US$1bn), enforcing LSTK terms that shift risk and ~10% performance guarantees to contractors, squeezing EPC margins. Transparent bidding and global sourcing plus $2.8tr digital spend increased buyer leverage; bundled EPC+O&M raises switching power. DL E&C counters with selective bidding, risk pricing and partnerships.
| Metric | 2024 |
|---|---|
| Mega-project threshold | >US$1bn |
| Performance bonds | ~10% of contract |
| Digital transformation spend | US$2.8tr |
Preview the Actual Deliverable
DL E&C Porter's Five Forces Analysis
This preview is the exact DL E&C Porter's Five Forces Analysis you'll receive after purchase—fully written, formatted, and ready to download. It contains the complete competitive assessment, including supplier power, buyer power, competitive rivalry, threat of substitution, and barriers to entry. No placeholders, no samples—what you see here is the deliverable available instantly after payment.
Original: $10.00
-65%$10.00
$3.50Description
From Overview to Strategy Blueprint
DL E&C faces intense rivalry, variable supplier power, rising buyer expectations, moderate entry barriers, and selective substitute threats shaping its margins and growth prospects. This snapshot highlights key pressures but omits force-by-force ratings and scenario analysis. Unlock the full Porter's Five Forces report for detailed ratings, visuals, and strategic implications. Get the consultant-grade Excel and Word deliverables to act decisively.
Suppliers Bargaining Power
Critical materials concentration
Steel, cement and petrochemical equipment suppliers are highly concentrated and globally coordinated, with China producing about 56% of global crude steel in 2024, amplifying market power. Price swings and allocation limits can squeeze EPC margins on fixed-price contracts, and DL E&C relies on long-term supply agreements and financial hedges to manage cost volatility. Substitution options are limited; geographic diversification of sourcing reduces but does not eliminate exposure.
Specialized OEM dependence
Large compressors, turbines and reactors are concentrated among OEMs such as Siemens Energy, GE Vernova and Mitsubishi Heavy, with engineering lead times commonly of 12–24 months and strong IP protection. High switching costs arise from integrated design and warranty constraints, letting suppliers influence delivery schedules and specs. Framework agreements and multi-vendor qualification lower risk but do not eliminate supplier leverage.
Skilled subcontractor scarcity
Complex civil and plant works require scarce high-skill subcontractors and craft labor, and tight local markets pushed subcontractor rates up about 10% in 2024, increasing schedule risk. DL E&C’s prequalified pools and training programs now cover roughly 65% of skilled demand, moderating price exposure. Cross-border mobilization still adds 2–4 week logistical and compliance frictions, raising mobilization costs.
Logistics and site access risks
Heavy-lift logistics, ports, and last-mile access can gate project critical paths; in 2024 persistent port congestion and carrier capacity tightness amplified supplier leverage and risk to schedules. Freight carriers and site service providers gain bargaining power under disruption, raising spot premiums; DL E&C uses early logistics engineering and multiple-route hedges to mitigate delay exposure. Force majeure clauses only partially protect against cost overruns and schedule slippage.
- 2024: sustained port congestion increased supplier leverage
- Early logistics engineering reduces critical-path risk
- Multiple routes hedge carrier concentration
- Force majeure limits do not fully cover cost overruns
Digital tools and data lock-in
BIM/CAD, project controls and IIoT platforms create strong data lock-in through proprietary formats and workflows, with BIM adoption surpassing 60% in construction by 2024, increasing suppliers' leverage. License and support terms can add 10–20% to lifecycle costs and constrain agility. Standardized open formats (IFC) reduce dependency but remain imperfect; co-developing trades flexibility for operational reliability.
- Vendor lock-in: proprietary data formats
- Costs: license/support 10–20% lifecycle uplift
- Mitigants: IFC/open standards; co-development trade-offs
Supply squeeze: China steel 56%, OEM 12-24 months, subs +10%
Suppliers exert high leverage: steel concentration (China ~56% of crude steel, 2024) and OEMs (12–24 month lead times) drive price and schedule risk. Subcontractor rates rose ~10% in 2024; DL E&C prequalification covers ~65% of skilled demand. BIM adoption >60% (2024) and license/support add 10–20% lifecycle cost, limiting substitution.
| Metric | 2024 Value |
|---|---|
| China crude steel share | 56% |
| OEM lead times | 12–24 months |
| Subcontractor rate increase | ~10% |
| Prequalified skilled coverage | 65% |
| BIM adoption | >60% |
| License/support uplift | 10–20% |
What is included in the product
Detailed Word Document
Uncovers key drivers of competition, customer influence, and market entry risks tailored to DL E&C; evaluates supplier and buyer power, threat of substitutes and new entrants, and rivalry intensity with strategic implications and editable output for investor and internal reports.
Customizable Excel Spreadsheet
DL E&C Porter's Five Forces offers a one-sheet, customizable snapshot that instantly relieves decision-making pain by highlighting competitive pressures and strategic risks. Swap in new data, generate a spider chart for quick boardroom visuals, and drop the clean layout straight into pitch decks—no macros or finance jargon required.
Customers Bargaining Power
Government and SOE dominance
In 2024 public owners and SOEs continued to award mega-projects (>US$1bn) under strict procurement rules, concentrating buying power in a few large clients. Their scale and access to alternatives heighten price pressure and contractual stringency, pushing risk onto contractors. Payment terms and liquidated damages commonly shift cashflow and performance risk to EPCs, so DL E&C competes by showcasing a strong delivery track record and compliance credentials.
Competitive tendering intensity
Most DL E&C projects in 2024 are awarded through transparent, bid-based procurement, enabling buyers to pit multiple qualified EPCs on price and terms. Even best-value or design-build awards preserve buyer leverage through strict evaluation criteria. Pre-bid engineering costs frequently become sunk for contractors, compressing margins and raising tendering discipline.
LSTK and risk transfer
Lump-sum turnkey (LSTK) contracts shift cost, schedule and performance risks to contractors, forcing DL E&C to absorb claims that compress EPC margins and raise working capital needs; performance bonds and guarantees commonly run around 10% of contract value. Buyers insist on warranties and liquidated damages, squeezing margins and cash flow. DL E&C responds with selective bidding and rigorous risk pricing to protect returns.
Global sourcing options
In 2024 buyers increasingly source internationally, expanding vendor slates; currency arbitrage, supplier financing and enhanced export credit support in 2024 sharpen buyer bargaining power. DL E&C must match commercial terms as well as technical capability. Local content rules can partially rebalance dynamics.
- Global sourcing expands vendor choice
- Export credit and financing boost buyer leverage
- Commercial terms as critical as technical fit
- Local content rules limit but do not eliminate pressure
Lifecycle service expectations
Clients increasingly demand EPC plus O&M and digital performance monitoring; 2024 digital transformation spending hit an estimated 2.8 trillion USD, raising expectations for lifecycle services. Bundled outcome contracts boost customer switching power when contractors lack end-to-end offerings. DL E&C’s core EPC competence mitigates risk, but limited aftermarket footprint weakens negotiating leverage; strategic partnerships fill coverage gaps.
- Lifecycle demand: EPC+O&M+digital
- Switching power rises with bundled outcomes
- DL E&C strong in EPC; aftermarket presence critical
- Partnerships used to cover service gaps
Buyers leverage >US$1bn EPC awards, LSTK and ~10% bonds compress EPC margins
In 2024 buyers concentrated mega-project awards (>US$1bn), enforcing LSTK terms that shift risk and ~10% performance guarantees to contractors, squeezing EPC margins. Transparent bidding and global sourcing plus $2.8tr digital spend increased buyer leverage; bundled EPC+O&M raises switching power. DL E&C counters with selective bidding, risk pricing and partnerships.
| Metric | 2024 |
|---|---|
| Mega-project threshold | >US$1bn |
| Performance bonds | ~10% of contract |
| Digital transformation spend | US$2.8tr |
Preview the Actual Deliverable
DL E&C Porter's Five Forces Analysis
This preview is the exact DL E&C Porter's Five Forces Analysis you'll receive after purchase—fully written, formatted, and ready to download. It contains the complete competitive assessment, including supplier power, buyer power, competitive rivalry, threat of substitution, and barriers to entry. No placeholders, no samples—what you see here is the deliverable available instantly after payment.











