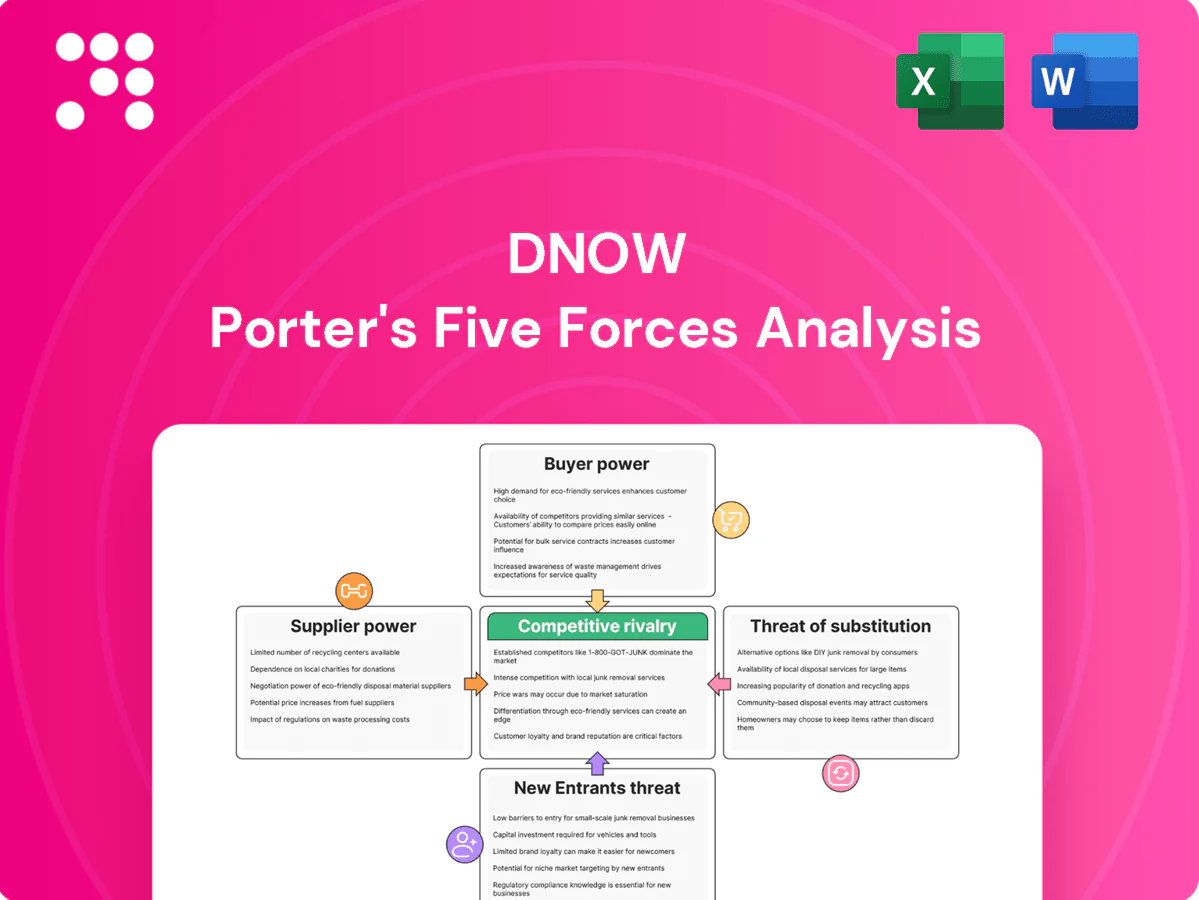
DNOW Porter's Five Forces Analysis

Don't Miss the Bigger Picture
DNOW faces moderate supplier power, differentiated buyer demands, and steady threat from substitutes, creating a competitive but navigable landscape. Operational scale and distribution reach are key advantages, while margin pressure and cyclical end-markets remain risks. This brief snapshot only scratches the surface. Unlock the full Porter's Five Forces Analysis to explore DNOW’s competitive dynamics, market pressures, and strategic advantages in detail.
Suppliers Bargaining Power

OEM concentration and brand leverage
Many critical categories—valves, actuators, line pipe, instrumentation—are dominated by branded OEMs that hold stringent API/NACE/ISO certifications, enabling pricing and allocation power in tight cycles. DNOW mitigates supplier leverage through multi-line portfolios and long-term contracts and stocking agreements. Despite this, brand/spec lock-ins and certification barriers kept supplier influence structurally elevated in 2024.
Qualification and approvals
Energy and industrial customers often require OEMs on approved vendor lists, concentrating spend with qualified suppliers and raising switching frictions for distributors in 2024. DNOW’s broad portfolio of approved lines partially mitigates this risk but losing a key manufacturer authorization in 2024 would likely cause measurable share erosion. The ability of suppliers to grant or revoke approvals sustains supplier bargaining power and pricing leverage.

Supply chain volatility and capacity
Steel, forgings, and casting capacity cycles lengthen lead times and push pricing; global crude steel output was 1,883 Mt in 2023 (World Steel Association), underscoring tight markets. During upcycles suppliers prioritize high-margin or strategic channels, raising supplier leverage. DNOW’s global network and inventory buffers mitigate shocks but cannot fully offset upstream constraints, so cyclicality intermittently boosts supplier power.

Private label and alternative sourcing
DNOW can introduce private-label or secondary sourcing for non-critical SKUs to gain price leverage against premium OEMs, while safety-critical or spec-bound items remain constrained by certification and liability requirements. Supplier power is therefore tiered by product criticality, with greater leverage in commodity items and limited substitution where specs or safety dictate. This dual strategy reduces buy-side cost exposure without compromising critical supply integrity.
- Private-label leverage in commoditized SKUs
- Limited substitution in safety/spec-bound items
- Supplier power tiered by criticality
Data integration and VMI dependencies
Integrated planning, EDI, and VMI tie DNOW’s operations directly to supplier data flows, improving cycle times but creating reliance on OEM forecasts and allocations; industry VMI programs reduced stockouts about 25% in 2024. Suppliers therefore influence availability and service levels, and DNOW mitigates risk through dual-sourcing and diversified inventories.
- Data linkage: EDI/VMI integration
- Risk: dependence on OEM forecasts
- Impact: suppliers control availability
- Mitigation: dual-sourcing, diverse inventories
VMI/EDI cut stockouts ~25% in 2024; steel tightness raised lead times (1,883 Mt)
Branded OEMs with API/NACE/ISO specs kept supplier pricing and allocation power in 2024; DNOW offsets via multi-line contracts and inventory buffers. VMI/EDI integration cut stockouts ~25% in 2024 but increased supplier dependence. Steel tightness (global crude steel 1,883 Mt in 2023) raised lead times and costs.
| Metric | 2023/2024 |
|---|---|
| Global crude steel | 1,883 Mt (2023) |
| VMI stockout reduction | ~25% (2024) |
What is included in the product
 Detailed Word Document
Comprehensive Porter's Five Forces for DNOW uncovering competitive drivers, supplier and buyer power, substitution and entry risks, and disruptive threats—tailored insights to inform strategy, valuation, and investor materials.

 Customizable Excel Spreadsheet
A clear one-sheet summary of DNOW's Five Forces with adjustable pressure levels and instant radar visualization—no macros, duplicate tabs for scenario comparisons, and customizable labels for seamless insertion into decks or dashboards.
Customers Bargaining Power

Large, consolidated customers
Supermajors, large independents and industrial conglomerates aggregate procurement—top buyers representing over 50% of oil and gas industry revenue in 2024—running competitive tenders that force pricing transparency, strict SLAs and rebate arrangements. This buyer concentration materially elevates leverage, pressuring distributors on margins and payment terms. DNOW must differentiate on total cost of ownership, rapid fulfillment and measurable service metrics to win bids.
Switching costs vs embedded services
Integrated supply, onsite storerooms and kitting raise switching costs by embedding DNOW into operations and logistics, making supplier change disruptive to uptime and planning. Many SKUs remain commoditized, so price-based switching at contract renewal persists, especially for fast-moving items. Embedded digital catalogs and VMI—shown in industry studies to cut inventory 20–30% and reduce stockouts up to 50%—temper churn. Buyer power is high but moderated by this operational integration.

Spec-driven procurement
Spec-driven procurement limits substitution and channels because end users require approved products; DNOWs alignment with operator approved lists — supported by its network of over 200 global service centers in 2024 — narrows buyer alternatives. When multiple distributors share the same approvals, buyers regain leverage through competitive sourcing. Thus, spec rigidity both reduces and restores buyer power depending on approval concentration.

Cyclic demand and budget discipline
Energy cycles drive abrupt spend cuts and renegotiations, and in downturns buyers demand concessions and inventory take-back flexibility, intensifying buyer power and forcing DNOW to accept tighter terms.
DNOW’s variable cost model enhances operational adaptability but margins compress as customers push pricing and payment concessions during downcycles, increasing working capital strain and contract renegotiation frequency.
- Buyer leverage rises in downcycles
- Concessions and inventory flexibility demanded
- Variable-cost model aids adaptation
- Margins compress under pricing pressure
Digital procurement and analytics
E-procurement portals and spend analytics enable line-item price benchmarking and, per 2024 surveys, about 58% of procurement teams use these tools, which lets buyers split awards and enforce compliance to negotiated rates. DNOW’s digital storefronts and data services must match that sophistication because transparency structurally raises buyer bargaining power.
- 58% 2024 adoption of e-procurement
- Line-item benchmarking increases price pressure
- Split-awards enable compliance enforcement
- Transparency = higher buyer bargaining power
Buyers >50% revenue; VMI cuts inventory 20-30%; e-procurement 58%
Buyer power is high: top customers account for over 50% of industry revenue in 2024, driving tendering, rebates and tighter payment terms. Operational integration (onsite storerooms, kitting, VMI) raises switching costs, with VMI cutting inventory 20–30% and reducing stockouts up to 50%. Digital procurement adoption (58% in 2024) and benchmarking keep price pressure persistent; DNOW’s 200+ service centers support approval-led stickiness.
| Metric | 2024 Value |
|---|---|
| Top-buyer revenue share | >50% |
| E-procurement adoption | 58% |
| DNOW service centers | 200+ |
| VMI inventory reduction | 20–30% |
Preview the Actual Deliverable
DNOW Porter's Five Forces Analysis
This preview is the exact Porter's Five Forces analysis for DNOW that you'll receive immediately after purchase—fully formatted, complete and ready to use. It contains the same competitive assessment, supplier and buyer power, threat analyses, and strategic implications shown here, with no placeholders or mockups. Buy with confidence: the file you see is the file you download.

Don't Miss the Bigger Picture
DNOW faces moderate supplier power, differentiated buyer demands, and steady threat from substitutes, creating a competitive but navigable landscape. Operational scale and distribution reach are key advantages, while margin pressure and cyclical end-markets remain risks. This brief snapshot only scratches the surface. Unlock the full Porter's Five Forces Analysis to explore DNOW’s competitive dynamics, market pressures, and strategic advantages in detail.
Suppliers Bargaining Power
OEM concentration and brand leverage
Many critical categories—valves, actuators, line pipe, instrumentation—are dominated by branded OEMs that hold stringent API/NACE/ISO certifications, enabling pricing and allocation power in tight cycles. DNOW mitigates supplier leverage through multi-line portfolios and long-term contracts and stocking agreements. Despite this, brand/spec lock-ins and certification barriers kept supplier influence structurally elevated in 2024.
Qualification and approvals
Energy and industrial customers often require OEMs on approved vendor lists, concentrating spend with qualified suppliers and raising switching frictions for distributors in 2024. DNOW’s broad portfolio of approved lines partially mitigates this risk but losing a key manufacturer authorization in 2024 would likely cause measurable share erosion. The ability of suppliers to grant or revoke approvals sustains supplier bargaining power and pricing leverage.
Supply chain volatility and capacity
Steel, forgings, and casting capacity cycles lengthen lead times and push pricing; global crude steel output was 1,883 Mt in 2023 (World Steel Association), underscoring tight markets. During upcycles suppliers prioritize high-margin or strategic channels, raising supplier leverage. DNOW’s global network and inventory buffers mitigate shocks but cannot fully offset upstream constraints, so cyclicality intermittently boosts supplier power.
Private label and alternative sourcing
DNOW can introduce private-label or secondary sourcing for non-critical SKUs to gain price leverage against premium OEMs, while safety-critical or spec-bound items remain constrained by certification and liability requirements. Supplier power is therefore tiered by product criticality, with greater leverage in commodity items and limited substitution where specs or safety dictate. This dual strategy reduces buy-side cost exposure without compromising critical supply integrity.
- Private-label leverage in commoditized SKUs
- Limited substitution in safety/spec-bound items
- Supplier power tiered by criticality
Data integration and VMI dependencies
Integrated planning, EDI, and VMI tie DNOW’s operations directly to supplier data flows, improving cycle times but creating reliance on OEM forecasts and allocations; industry VMI programs reduced stockouts about 25% in 2024. Suppliers therefore influence availability and service levels, and DNOW mitigates risk through dual-sourcing and diversified inventories.
- Data linkage: EDI/VMI integration
- Risk: dependence on OEM forecasts
- Impact: suppliers control availability
- Mitigation: dual-sourcing, diverse inventories
VMI/EDI cut stockouts ~25% in 2024; steel tightness raised lead times (1,883 Mt)
Branded OEMs with API/NACE/ISO specs kept supplier pricing and allocation power in 2024; DNOW offsets via multi-line contracts and inventory buffers. VMI/EDI integration cut stockouts ~25% in 2024 but increased supplier dependence. Steel tightness (global crude steel 1,883 Mt in 2023) raised lead times and costs.
| Metric | 2023/2024 |
|---|---|
| Global crude steel | 1,883 Mt (2023) |
| VMI stockout reduction | ~25% (2024) |
What is included in the product
Detailed Word Document
Comprehensive Porter's Five Forces for DNOW uncovering competitive drivers, supplier and buyer power, substitution and entry risks, and disruptive threats—tailored insights to inform strategy, valuation, and investor materials.
Customizable Excel Spreadsheet
A clear one-sheet summary of DNOW's Five Forces with adjustable pressure levels and instant radar visualization—no macros, duplicate tabs for scenario comparisons, and customizable labels for seamless insertion into decks or dashboards.
Customers Bargaining Power
Large, consolidated customers
Supermajors, large independents and industrial conglomerates aggregate procurement—top buyers representing over 50% of oil and gas industry revenue in 2024—running competitive tenders that force pricing transparency, strict SLAs and rebate arrangements. This buyer concentration materially elevates leverage, pressuring distributors on margins and payment terms. DNOW must differentiate on total cost of ownership, rapid fulfillment and measurable service metrics to win bids.
Switching costs vs embedded services
Integrated supply, onsite storerooms and kitting raise switching costs by embedding DNOW into operations and logistics, making supplier change disruptive to uptime and planning. Many SKUs remain commoditized, so price-based switching at contract renewal persists, especially for fast-moving items. Embedded digital catalogs and VMI—shown in industry studies to cut inventory 20–30% and reduce stockouts up to 50%—temper churn. Buyer power is high but moderated by this operational integration.
Spec-driven procurement
Spec-driven procurement limits substitution and channels because end users require approved products; DNOWs alignment with operator approved lists — supported by its network of over 200 global service centers in 2024 — narrows buyer alternatives. When multiple distributors share the same approvals, buyers regain leverage through competitive sourcing. Thus, spec rigidity both reduces and restores buyer power depending on approval concentration.
Cyclic demand and budget discipline
Energy cycles drive abrupt spend cuts and renegotiations, and in downturns buyers demand concessions and inventory take-back flexibility, intensifying buyer power and forcing DNOW to accept tighter terms.
DNOW’s variable cost model enhances operational adaptability but margins compress as customers push pricing and payment concessions during downcycles, increasing working capital strain and contract renegotiation frequency.
- Buyer leverage rises in downcycles
- Concessions and inventory flexibility demanded
- Variable-cost model aids adaptation
- Margins compress under pricing pressure
Digital procurement and analytics
E-procurement portals and spend analytics enable line-item price benchmarking and, per 2024 surveys, about 58% of procurement teams use these tools, which lets buyers split awards and enforce compliance to negotiated rates. DNOW’s digital storefronts and data services must match that sophistication because transparency structurally raises buyer bargaining power.
- 58% 2024 adoption of e-procurement
- Line-item benchmarking increases price pressure
- Split-awards enable compliance enforcement
- Transparency = higher buyer bargaining power
Buyers >50% revenue; VMI cuts inventory 20-30%; e-procurement 58%
Buyer power is high: top customers account for over 50% of industry revenue in 2024, driving tendering, rebates and tighter payment terms. Operational integration (onsite storerooms, kitting, VMI) raises switching costs, with VMI cutting inventory 20–30% and reducing stockouts up to 50%. Digital procurement adoption (58% in 2024) and benchmarking keep price pressure persistent; DNOW’s 200+ service centers support approval-led stickiness.
| Metric | 2024 Value |
|---|---|
| Top-buyer revenue share | >50% |
| E-procurement adoption | 58% |
| DNOW service centers | 200+ |
| VMI inventory reduction | 20–30% |
Preview the Actual Deliverable
DNOW Porter's Five Forces Analysis
This preview is the exact Porter's Five Forces analysis for DNOW that you'll receive immediately after purchase—fully formatted, complete and ready to use. It contains the same competitive assessment, supplier and buyer power, threat analyses, and strategic implications shown here, with no placeholders or mockups. Buy with confidence: the file you see is the file you download.
Original: $10.00
-65%$10.00
$3.50Description
Don't Miss the Bigger Picture
DNOW faces moderate supplier power, differentiated buyer demands, and steady threat from substitutes, creating a competitive but navigable landscape. Operational scale and distribution reach are key advantages, while margin pressure and cyclical end-markets remain risks. This brief snapshot only scratches the surface. Unlock the full Porter's Five Forces Analysis to explore DNOW’s competitive dynamics, market pressures, and strategic advantages in detail.
Suppliers Bargaining Power
OEM concentration and brand leverage
Many critical categories—valves, actuators, line pipe, instrumentation—are dominated by branded OEMs that hold stringent API/NACE/ISO certifications, enabling pricing and allocation power in tight cycles. DNOW mitigates supplier leverage through multi-line portfolios and long-term contracts and stocking agreements. Despite this, brand/spec lock-ins and certification barriers kept supplier influence structurally elevated in 2024.
Qualification and approvals
Energy and industrial customers often require OEMs on approved vendor lists, concentrating spend with qualified suppliers and raising switching frictions for distributors in 2024. DNOW’s broad portfolio of approved lines partially mitigates this risk but losing a key manufacturer authorization in 2024 would likely cause measurable share erosion. The ability of suppliers to grant or revoke approvals sustains supplier bargaining power and pricing leverage.
Supply chain volatility and capacity
Steel, forgings, and casting capacity cycles lengthen lead times and push pricing; global crude steel output was 1,883 Mt in 2023 (World Steel Association), underscoring tight markets. During upcycles suppliers prioritize high-margin or strategic channels, raising supplier leverage. DNOW’s global network and inventory buffers mitigate shocks but cannot fully offset upstream constraints, so cyclicality intermittently boosts supplier power.
Private label and alternative sourcing
DNOW can introduce private-label or secondary sourcing for non-critical SKUs to gain price leverage against premium OEMs, while safety-critical or spec-bound items remain constrained by certification and liability requirements. Supplier power is therefore tiered by product criticality, with greater leverage in commodity items and limited substitution where specs or safety dictate. This dual strategy reduces buy-side cost exposure without compromising critical supply integrity.
- Private-label leverage in commoditized SKUs
- Limited substitution in safety/spec-bound items
- Supplier power tiered by criticality
Data integration and VMI dependencies
Integrated planning, EDI, and VMI tie DNOW’s operations directly to supplier data flows, improving cycle times but creating reliance on OEM forecasts and allocations; industry VMI programs reduced stockouts about 25% in 2024. Suppliers therefore influence availability and service levels, and DNOW mitigates risk through dual-sourcing and diversified inventories.
- Data linkage: EDI/VMI integration
- Risk: dependence on OEM forecasts
- Impact: suppliers control availability
- Mitigation: dual-sourcing, diverse inventories
VMI/EDI cut stockouts ~25% in 2024; steel tightness raised lead times (1,883 Mt)
Branded OEMs with API/NACE/ISO specs kept supplier pricing and allocation power in 2024; DNOW offsets via multi-line contracts and inventory buffers. VMI/EDI integration cut stockouts ~25% in 2024 but increased supplier dependence. Steel tightness (global crude steel 1,883 Mt in 2023) raised lead times and costs.
| Metric | 2023/2024 |
|---|---|
| Global crude steel | 1,883 Mt (2023) |
| VMI stockout reduction | ~25% (2024) |
What is included in the product
Detailed Word Document
Comprehensive Porter's Five Forces for DNOW uncovering competitive drivers, supplier and buyer power, substitution and entry risks, and disruptive threats—tailored insights to inform strategy, valuation, and investor materials.
Customizable Excel Spreadsheet
A clear one-sheet summary of DNOW's Five Forces with adjustable pressure levels and instant radar visualization—no macros, duplicate tabs for scenario comparisons, and customizable labels for seamless insertion into decks or dashboards.
Customers Bargaining Power
Large, consolidated customers
Supermajors, large independents and industrial conglomerates aggregate procurement—top buyers representing over 50% of oil and gas industry revenue in 2024—running competitive tenders that force pricing transparency, strict SLAs and rebate arrangements. This buyer concentration materially elevates leverage, pressuring distributors on margins and payment terms. DNOW must differentiate on total cost of ownership, rapid fulfillment and measurable service metrics to win bids.
Switching costs vs embedded services
Integrated supply, onsite storerooms and kitting raise switching costs by embedding DNOW into operations and logistics, making supplier change disruptive to uptime and planning. Many SKUs remain commoditized, so price-based switching at contract renewal persists, especially for fast-moving items. Embedded digital catalogs and VMI—shown in industry studies to cut inventory 20–30% and reduce stockouts up to 50%—temper churn. Buyer power is high but moderated by this operational integration.
Spec-driven procurement
Spec-driven procurement limits substitution and channels because end users require approved products; DNOWs alignment with operator approved lists — supported by its network of over 200 global service centers in 2024 — narrows buyer alternatives. When multiple distributors share the same approvals, buyers regain leverage through competitive sourcing. Thus, spec rigidity both reduces and restores buyer power depending on approval concentration.
Cyclic demand and budget discipline
Energy cycles drive abrupt spend cuts and renegotiations, and in downturns buyers demand concessions and inventory take-back flexibility, intensifying buyer power and forcing DNOW to accept tighter terms.
DNOW’s variable cost model enhances operational adaptability but margins compress as customers push pricing and payment concessions during downcycles, increasing working capital strain and contract renegotiation frequency.
- Buyer leverage rises in downcycles
- Concessions and inventory flexibility demanded
- Variable-cost model aids adaptation
- Margins compress under pricing pressure
Digital procurement and analytics
E-procurement portals and spend analytics enable line-item price benchmarking and, per 2024 surveys, about 58% of procurement teams use these tools, which lets buyers split awards and enforce compliance to negotiated rates. DNOW’s digital storefronts and data services must match that sophistication because transparency structurally raises buyer bargaining power.
- 58% 2024 adoption of e-procurement
- Line-item benchmarking increases price pressure
- Split-awards enable compliance enforcement
- Transparency = higher buyer bargaining power
Buyers >50% revenue; VMI cuts inventory 20-30%; e-procurement 58%
Buyer power is high: top customers account for over 50% of industry revenue in 2024, driving tendering, rebates and tighter payment terms. Operational integration (onsite storerooms, kitting, VMI) raises switching costs, with VMI cutting inventory 20–30% and reducing stockouts up to 50%. Digital procurement adoption (58% in 2024) and benchmarking keep price pressure persistent; DNOW’s 200+ service centers support approval-led stickiness.
| Metric | 2024 Value |
|---|---|
| Top-buyer revenue share | >50% |
| E-procurement adoption | 58% |
| DNOW service centers | 200+ |
| VMI inventory reduction | 20–30% |
Preview the Actual Deliverable
DNOW Porter's Five Forces Analysis
This preview is the exact Porter's Five Forces analysis for DNOW that you'll receive immediately after purchase—fully formatted, complete and ready to use. It contains the same competitive assessment, supplier and buyer power, threat analyses, and strategic implications shown here, with no placeholders or mockups. Buy with confidence: the file you see is the file you download.











