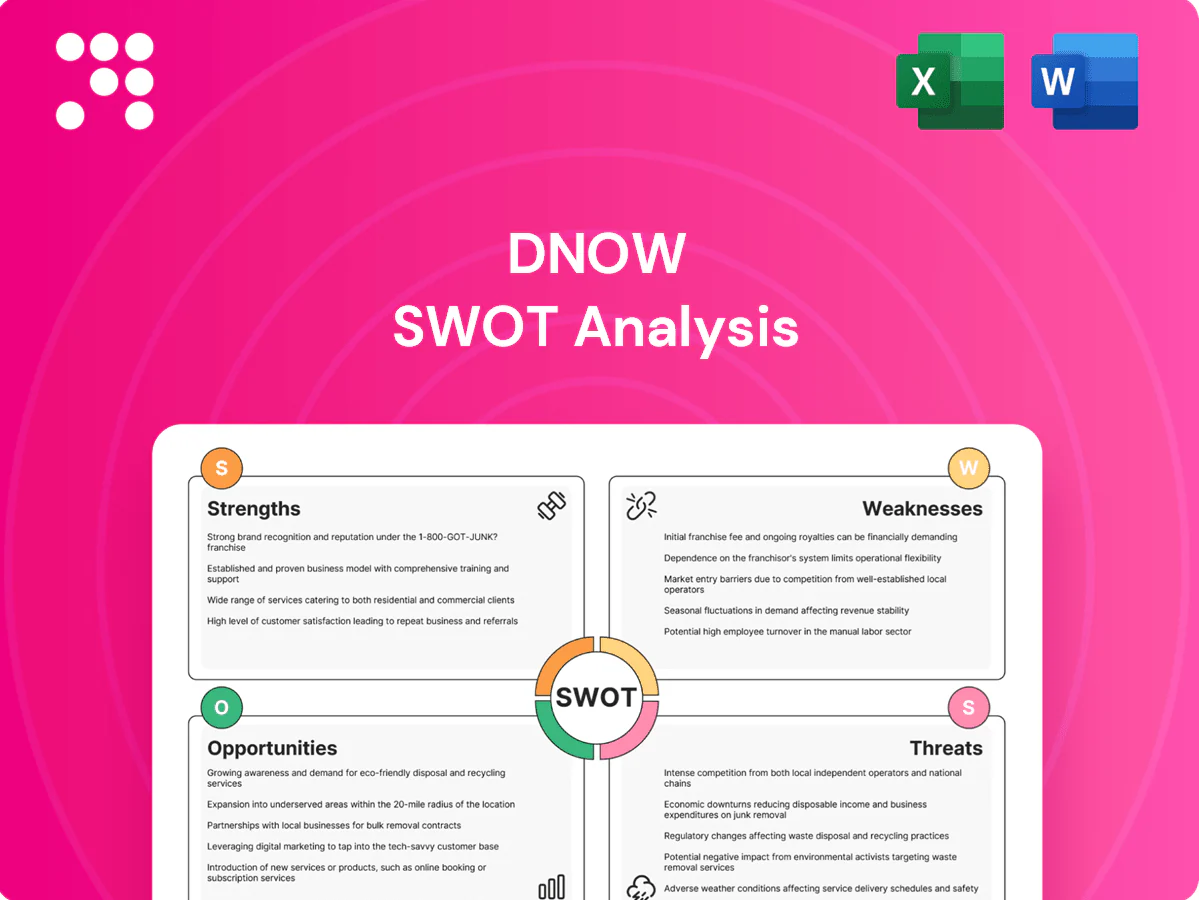
DNOW SWOT Analysis

Dive Deeper Into the Company’s Strategic Blueprint
Discover DNOW's strategic strengths, market threats, and growth levers in our concise SWOT preview—then get the full analysis for actionable insights. Purchase the complete SWOT to access a research-backed, editable report and Excel model ideal for investors, consultants, and planners. Unlock data-driven recommendations to inform your next move.
Strengths

Global distribution footprint
DNOW’s network of 120+ distribution centers and branches enables rapid delivery and local service in key energy and industrial basins, reducing lead times and logistics costs for customers. Geographic diversification helps buffer regional downturns and supported DNOW’s resilience during 2023–24 market cycles. Larger throughput from this scale strengthens supplier partnerships and buying power.
Diverse end-market exposure
Serving upstream, midstream, downstream and broader industrial customers spreads demand risk across heterogeneous end markets. A broad product mix—MRO, line pipe, valves and fittings—stabilizes revenue against single-market shocks. Different cyclical timing across segments provides partial offsets, while cross-selling across channels supports wallet-share gains and higher customer retention.

Value-added services suite
DNOW's suite of value-added services—supply chain management, project management, and valve actuation—transitions the company from pure distributor to integrated service provider, embedding recurring revenue streams. These embedded services raise switching costs and deepen customer stickiness by integrating DNOW into clients' operational workflows. Engineered solutions allow DNOW to capture a higher-margin product mix versus commodity sales. The combined offering differentiates DNOW from competitors that rely solely on commodity distribution.

Strong OEM/supplier partnerships
Longstanding vendor relationships secure access to leading brands and allocations during tight market cycles; preferred-supplier status often yields improved pricing and payment terms. Joint planning and collaborative forecasting with OEMs materially improve inventory availability and delivery reliability, strengthening DNOW’s ability to fulfill complex project specifications on schedule and to spec.
- Preferred allocations in constrained markets
- Improved pricing/terms from vendors
- Joint planning increases on-time delivery
- Better capability to meet complex project specs
Inventory and digital capabilities
DNOW's inventory and digital capabilities—robust inventory management, VMI, and e-commerce tools—streamline procurement and embed DNOW in customer workflows. Real-time visibility cuts stockouts and working capital drag, with VMI programs commonly reducing inventory 20–30%. Transactional data informs smarter assortment and demand planning across accounts.
- Robust inventory management and VMI
- Real-time visibility: -20–30% inventory
- Embedded digital workflows
- Data-driven assortment and demand planning
Fast local delivery from 120+ centers lowers logistics costs and boosts resilience
DNOW’s 120+ distribution centers enable rapid local delivery and lower logistics costs; geographic diversification supported resilience across 2023–24 cycles. Broad end-market exposure and product mix smooth revenue volatility while engineered services and VMI deepen customer stickiness and lift margins. Strong vendor partnerships secure preferred allocations in tight markets and improve pricing/terms.
| Metric | Value |
|---|---|
| Distribution centers | 120+ |
| VMI inventory reduction | 20–30% |
| Relevant period | 2023–24 |
What is included in the product
 Detailed Word Document
Provides a focused SWOT analysis of DNOW, highlighting internal strengths and weaknesses and external opportunities and threats shaping its competitive position and strategic outlook.

 Customizable Excel Spreadsheet
Provides a focused DNOW SWOT matrix that clarifies core strengths, weaknesses, opportunities, and threats to remove strategic ambiguity for managers; editable layout enables quick updates and stakeholder-ready visuals for faster decision-making.
Weaknesses

Energy cycle sensitivity
Revenue for DNOW is highly tied to oil and gas activity and capital budgets, which are volatile and can swing sharply — upstream capex fell roughly 40% in the 2015–16 downturn, illustrating the risk to supplier demand.
Downturns quickly reduce orders for MRO and project supplies, compressing margins and lowering facility utilization as fixed costs remain.
Rapid commodity-price swings make demand forecasting difficult, increasing working capital strain and inventory mismatch during recovery phases.
Low structural margins
Distribution models, including DNOW, operate with thin gross margins—typically 10–15% for industrial distributors—plus high price transparency that limits pricing power and makes profits vulnerable to cost inflation. Volume declines quickly deleverage fixed costs, and durable margin expansion hinges on shifting mix toward services, which often carry 2–3x higher margins.

Working capital intensity
Large, diverse inventories and extended customer terms tie up cash—DNOW reported roughly $1.1 billion in inventory and receivables driving inventory days well above peers in FY2024, squeezing liquidity. Inventory misalignment raises write-down risk during demand shocks, as seen with elevated reserve activity in 2024. Supplier terms could tighten in stressed markets, increasing cost of goods and working capital needs. This intensity limits flexibility for organic growth or M&A funding.

Project and execution risk
Complex project management and valve actuation work expose DNOW to scope and timeline risks; industry studies (Flyvbjerg et al.) show large projects average ~28% cost overruns, which can elevate costs and erode margins. Coordination across vendors, logistics, and field service is operationally demanding and increases schedule risk. Quality issues raise rework costs and can damage reputation.
- Scope creep and schedule risk
- Vendor/logistics coordination
- Rework and reputational impact
Customer concentration exposure
Customer concentration exposes DNOW to risk: large E&P and midstream operators can represent significant regional revenue, and DNOW reported roughly $2.1B in 2024 net sales, amplifying exposure where a few accounts dominate.
Loss or slowdown of key accounts can materially dent results, big buyers exert pricing pressure, and periodic contract renewals create lumpiness in revenue recognition and margin risk.
- Top-customer exposure
- Revenue volatility from account loss
- Pricing pressure from large buyers
- Contract renewal timing risk
Cyclical oilfield distributor: thin 10–15% margins, $1.1B inventory/AR
DNOW revenue is highly cyclic, tied to oil & gas capex swings (upstream capex fell ~40% in 2015–16), causing rapid order and margin compression.
Thin distributor gross margins (10–15%) and high price transparency limit pricing power; volume declines quickly deleverage fixed costs.
Large inventories and receivables (~$1.1B FY2024) and customer concentration (FY2024 net sales ~$2.1B) strain liquidity and elevate write-down risk.
| Metric | Value |
|---|---|
| FY2024 Net Sales | $2.1B |
| Inventory & AR FY2024 | $1.1B |
| Distributor gross margin | 10–15% |
| Project cost overrun (avg) | ~28% |
Same Document Delivered
DNOW SWOT Analysis
This is the actual DNOW SWOT analysis document you’ll receive upon purchase—no surprises, just professional quality. The preview below is taken directly from the full report you'll get; purchase unlocks the entire in-depth, editable version. You’re viewing a live excerpt of the complete file, ready for immediate download after checkout.

Dive Deeper Into the Company’s Strategic Blueprint
Discover DNOW's strategic strengths, market threats, and growth levers in our concise SWOT preview—then get the full analysis for actionable insights. Purchase the complete SWOT to access a research-backed, editable report and Excel model ideal for investors, consultants, and planners. Unlock data-driven recommendations to inform your next move.
Strengths
Global distribution footprint
DNOW’s network of 120+ distribution centers and branches enables rapid delivery and local service in key energy and industrial basins, reducing lead times and logistics costs for customers. Geographic diversification helps buffer regional downturns and supported DNOW’s resilience during 2023–24 market cycles. Larger throughput from this scale strengthens supplier partnerships and buying power.
Diverse end-market exposure
Serving upstream, midstream, downstream and broader industrial customers spreads demand risk across heterogeneous end markets. A broad product mix—MRO, line pipe, valves and fittings—stabilizes revenue against single-market shocks. Different cyclical timing across segments provides partial offsets, while cross-selling across channels supports wallet-share gains and higher customer retention.
Value-added services suite
DNOW's suite of value-added services—supply chain management, project management, and valve actuation—transitions the company from pure distributor to integrated service provider, embedding recurring revenue streams. These embedded services raise switching costs and deepen customer stickiness by integrating DNOW into clients' operational workflows. Engineered solutions allow DNOW to capture a higher-margin product mix versus commodity sales. The combined offering differentiates DNOW from competitors that rely solely on commodity distribution.
Strong OEM/supplier partnerships
Longstanding vendor relationships secure access to leading brands and allocations during tight market cycles; preferred-supplier status often yields improved pricing and payment terms. Joint planning and collaborative forecasting with OEMs materially improve inventory availability and delivery reliability, strengthening DNOW’s ability to fulfill complex project specifications on schedule and to spec.
- Preferred allocations in constrained markets
- Improved pricing/terms from vendors
- Joint planning increases on-time delivery
- Better capability to meet complex project specs
Inventory and digital capabilities
DNOW's inventory and digital capabilities—robust inventory management, VMI, and e-commerce tools—streamline procurement and embed DNOW in customer workflows. Real-time visibility cuts stockouts and working capital drag, with VMI programs commonly reducing inventory 20–30%. Transactional data informs smarter assortment and demand planning across accounts.
- Robust inventory management and VMI
- Real-time visibility: -20–30% inventory
- Embedded digital workflows
- Data-driven assortment and demand planning
Fast local delivery from 120+ centers lowers logistics costs and boosts resilience
DNOW’s 120+ distribution centers enable rapid local delivery and lower logistics costs; geographic diversification supported resilience across 2023–24 cycles. Broad end-market exposure and product mix smooth revenue volatility while engineered services and VMI deepen customer stickiness and lift margins. Strong vendor partnerships secure preferred allocations in tight markets and improve pricing/terms.
| Metric | Value |
|---|---|
| Distribution centers | 120+ |
| VMI inventory reduction | 20–30% |
| Relevant period | 2023–24 |
What is included in the product
Detailed Word Document
Provides a focused SWOT analysis of DNOW, highlighting internal strengths and weaknesses and external opportunities and threats shaping its competitive position and strategic outlook.
Customizable Excel Spreadsheet
Provides a focused DNOW SWOT matrix that clarifies core strengths, weaknesses, opportunities, and threats to remove strategic ambiguity for managers; editable layout enables quick updates and stakeholder-ready visuals for faster decision-making.
Weaknesses
Energy cycle sensitivity
Revenue for DNOW is highly tied to oil and gas activity and capital budgets, which are volatile and can swing sharply — upstream capex fell roughly 40% in the 2015–16 downturn, illustrating the risk to supplier demand.
Downturns quickly reduce orders for MRO and project supplies, compressing margins and lowering facility utilization as fixed costs remain.
Rapid commodity-price swings make demand forecasting difficult, increasing working capital strain and inventory mismatch during recovery phases.
Low structural margins
Distribution models, including DNOW, operate with thin gross margins—typically 10–15% for industrial distributors—plus high price transparency that limits pricing power and makes profits vulnerable to cost inflation. Volume declines quickly deleverage fixed costs, and durable margin expansion hinges on shifting mix toward services, which often carry 2–3x higher margins.
Working capital intensity
Large, diverse inventories and extended customer terms tie up cash—DNOW reported roughly $1.1 billion in inventory and receivables driving inventory days well above peers in FY2024, squeezing liquidity. Inventory misalignment raises write-down risk during demand shocks, as seen with elevated reserve activity in 2024. Supplier terms could tighten in stressed markets, increasing cost of goods and working capital needs. This intensity limits flexibility for organic growth or M&A funding.
Project and execution risk
Complex project management and valve actuation work expose DNOW to scope and timeline risks; industry studies (Flyvbjerg et al.) show large projects average ~28% cost overruns, which can elevate costs and erode margins. Coordination across vendors, logistics, and field service is operationally demanding and increases schedule risk. Quality issues raise rework costs and can damage reputation.
- Scope creep and schedule risk
- Vendor/logistics coordination
- Rework and reputational impact
Customer concentration exposure
Customer concentration exposes DNOW to risk: large E&P and midstream operators can represent significant regional revenue, and DNOW reported roughly $2.1B in 2024 net sales, amplifying exposure where a few accounts dominate.
Loss or slowdown of key accounts can materially dent results, big buyers exert pricing pressure, and periodic contract renewals create lumpiness in revenue recognition and margin risk.
- Top-customer exposure
- Revenue volatility from account loss
- Pricing pressure from large buyers
- Contract renewal timing risk
Cyclical oilfield distributor: thin 10–15% margins, $1.1B inventory/AR
DNOW revenue is highly cyclic, tied to oil & gas capex swings (upstream capex fell ~40% in 2015–16), causing rapid order and margin compression.
Thin distributor gross margins (10–15%) and high price transparency limit pricing power; volume declines quickly deleverage fixed costs.
Large inventories and receivables (~$1.1B FY2024) and customer concentration (FY2024 net sales ~$2.1B) strain liquidity and elevate write-down risk.
| Metric | Value |
|---|---|
| FY2024 Net Sales | $2.1B |
| Inventory & AR FY2024 | $1.1B |
| Distributor gross margin | 10–15% |
| Project cost overrun (avg) | ~28% |
Same Document Delivered
DNOW SWOT Analysis
This is the actual DNOW SWOT analysis document you’ll receive upon purchase—no surprises, just professional quality. The preview below is taken directly from the full report you'll get; purchase unlocks the entire in-depth, editable version. You’re viewing a live excerpt of the complete file, ready for immediate download after checkout.
Description
Dive Deeper Into the Company’s Strategic Blueprint
Discover DNOW's strategic strengths, market threats, and growth levers in our concise SWOT preview—then get the full analysis for actionable insights. Purchase the complete SWOT to access a research-backed, editable report and Excel model ideal for investors, consultants, and planners. Unlock data-driven recommendations to inform your next move.
Strengths
Global distribution footprint
DNOW’s network of 120+ distribution centers and branches enables rapid delivery and local service in key energy and industrial basins, reducing lead times and logistics costs for customers. Geographic diversification helps buffer regional downturns and supported DNOW’s resilience during 2023–24 market cycles. Larger throughput from this scale strengthens supplier partnerships and buying power.
Diverse end-market exposure
Serving upstream, midstream, downstream and broader industrial customers spreads demand risk across heterogeneous end markets. A broad product mix—MRO, line pipe, valves and fittings—stabilizes revenue against single-market shocks. Different cyclical timing across segments provides partial offsets, while cross-selling across channels supports wallet-share gains and higher customer retention.
Value-added services suite
DNOW's suite of value-added services—supply chain management, project management, and valve actuation—transitions the company from pure distributor to integrated service provider, embedding recurring revenue streams. These embedded services raise switching costs and deepen customer stickiness by integrating DNOW into clients' operational workflows. Engineered solutions allow DNOW to capture a higher-margin product mix versus commodity sales. The combined offering differentiates DNOW from competitors that rely solely on commodity distribution.
Strong OEM/supplier partnerships
Longstanding vendor relationships secure access to leading brands and allocations during tight market cycles; preferred-supplier status often yields improved pricing and payment terms. Joint planning and collaborative forecasting with OEMs materially improve inventory availability and delivery reliability, strengthening DNOW’s ability to fulfill complex project specifications on schedule and to spec.
- Preferred allocations in constrained markets
- Improved pricing/terms from vendors
- Joint planning increases on-time delivery
- Better capability to meet complex project specs
Inventory and digital capabilities
DNOW's inventory and digital capabilities—robust inventory management, VMI, and e-commerce tools—streamline procurement and embed DNOW in customer workflows. Real-time visibility cuts stockouts and working capital drag, with VMI programs commonly reducing inventory 20–30%. Transactional data informs smarter assortment and demand planning across accounts.
- Robust inventory management and VMI
- Real-time visibility: -20–30% inventory
- Embedded digital workflows
- Data-driven assortment and demand planning
Fast local delivery from 120+ centers lowers logistics costs and boosts resilience
DNOW’s 120+ distribution centers enable rapid local delivery and lower logistics costs; geographic diversification supported resilience across 2023–24 cycles. Broad end-market exposure and product mix smooth revenue volatility while engineered services and VMI deepen customer stickiness and lift margins. Strong vendor partnerships secure preferred allocations in tight markets and improve pricing/terms.
| Metric | Value |
|---|---|
| Distribution centers | 120+ |
| VMI inventory reduction | 20–30% |
| Relevant period | 2023–24 |
What is included in the product
Detailed Word Document
Provides a focused SWOT analysis of DNOW, highlighting internal strengths and weaknesses and external opportunities and threats shaping its competitive position and strategic outlook.
Customizable Excel Spreadsheet
Provides a focused DNOW SWOT matrix that clarifies core strengths, weaknesses, opportunities, and threats to remove strategic ambiguity for managers; editable layout enables quick updates and stakeholder-ready visuals for faster decision-making.
Weaknesses
Energy cycle sensitivity
Revenue for DNOW is highly tied to oil and gas activity and capital budgets, which are volatile and can swing sharply — upstream capex fell roughly 40% in the 2015–16 downturn, illustrating the risk to supplier demand.
Downturns quickly reduce orders for MRO and project supplies, compressing margins and lowering facility utilization as fixed costs remain.
Rapid commodity-price swings make demand forecasting difficult, increasing working capital strain and inventory mismatch during recovery phases.
Low structural margins
Distribution models, including DNOW, operate with thin gross margins—typically 10–15% for industrial distributors—plus high price transparency that limits pricing power and makes profits vulnerable to cost inflation. Volume declines quickly deleverage fixed costs, and durable margin expansion hinges on shifting mix toward services, which often carry 2–3x higher margins.
Working capital intensity
Large, diverse inventories and extended customer terms tie up cash—DNOW reported roughly $1.1 billion in inventory and receivables driving inventory days well above peers in FY2024, squeezing liquidity. Inventory misalignment raises write-down risk during demand shocks, as seen with elevated reserve activity in 2024. Supplier terms could tighten in stressed markets, increasing cost of goods and working capital needs. This intensity limits flexibility for organic growth or M&A funding.
Project and execution risk
Complex project management and valve actuation work expose DNOW to scope and timeline risks; industry studies (Flyvbjerg et al.) show large projects average ~28% cost overruns, which can elevate costs and erode margins. Coordination across vendors, logistics, and field service is operationally demanding and increases schedule risk. Quality issues raise rework costs and can damage reputation.
- Scope creep and schedule risk
- Vendor/logistics coordination
- Rework and reputational impact
Customer concentration exposure
Customer concentration exposes DNOW to risk: large E&P and midstream operators can represent significant regional revenue, and DNOW reported roughly $2.1B in 2024 net sales, amplifying exposure where a few accounts dominate.
Loss or slowdown of key accounts can materially dent results, big buyers exert pricing pressure, and periodic contract renewals create lumpiness in revenue recognition and margin risk.
- Top-customer exposure
- Revenue volatility from account loss
- Pricing pressure from large buyers
- Contract renewal timing risk
Cyclical oilfield distributor: thin 10–15% margins, $1.1B inventory/AR
DNOW revenue is highly cyclic, tied to oil & gas capex swings (upstream capex fell ~40% in 2015–16), causing rapid order and margin compression.
Thin distributor gross margins (10–15%) and high price transparency limit pricing power; volume declines quickly deleverage fixed costs.
Large inventories and receivables (~$1.1B FY2024) and customer concentration (FY2024 net sales ~$2.1B) strain liquidity and elevate write-down risk.
| Metric | Value |
|---|---|
| FY2024 Net Sales | $2.1B |
| Inventory & AR FY2024 | $1.1B |
| Distributor gross margin | 10–15% |
| Project cost overrun (avg) | ~28% |
Same Document Delivered
DNOW SWOT Analysis
This is the actual DNOW SWOT analysis document you’ll receive upon purchase—no surprises, just professional quality. The preview below is taken directly from the full report you'll get; purchase unlocks the entire in-depth, editable version. You’re viewing a live excerpt of the complete file, ready for immediate download after checkout.











