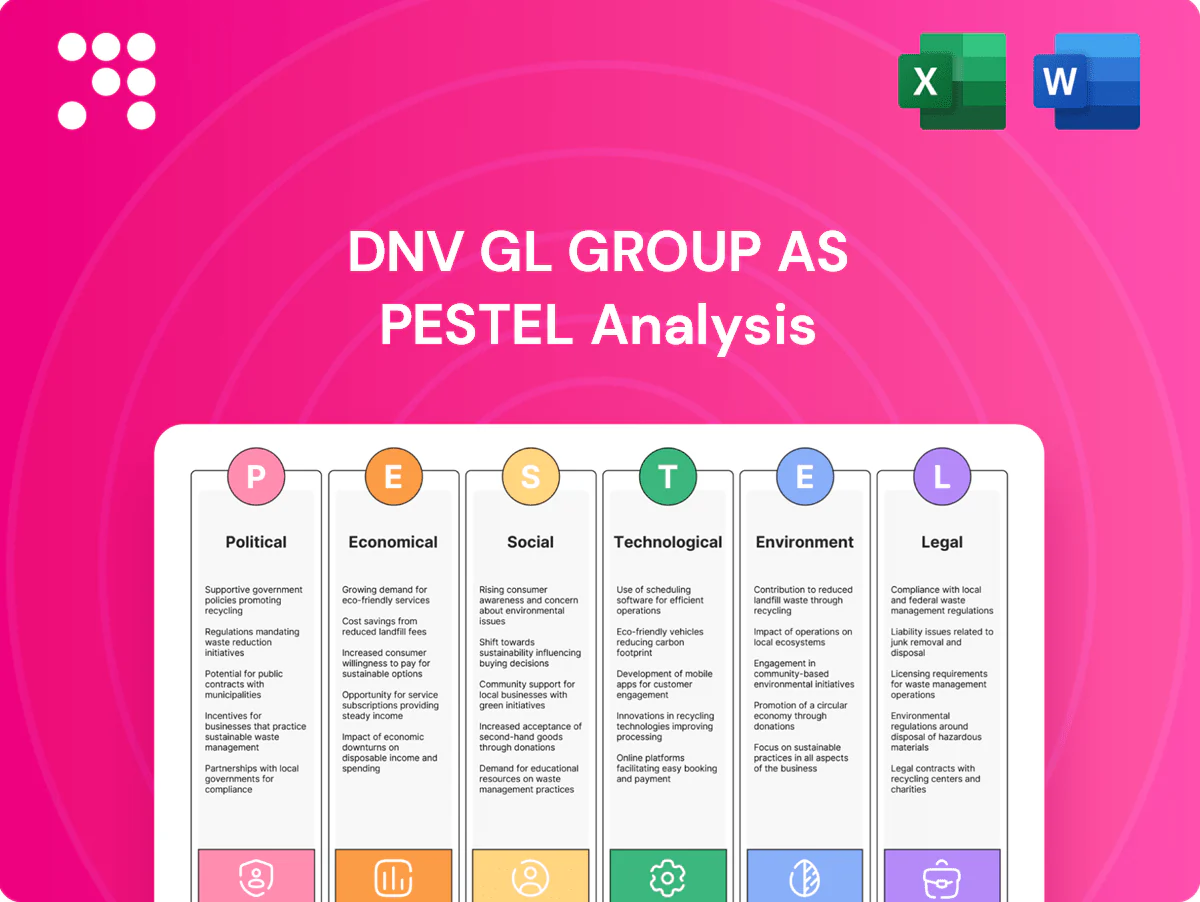
DNV GL Group AS PESTLE Analysis

Your Shortcut to Market Insight Starts Here
Stay ahead with our PESTLE Analysis of DNV GL Group AS—exposing political, economic, social, technological, legal and environmental forces reshaping its markets. Ideal for investors and strategists, this concise briefing reveals risks and growth levers you can act on. Purchase the full, editable report to access the complete insights and actionable recommendations instantly.
Political factors

Geopolitical volatility impacts demand
Geopolitical conflicts, sanctions and trade tensions reshape shipping routes, energy flows and project risk profiles, with around 90% of global trade moved by sea (UNCTAD). DNV’s assurance and advisory demand often surges during such risks, while approvals and site access can stall. A geographically balanced portfolio moderates shocks, and proactive scenario planning plus sanctions compliance are essential.
Maritime policy and IMO mandates
IMO decarbonization rules, targeting at least 50% GHG reduction by 2050 versus 2008, drive demand for classification, alternative-fuel assessment and compliance verification. Timelines and enforcement vary by flag—top 10 flags account for roughly 70% of world tonnage—so uptake is uneven. DNV leverages technical input to influence standards. Clear policy accelerates service adoption and fleet upgrades.

Energy transition subsidies and incentives
Strong government support for offshore wind, hydrogen, CCS and grid modernization is driving demand for DNV GL Group AS certification and project-assurance services, with large-scale offshore pipelines often linked to subsidy frameworks and auctions. Policy reversals or auction redesigns have been shown to delay projects by 12–24 months, disrupting timelines and cashflows. DNV benefits by aligning services to incentive criteria and local tender rules, since country-specific auction requirements demand localized expertise.

Healthcare policy and accreditation regimes
- Regulation-driven demand
- 8.8% OECD health spend (2022)
- DNV enables reimbursement-linked compliance
- Limited cross-border harmonization
EU Green Deal and taxonomy alignment
The EU Green Deal and taxonomy expansion elevate demand for independent verification of ESG, supply chains and lifecycle assessments, driven by the CSRD expanding reporting to about 50,000 companies from 2024. Taxonomy alignment requirements for turnover/CAPEX/OPEX disclosure push corporates toward third‑party assurance; DNV’s credibility positions it strongly in contested classifications. Evolving delegated acts through 2024–25 require agile, auditable methodologies.
- Net‑zero target: EU 2050
- CSRD scope: ~50,000 companies (from 2024)
- Taxonomy: turnover/CAPEX/OPEX alignment disclosures
- Market need: rising third‑party assurance
- DNV: credible differentiator in contentious classifications
Geopolitics, IMO decarbonization and CSRD spike verification and assurance demand
Geopolitical tensions, sanctions and trade shifts (90% trade by sea) raise demand for DNV assurance but can delay access and approvals. IMO decarbonization (50% GHG cut target by 2050 vs 2008) and top‑10 flags covering ~70% tonnage drive uneven compliance needs. EU CSRD (~50,000 firms from 2024) and taxonomy expand verification demand; public funding shifts affect project pipelines.
| Metric | Value |
|---|---|
| Global trade by sea (UNCTAD) | ~90% |
| Top‑10 flags tonnage | ~70% |
| IMO 2050 GHG target | -50% vs 2008 |
| CSRD scope (from 2024) | ~50,000 firms |
| OECD health spend (2022) | 8.8% GDP |
What is included in the product
 Detailed Word Document
Provides a concise PESTLE assessment of DNV GL Group AS, examining Political, Economic, Social, Technological, Environmental and Legal drivers with data-backed trends and industry-specific examples. Designed for executives and advisors, it highlights threats, opportunities and forward-looking implications to inform strategy, risk management and investment decisions.

 Customizable Excel Spreadsheet
A concise, visually segmented PESTLE summary for DNV GL Group AS that streamlines external risk discussions, is easily editable for region or business-line notes, and ready to drop into presentations or share across teams for quick alignment.
Economic factors

Global trade and shipping cycles
Seaborne trade reached about 11.3 billion tonnes in 2024 (UNCTAD), while the global ship orderbook was roughly 7% of the world fleet in 2024 (Clarksons), so freight rates, orderbooks and port throughput directly drive DNV GL classification and inspection volumes; downcycles compress budgets and defer retrofits, upcycles spur newbuilds and upgrades, countercyclical risk services help stabilise revenue, and diversification across vessel types reduces volatility.
Energy price swings and capex
Oil and gas price swings (Brent ~86 USD/bbl in 2024, Henry Hub ~3.1 USD/MMBtu) and volatile power markets (EU day‑ahead averages near 105 EUR/MWh in 2024) drive exploration, grid build and renewables investment; high prices enable safety and integrity capex while lows push clients toward cost optimization. DNV’s advisory offering shifts between growth‑oriented project support and efficiency programs, and long‑dated infrastructure requires stable financing to proceed.

Cost inflation and talent scarcity
Wage inflation (~4% in 2024 per OECD), travel costs (airfares ~15% above 2019 levels per IATA) and subcontractor price rises are raising project costs and squeezing margins. Scarce domain experts—62% of employers reported talent shortages in ManpowerGroup 2024—lengthen delivery timelines. Strong pricing discipline and digital delivery models offset margin pressure. Strategic partnerships and nearshore hubs raise utilization and reduce lead times.

Currency fluctuations
Revenues and costs across multiple currencies expose DNV GL Group AS margins to FX volatility; global FX turnover was about 7.5 trillion USD per day in 2022 (BIS), underscoring market risk. Robust hedging policies, natural offsets and pricing in hard currencies reduce transaction risk, while localized delivery limits translation exposure.
- FX exposure: multi-currency revenues/costs
- Mitigation: hedging + natural offsets
- Pricing: hard currencies to lower risk
- Operations: localization cuts translation impact
Client ESG financing pressures
Access to capital is increasingly tied to verified sustainability performance; by 2024 roughly 60% of large lenders factor ESG into pricing and covenants, and sustainable-linked instruments surpassed an estimated $500bn issuance in 2023. Borrowers demand independent assurance to satisfy lender covenants and SLB/ SLL terms, creating steady demand for verification services. Clear ROI framing—cost of verification versus pricing uplift or covenant compliance—accelerates adoption.
- ESG-linked lending prevalence ~60%
- Sustainable-linked issuance ~ $500bn (2023)
- Verification = compliance + pricing benefit
Geopolitics, IMO decarbonization and CSRD spike verification and assurance demand
Seaborne trade ~11.3bn t (2024) and a 7% orderbook drive classification/inspection volumes; freight cycles and orderbooks swing newbuilds and retrofits. Brent ~86 USD/bbl (2024) and volatile power markets steer energy projects and capex timing. Wage inflation ~4% (2024), FX daily turnover ~7.5tn USD (2022) and ESG‑linked lending ~60% with ~$500bn SLB issuance (2023) shape costs, financing and verification demand.
| Metric | Value | Relevance |
|---|---|---|
| Seaborne trade | 11.3bn t (2024) | Volumes for services |
| Brent | ~86 USD/bbl (2024) | Project capex |
| Wage inflation | ~4% (2024) | Cost pressure |
| ESG lending | ~60%; $500bn (2023) | Verification demand |
Same Document Delivered
DNV GL Group AS PESTLE Analysis
The preview shown here is the exact DNV GL Group AS PESTLE Analysis you’ll receive after purchase—fully formatted, professionally structured, and ready to use. It contains the same content, layout, and insights visible now with no placeholders or surprises. After checkout you’ll instantly download this identical final file.

Your Shortcut to Market Insight Starts Here
Stay ahead with our PESTLE Analysis of DNV GL Group AS—exposing political, economic, social, technological, legal and environmental forces reshaping its markets. Ideal for investors and strategists, this concise briefing reveals risks and growth levers you can act on. Purchase the full, editable report to access the complete insights and actionable recommendations instantly.
Political factors
Geopolitical volatility impacts demand
Geopolitical conflicts, sanctions and trade tensions reshape shipping routes, energy flows and project risk profiles, with around 90% of global trade moved by sea (UNCTAD). DNV’s assurance and advisory demand often surges during such risks, while approvals and site access can stall. A geographically balanced portfolio moderates shocks, and proactive scenario planning plus sanctions compliance are essential.
Maritime policy and IMO mandates
IMO decarbonization rules, targeting at least 50% GHG reduction by 2050 versus 2008, drive demand for classification, alternative-fuel assessment and compliance verification. Timelines and enforcement vary by flag—top 10 flags account for roughly 70% of world tonnage—so uptake is uneven. DNV leverages technical input to influence standards. Clear policy accelerates service adoption and fleet upgrades.
Energy transition subsidies and incentives
Strong government support for offshore wind, hydrogen, CCS and grid modernization is driving demand for DNV GL Group AS certification and project-assurance services, with large-scale offshore pipelines often linked to subsidy frameworks and auctions. Policy reversals or auction redesigns have been shown to delay projects by 12–24 months, disrupting timelines and cashflows. DNV benefits by aligning services to incentive criteria and local tender rules, since country-specific auction requirements demand localized expertise.
Healthcare policy and accreditation regimes
- Regulation-driven demand
- 8.8% OECD health spend (2022)
- DNV enables reimbursement-linked compliance
- Limited cross-border harmonization
EU Green Deal and taxonomy alignment
The EU Green Deal and taxonomy expansion elevate demand for independent verification of ESG, supply chains and lifecycle assessments, driven by the CSRD expanding reporting to about 50,000 companies from 2024. Taxonomy alignment requirements for turnover/CAPEX/OPEX disclosure push corporates toward third‑party assurance; DNV’s credibility positions it strongly in contested classifications. Evolving delegated acts through 2024–25 require agile, auditable methodologies.
- Net‑zero target: EU 2050
- CSRD scope: ~50,000 companies (from 2024)
- Taxonomy: turnover/CAPEX/OPEX alignment disclosures
- Market need: rising third‑party assurance
- DNV: credible differentiator in contentious classifications
Geopolitics, IMO decarbonization and CSRD spike verification and assurance demand
Geopolitical tensions, sanctions and trade shifts (90% trade by sea) raise demand for DNV assurance but can delay access and approvals. IMO decarbonization (50% GHG cut target by 2050 vs 2008) and top‑10 flags covering ~70% tonnage drive uneven compliance needs. EU CSRD (~50,000 firms from 2024) and taxonomy expand verification demand; public funding shifts affect project pipelines.
| Metric | Value |
|---|---|
| Global trade by sea (UNCTAD) | ~90% |
| Top‑10 flags tonnage | ~70% |
| IMO 2050 GHG target | -50% vs 2008 |
| CSRD scope (from 2024) | ~50,000 firms |
| OECD health spend (2022) | 8.8% GDP |
What is included in the product
Detailed Word Document
Provides a concise PESTLE assessment of DNV GL Group AS, examining Political, Economic, Social, Technological, Environmental and Legal drivers with data-backed trends and industry-specific examples. Designed for executives and advisors, it highlights threats, opportunities and forward-looking implications to inform strategy, risk management and investment decisions.
Customizable Excel Spreadsheet
A concise, visually segmented PESTLE summary for DNV GL Group AS that streamlines external risk discussions, is easily editable for region or business-line notes, and ready to drop into presentations or share across teams for quick alignment.
Economic factors
Global trade and shipping cycles
Seaborne trade reached about 11.3 billion tonnes in 2024 (UNCTAD), while the global ship orderbook was roughly 7% of the world fleet in 2024 (Clarksons), so freight rates, orderbooks and port throughput directly drive DNV GL classification and inspection volumes; downcycles compress budgets and defer retrofits, upcycles spur newbuilds and upgrades, countercyclical risk services help stabilise revenue, and diversification across vessel types reduces volatility.
Energy price swings and capex
Oil and gas price swings (Brent ~86 USD/bbl in 2024, Henry Hub ~3.1 USD/MMBtu) and volatile power markets (EU day‑ahead averages near 105 EUR/MWh in 2024) drive exploration, grid build and renewables investment; high prices enable safety and integrity capex while lows push clients toward cost optimization. DNV’s advisory offering shifts between growth‑oriented project support and efficiency programs, and long‑dated infrastructure requires stable financing to proceed.
Cost inflation and talent scarcity
Wage inflation (~4% in 2024 per OECD), travel costs (airfares ~15% above 2019 levels per IATA) and subcontractor price rises are raising project costs and squeezing margins. Scarce domain experts—62% of employers reported talent shortages in ManpowerGroup 2024—lengthen delivery timelines. Strong pricing discipline and digital delivery models offset margin pressure. Strategic partnerships and nearshore hubs raise utilization and reduce lead times.
Currency fluctuations
Revenues and costs across multiple currencies expose DNV GL Group AS margins to FX volatility; global FX turnover was about 7.5 trillion USD per day in 2022 (BIS), underscoring market risk. Robust hedging policies, natural offsets and pricing in hard currencies reduce transaction risk, while localized delivery limits translation exposure.
- FX exposure: multi-currency revenues/costs
- Mitigation: hedging + natural offsets
- Pricing: hard currencies to lower risk
- Operations: localization cuts translation impact
Client ESG financing pressures
Access to capital is increasingly tied to verified sustainability performance; by 2024 roughly 60% of large lenders factor ESG into pricing and covenants, and sustainable-linked instruments surpassed an estimated $500bn issuance in 2023. Borrowers demand independent assurance to satisfy lender covenants and SLB/ SLL terms, creating steady demand for verification services. Clear ROI framing—cost of verification versus pricing uplift or covenant compliance—accelerates adoption.
- ESG-linked lending prevalence ~60%
- Sustainable-linked issuance ~ $500bn (2023)
- Verification = compliance + pricing benefit
Geopolitics, IMO decarbonization and CSRD spike verification and assurance demand
Seaborne trade ~11.3bn t (2024) and a 7% orderbook drive classification/inspection volumes; freight cycles and orderbooks swing newbuilds and retrofits. Brent ~86 USD/bbl (2024) and volatile power markets steer energy projects and capex timing. Wage inflation ~4% (2024), FX daily turnover ~7.5tn USD (2022) and ESG‑linked lending ~60% with ~$500bn SLB issuance (2023) shape costs, financing and verification demand.
| Metric | Value | Relevance |
|---|---|---|
| Seaborne trade | 11.3bn t (2024) | Volumes for services |
| Brent | ~86 USD/bbl (2024) | Project capex |
| Wage inflation | ~4% (2024) | Cost pressure |
| ESG lending | ~60%; $500bn (2023) | Verification demand |
Same Document Delivered
DNV GL Group AS PESTLE Analysis
The preview shown here is the exact DNV GL Group AS PESTLE Analysis you’ll receive after purchase—fully formatted, professionally structured, and ready to use. It contains the same content, layout, and insights visible now with no placeholders or surprises. After checkout you’ll instantly download this identical final file.
Original: $10.00
-65%$10.00
$3.50Description
Your Shortcut to Market Insight Starts Here
Stay ahead with our PESTLE Analysis of DNV GL Group AS—exposing political, economic, social, technological, legal and environmental forces reshaping its markets. Ideal for investors and strategists, this concise briefing reveals risks and growth levers you can act on. Purchase the full, editable report to access the complete insights and actionable recommendations instantly.
Political factors
Geopolitical volatility impacts demand
Geopolitical conflicts, sanctions and trade tensions reshape shipping routes, energy flows and project risk profiles, with around 90% of global trade moved by sea (UNCTAD). DNV’s assurance and advisory demand often surges during such risks, while approvals and site access can stall. A geographically balanced portfolio moderates shocks, and proactive scenario planning plus sanctions compliance are essential.
Maritime policy and IMO mandates
IMO decarbonization rules, targeting at least 50% GHG reduction by 2050 versus 2008, drive demand for classification, alternative-fuel assessment and compliance verification. Timelines and enforcement vary by flag—top 10 flags account for roughly 70% of world tonnage—so uptake is uneven. DNV leverages technical input to influence standards. Clear policy accelerates service adoption and fleet upgrades.
Energy transition subsidies and incentives
Strong government support for offshore wind, hydrogen, CCS and grid modernization is driving demand for DNV GL Group AS certification and project-assurance services, with large-scale offshore pipelines often linked to subsidy frameworks and auctions. Policy reversals or auction redesigns have been shown to delay projects by 12–24 months, disrupting timelines and cashflows. DNV benefits by aligning services to incentive criteria and local tender rules, since country-specific auction requirements demand localized expertise.
Healthcare policy and accreditation regimes
- Regulation-driven demand
- 8.8% OECD health spend (2022)
- DNV enables reimbursement-linked compliance
- Limited cross-border harmonization
EU Green Deal and taxonomy alignment
The EU Green Deal and taxonomy expansion elevate demand for independent verification of ESG, supply chains and lifecycle assessments, driven by the CSRD expanding reporting to about 50,000 companies from 2024. Taxonomy alignment requirements for turnover/CAPEX/OPEX disclosure push corporates toward third‑party assurance; DNV’s credibility positions it strongly in contested classifications. Evolving delegated acts through 2024–25 require agile, auditable methodologies.
- Net‑zero target: EU 2050
- CSRD scope: ~50,000 companies (from 2024)
- Taxonomy: turnover/CAPEX/OPEX alignment disclosures
- Market need: rising third‑party assurance
- DNV: credible differentiator in contentious classifications
Geopolitics, IMO decarbonization and CSRD spike verification and assurance demand
Geopolitical tensions, sanctions and trade shifts (90% trade by sea) raise demand for DNV assurance but can delay access and approvals. IMO decarbonization (50% GHG cut target by 2050 vs 2008) and top‑10 flags covering ~70% tonnage drive uneven compliance needs. EU CSRD (~50,000 firms from 2024) and taxonomy expand verification demand; public funding shifts affect project pipelines.
| Metric | Value |
|---|---|
| Global trade by sea (UNCTAD) | ~90% |
| Top‑10 flags tonnage | ~70% |
| IMO 2050 GHG target | -50% vs 2008 |
| CSRD scope (from 2024) | ~50,000 firms |
| OECD health spend (2022) | 8.8% GDP |
What is included in the product
Detailed Word Document
Provides a concise PESTLE assessment of DNV GL Group AS, examining Political, Economic, Social, Technological, Environmental and Legal drivers with data-backed trends and industry-specific examples. Designed for executives and advisors, it highlights threats, opportunities and forward-looking implications to inform strategy, risk management and investment decisions.
Customizable Excel Spreadsheet
A concise, visually segmented PESTLE summary for DNV GL Group AS that streamlines external risk discussions, is easily editable for region or business-line notes, and ready to drop into presentations or share across teams for quick alignment.
Economic factors
Global trade and shipping cycles
Seaborne trade reached about 11.3 billion tonnes in 2024 (UNCTAD), while the global ship orderbook was roughly 7% of the world fleet in 2024 (Clarksons), so freight rates, orderbooks and port throughput directly drive DNV GL classification and inspection volumes; downcycles compress budgets and defer retrofits, upcycles spur newbuilds and upgrades, countercyclical risk services help stabilise revenue, and diversification across vessel types reduces volatility.
Energy price swings and capex
Oil and gas price swings (Brent ~86 USD/bbl in 2024, Henry Hub ~3.1 USD/MMBtu) and volatile power markets (EU day‑ahead averages near 105 EUR/MWh in 2024) drive exploration, grid build and renewables investment; high prices enable safety and integrity capex while lows push clients toward cost optimization. DNV’s advisory offering shifts between growth‑oriented project support and efficiency programs, and long‑dated infrastructure requires stable financing to proceed.
Cost inflation and talent scarcity
Wage inflation (~4% in 2024 per OECD), travel costs (airfares ~15% above 2019 levels per IATA) and subcontractor price rises are raising project costs and squeezing margins. Scarce domain experts—62% of employers reported talent shortages in ManpowerGroup 2024—lengthen delivery timelines. Strong pricing discipline and digital delivery models offset margin pressure. Strategic partnerships and nearshore hubs raise utilization and reduce lead times.
Currency fluctuations
Revenues and costs across multiple currencies expose DNV GL Group AS margins to FX volatility; global FX turnover was about 7.5 trillion USD per day in 2022 (BIS), underscoring market risk. Robust hedging policies, natural offsets and pricing in hard currencies reduce transaction risk, while localized delivery limits translation exposure.
- FX exposure: multi-currency revenues/costs
- Mitigation: hedging + natural offsets
- Pricing: hard currencies to lower risk
- Operations: localization cuts translation impact
Client ESG financing pressures
Access to capital is increasingly tied to verified sustainability performance; by 2024 roughly 60% of large lenders factor ESG into pricing and covenants, and sustainable-linked instruments surpassed an estimated $500bn issuance in 2023. Borrowers demand independent assurance to satisfy lender covenants and SLB/ SLL terms, creating steady demand for verification services. Clear ROI framing—cost of verification versus pricing uplift or covenant compliance—accelerates adoption.
- ESG-linked lending prevalence ~60%
- Sustainable-linked issuance ~ $500bn (2023)
- Verification = compliance + pricing benefit
Geopolitics, IMO decarbonization and CSRD spike verification and assurance demand
Seaborne trade ~11.3bn t (2024) and a 7% orderbook drive classification/inspection volumes; freight cycles and orderbooks swing newbuilds and retrofits. Brent ~86 USD/bbl (2024) and volatile power markets steer energy projects and capex timing. Wage inflation ~4% (2024), FX daily turnover ~7.5tn USD (2022) and ESG‑linked lending ~60% with ~$500bn SLB issuance (2023) shape costs, financing and verification demand.
| Metric | Value | Relevance |
|---|---|---|
| Seaborne trade | 11.3bn t (2024) | Volumes for services |
| Brent | ~86 USD/bbl (2024) | Project capex |
| Wage inflation | ~4% (2024) | Cost pressure |
| ESG lending | ~60%; $500bn (2023) | Verification demand |
Same Document Delivered
DNV GL Group AS PESTLE Analysis
The preview shown here is the exact DNV GL Group AS PESTLE Analysis you’ll receive after purchase—fully formatted, professionally structured, and ready to use. It contains the same content, layout, and insights visible now with no placeholders or surprises. After checkout you’ll instantly download this identical final file.











