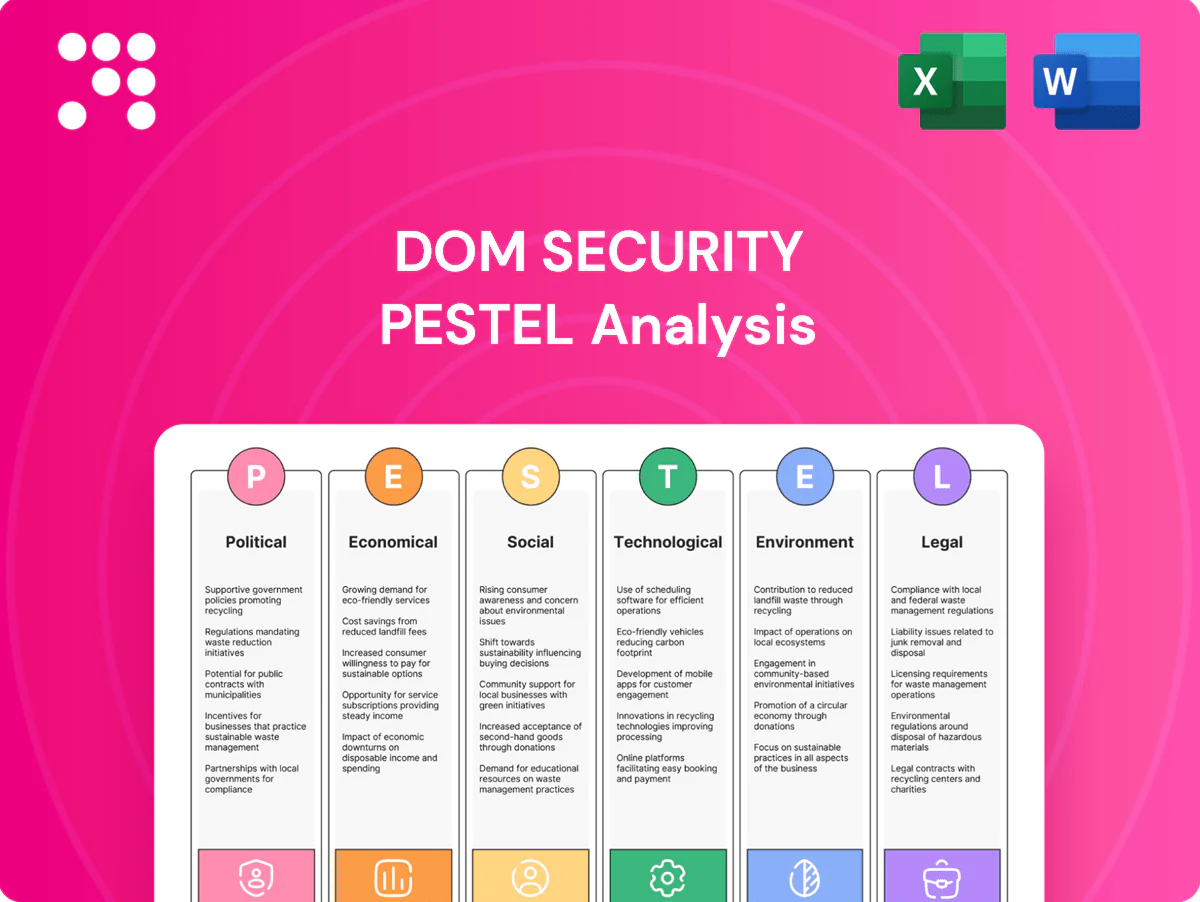
DOM Security PESTLE Analysis

Your Shortcut to Market Insight Starts Here
Discover how political shifts, economic trends, and tech advances are reshaping DOM Security’s outlook in our concise PESTLE snapshot; perfect for investors and strategists. This expert analysis highlights risks and growth levers—buy the full PESTLE for the complete, actionable insights you need.
Political factors

Public safety and security priorities
Governments are increasing funding for crime prevention and critical infrastructure protection, boosting demand for advanced access control; the global physical security market was valued at about USD 121 billion in 2023 and remains on a multi-year growth trajectory. Public mandates for safer schools, hospitals and transport hubs favor certified, integrated systems and drive public-sector tenders. DOM Security can align offerings with national security strategies to capture these contracts, but political leadership changes can reallocate budgets and delay projects.
Smart city and digitalization agendas
Smart city programs drive adoption of connected buildings and IoT-enabled access management, with municipal pilots shaping standards and referenceability. Grants and PPPs accelerate deployments—EU Digital Europe allocates €7.5 billion for digital transition (2021–2027) and India’s Smart Cities Mission targets 100 cities. Participation in pilots boosts procurement pipelines and interoperability influence. Delays or cancellations of flagship projects create material pipeline risk.

Government procurement and localization
Buy-local policies and strict vendor qualification requirements shape access to public contracts, with public procurement accounting for about 14% of global GDP (UNCTAD). Meeting country-specific certifications and security clearances is essential for eligibility and timeliness. Establishing local manufacturing or partnerships materially improves win rates, while protectionist measures often raise costs and complicate cross-border fulfillment.

Geopolitical supply chain stability
Trade tensions and export controls since 2022 have targeted semiconductors and secure elements, constraining component availability; Taiwan accounts for roughly 60% of advanced foundry capacity and semiconductor lead times spiked to 20+ weeks, stalling installations and service SLAs. Diversified sourcing, regional inventories, political risk insurance and scenario planning are now strategic necessities.
- Trade/sanctions impact: semiconductors, secure elements
- Concentration risk: ~60% advanced foundry capacity in Taiwan
- Lead-time volatility: 20+ weeks at peak, stalling SLAs
- Mitigants: diversification, regional stocks, political-risk insurance, scenario planning
Cybersecurity sovereignty and data residency
Cybersecurity sovereignty and data residency mean 60+ countries now impose in-country data storage and some, including China and Russia, require state-certified cryptography for security systems; cloud-based access control must be rearchitected to meet local sovereignty rules. Compliance often determines eligibility for government and regulated-sector deals (EU public procurement ~€2 trillion/year); non-compliance risks exclusion from strategic markets.
- data_localization: 60+ countries
- certified_crypto: China, Russia examples
- cloud_adaptation: mandatory per-jurisdiction
- gov_procurement_impact: EU ≈ €2T/yr
- risk: market exclusion if non-compliant
Govt security spending rises - USD 121B market; data-sovereignty and Taiwan foundry risk
Governments boost funding for crime prevention and critical infrastructure; global physical security market ≈ USD 121B (2023). Smart-city and PPP programs (EU Digital Europe €7.5B; India Smart Cities) expand municipal pipelines but political shifts can delay tenders. Buy-local and data-sovereignty (60+ countries) plus export controls (≈60% advanced foundry capacity in Taiwan) shape sourcing and eligibility.
| Factor | Key metric | Impact |
|---|---|---|
| Market | USD 121B (2023) | Revenue growth |
| Data sovereignty | 60+ countries | Procurement eligibility |
| Supply | ~60% foundry Taiwan | Lead‑time risk |
| EU procurement | ≈€2T/yr | Public contract size |
What is included in the product
 Detailed Word Document
Explores how Political, Economic, Social, Technological, Environmental and Legal forces uniquely impact DOM Security, with data‑backed, region‑specific subpoints and forward‑looking insights to inform risk mitigation, strategic planning and investor communications.

 Customizable Excel Spreadsheet
A concise, visually segmented DOM Security PESTLE summary that relieves pain by clarifying external risks for quick meeting reference, editable for local context and easily shared across teams for faster alignment and decision-making.
Economic factors

Construction and retrofit cycles
New-build and renovation activity directly drives hardware and system demand; global construction output was about $12 trillion in 2024, underpinning significant security spend. Retrofits increasingly favor electromechanical upgrades and SaaS access control, with cloud-based systems forming a growing share of projects. Market downturns push buyers to incremental, modular investments, so pipeline diversification across commercial, healthcare, education and industrial segments smooths cyclicality.
Interest rates and capital availability
Higher interest rates—about a 300 bps rise in global lending costs since 2020—have pressured capex-heavy security deployments and stretched sales cycles. OpEx-friendly subscription models have preserved momentum, with recurring revenue shares rising across peers by ~15–25%. Leasing and performance-based contracts improve affordability and lower upfront churn. Rate cuts would quickly reaccelerate large integrated rollouts as financing costs fall.

Input costs and component availability
Price swings in metals, electronics, and batteries compress DOM Security margins as raw-material volatility raises BOM costs. Secure chips and controllers often attract scarcity premiums, increasing procurement expenses and time-to-market risk. Design-to-cost and multi-sourcing protect profitability by enabling component substitutions and competitive bidding. Strategic inventory buffers and close vendor partnerships stabilize delivery and reduce supply-chain shocks.

Currency fluctuations in export markets
FX volatility in export markets directly alters pricing, competitiveness, and reported earnings—typical FX swings of around 10% can materially shift margins on export contracts. Localized pricing and natural hedges (revenues and costs in the same currency) reduce exposure, while financial hedging (for example forward contracts or options) protects large project margins. Transparent escalation clauses tied to FX or input indices manage multi-year project timelines and preserve cash flow predictability.
- FX impact: pricing, competitiveness, reported earnings
- Mitigants: localized pricing, natural hedges
- Protection: financial hedging for large projects
- Contract design: transparent escalation clauses
Shift to recurring revenue
- cloud access control: +25% YoY adoption 2023–24
- credential subscriptions & maintenance: higher gross retention
- bundled SLAs: raise LTV and reduce churn
- investor preference: premium for predictable ARR
Govt security spending rises - USD 121B market; data-sovereignty and Taiwan foundry risk
Construction spend (~$12T in 2024) drives hardware/system demand while retrofit SaaS access control grows (~+25% YoY 2023–24). Higher rates (~+300 bps since 2020) pressure capex; subscription OpEx models raised recurring revenue shares ~15–25%. Raw-material and FX volatility (typical swings ~10%) compress margins; hedging, multi-sourcing and escalation clauses mitigate risk.
| Metric | Value |
|---|---|
| Global construction | $12T (2024) |
| Cloud adoption | +25% YoY (23–24) |
| Rate shift | +300 bps since 2020 |
| FX swings | ~10% typical |
Same Document Delivered
DOM Security PESTLE Analysis
The preview shown here is the exact DOM Security PESTLE Analysis you’ll receive after purchase—fully formatted, professionally structured, and ready to use. The layout, content, and structure visible here are identical to the downloadable file you get at checkout. No placeholders or teasers—this is the finished report you’ll own instantly after payment.

Your Shortcut to Market Insight Starts Here
Discover how political shifts, economic trends, and tech advances are reshaping DOM Security’s outlook in our concise PESTLE snapshot; perfect for investors and strategists. This expert analysis highlights risks and growth levers—buy the full PESTLE for the complete, actionable insights you need.
Political factors
Public safety and security priorities
Governments are increasing funding for crime prevention and critical infrastructure protection, boosting demand for advanced access control; the global physical security market was valued at about USD 121 billion in 2023 and remains on a multi-year growth trajectory. Public mandates for safer schools, hospitals and transport hubs favor certified, integrated systems and drive public-sector tenders. DOM Security can align offerings with national security strategies to capture these contracts, but political leadership changes can reallocate budgets and delay projects.
Smart city and digitalization agendas
Smart city programs drive adoption of connected buildings and IoT-enabled access management, with municipal pilots shaping standards and referenceability. Grants and PPPs accelerate deployments—EU Digital Europe allocates €7.5 billion for digital transition (2021–2027) and India’s Smart Cities Mission targets 100 cities. Participation in pilots boosts procurement pipelines and interoperability influence. Delays or cancellations of flagship projects create material pipeline risk.
Government procurement and localization
Buy-local policies and strict vendor qualification requirements shape access to public contracts, with public procurement accounting for about 14% of global GDP (UNCTAD). Meeting country-specific certifications and security clearances is essential for eligibility and timeliness. Establishing local manufacturing or partnerships materially improves win rates, while protectionist measures often raise costs and complicate cross-border fulfillment.
Geopolitical supply chain stability
Trade tensions and export controls since 2022 have targeted semiconductors and secure elements, constraining component availability; Taiwan accounts for roughly 60% of advanced foundry capacity and semiconductor lead times spiked to 20+ weeks, stalling installations and service SLAs. Diversified sourcing, regional inventories, political risk insurance and scenario planning are now strategic necessities.
- Trade/sanctions impact: semiconductors, secure elements
- Concentration risk: ~60% advanced foundry capacity in Taiwan
- Lead-time volatility: 20+ weeks at peak, stalling SLAs
- Mitigants: diversification, regional stocks, political-risk insurance, scenario planning
Cybersecurity sovereignty and data residency
Cybersecurity sovereignty and data residency mean 60+ countries now impose in-country data storage and some, including China and Russia, require state-certified cryptography for security systems; cloud-based access control must be rearchitected to meet local sovereignty rules. Compliance often determines eligibility for government and regulated-sector deals (EU public procurement ~€2 trillion/year); non-compliance risks exclusion from strategic markets.
- data_localization: 60+ countries
- certified_crypto: China, Russia examples
- cloud_adaptation: mandatory per-jurisdiction
- gov_procurement_impact: EU ≈ €2T/yr
- risk: market exclusion if non-compliant
Govt security spending rises - USD 121B market; data-sovereignty and Taiwan foundry risk
Governments boost funding for crime prevention and critical infrastructure; global physical security market ≈ USD 121B (2023). Smart-city and PPP programs (EU Digital Europe €7.5B; India Smart Cities) expand municipal pipelines but political shifts can delay tenders. Buy-local and data-sovereignty (60+ countries) plus export controls (≈60% advanced foundry capacity in Taiwan) shape sourcing and eligibility.
| Factor | Key metric | Impact |
|---|---|---|
| Market | USD 121B (2023) | Revenue growth |
| Data sovereignty | 60+ countries | Procurement eligibility |
| Supply | ~60% foundry Taiwan | Lead‑time risk |
| EU procurement | ≈€2T/yr | Public contract size |
What is included in the product
Detailed Word Document
Explores how Political, Economic, Social, Technological, Environmental and Legal forces uniquely impact DOM Security, with data‑backed, region‑specific subpoints and forward‑looking insights to inform risk mitigation, strategic planning and investor communications.
Customizable Excel Spreadsheet
A concise, visually segmented DOM Security PESTLE summary that relieves pain by clarifying external risks for quick meeting reference, editable for local context and easily shared across teams for faster alignment and decision-making.
Economic factors
Construction and retrofit cycles
New-build and renovation activity directly drives hardware and system demand; global construction output was about $12 trillion in 2024, underpinning significant security spend. Retrofits increasingly favor electromechanical upgrades and SaaS access control, with cloud-based systems forming a growing share of projects. Market downturns push buyers to incremental, modular investments, so pipeline diversification across commercial, healthcare, education and industrial segments smooths cyclicality.
Interest rates and capital availability
Higher interest rates—about a 300 bps rise in global lending costs since 2020—have pressured capex-heavy security deployments and stretched sales cycles. OpEx-friendly subscription models have preserved momentum, with recurring revenue shares rising across peers by ~15–25%. Leasing and performance-based contracts improve affordability and lower upfront churn. Rate cuts would quickly reaccelerate large integrated rollouts as financing costs fall.
Input costs and component availability
Price swings in metals, electronics, and batteries compress DOM Security margins as raw-material volatility raises BOM costs. Secure chips and controllers often attract scarcity premiums, increasing procurement expenses and time-to-market risk. Design-to-cost and multi-sourcing protect profitability by enabling component substitutions and competitive bidding. Strategic inventory buffers and close vendor partnerships stabilize delivery and reduce supply-chain shocks.
Currency fluctuations in export markets
FX volatility in export markets directly alters pricing, competitiveness, and reported earnings—typical FX swings of around 10% can materially shift margins on export contracts. Localized pricing and natural hedges (revenues and costs in the same currency) reduce exposure, while financial hedging (for example forward contracts or options) protects large project margins. Transparent escalation clauses tied to FX or input indices manage multi-year project timelines and preserve cash flow predictability.
- FX impact: pricing, competitiveness, reported earnings
- Mitigants: localized pricing, natural hedges
- Protection: financial hedging for large projects
- Contract design: transparent escalation clauses
Shift to recurring revenue
- cloud access control: +25% YoY adoption 2023–24
- credential subscriptions & maintenance: higher gross retention
- bundled SLAs: raise LTV and reduce churn
- investor preference: premium for predictable ARR
Govt security spending rises - USD 121B market; data-sovereignty and Taiwan foundry risk
Construction spend (~$12T in 2024) drives hardware/system demand while retrofit SaaS access control grows (~+25% YoY 2023–24). Higher rates (~+300 bps since 2020) pressure capex; subscription OpEx models raised recurring revenue shares ~15–25%. Raw-material and FX volatility (typical swings ~10%) compress margins; hedging, multi-sourcing and escalation clauses mitigate risk.
| Metric | Value |
|---|---|
| Global construction | $12T (2024) |
| Cloud adoption | +25% YoY (23–24) |
| Rate shift | +300 bps since 2020 |
| FX swings | ~10% typical |
Same Document Delivered
DOM Security PESTLE Analysis
The preview shown here is the exact DOM Security PESTLE Analysis you’ll receive after purchase—fully formatted, professionally structured, and ready to use. The layout, content, and structure visible here are identical to the downloadable file you get at checkout. No placeholders or teasers—this is the finished report you’ll own instantly after payment.
Original: $10.00
-65%$10.00
$3.50Description
Your Shortcut to Market Insight Starts Here
Discover how political shifts, economic trends, and tech advances are reshaping DOM Security’s outlook in our concise PESTLE snapshot; perfect for investors and strategists. This expert analysis highlights risks and growth levers—buy the full PESTLE for the complete, actionable insights you need.
Political factors
Public safety and security priorities
Governments are increasing funding for crime prevention and critical infrastructure protection, boosting demand for advanced access control; the global physical security market was valued at about USD 121 billion in 2023 and remains on a multi-year growth trajectory. Public mandates for safer schools, hospitals and transport hubs favor certified, integrated systems and drive public-sector tenders. DOM Security can align offerings with national security strategies to capture these contracts, but political leadership changes can reallocate budgets and delay projects.
Smart city and digitalization agendas
Smart city programs drive adoption of connected buildings and IoT-enabled access management, with municipal pilots shaping standards and referenceability. Grants and PPPs accelerate deployments—EU Digital Europe allocates €7.5 billion for digital transition (2021–2027) and India’s Smart Cities Mission targets 100 cities. Participation in pilots boosts procurement pipelines and interoperability influence. Delays or cancellations of flagship projects create material pipeline risk.
Government procurement and localization
Buy-local policies and strict vendor qualification requirements shape access to public contracts, with public procurement accounting for about 14% of global GDP (UNCTAD). Meeting country-specific certifications and security clearances is essential for eligibility and timeliness. Establishing local manufacturing or partnerships materially improves win rates, while protectionist measures often raise costs and complicate cross-border fulfillment.
Geopolitical supply chain stability
Trade tensions and export controls since 2022 have targeted semiconductors and secure elements, constraining component availability; Taiwan accounts for roughly 60% of advanced foundry capacity and semiconductor lead times spiked to 20+ weeks, stalling installations and service SLAs. Diversified sourcing, regional inventories, political risk insurance and scenario planning are now strategic necessities.
- Trade/sanctions impact: semiconductors, secure elements
- Concentration risk: ~60% advanced foundry capacity in Taiwan
- Lead-time volatility: 20+ weeks at peak, stalling SLAs
- Mitigants: diversification, regional stocks, political-risk insurance, scenario planning
Cybersecurity sovereignty and data residency
Cybersecurity sovereignty and data residency mean 60+ countries now impose in-country data storage and some, including China and Russia, require state-certified cryptography for security systems; cloud-based access control must be rearchitected to meet local sovereignty rules. Compliance often determines eligibility for government and regulated-sector deals (EU public procurement ~€2 trillion/year); non-compliance risks exclusion from strategic markets.
- data_localization: 60+ countries
- certified_crypto: China, Russia examples
- cloud_adaptation: mandatory per-jurisdiction
- gov_procurement_impact: EU ≈ €2T/yr
- risk: market exclusion if non-compliant
Govt security spending rises - USD 121B market; data-sovereignty and Taiwan foundry risk
Governments boost funding for crime prevention and critical infrastructure; global physical security market ≈ USD 121B (2023). Smart-city and PPP programs (EU Digital Europe €7.5B; India Smart Cities) expand municipal pipelines but political shifts can delay tenders. Buy-local and data-sovereignty (60+ countries) plus export controls (≈60% advanced foundry capacity in Taiwan) shape sourcing and eligibility.
| Factor | Key metric | Impact |
|---|---|---|
| Market | USD 121B (2023) | Revenue growth |
| Data sovereignty | 60+ countries | Procurement eligibility |
| Supply | ~60% foundry Taiwan | Lead‑time risk |
| EU procurement | ≈€2T/yr | Public contract size |
What is included in the product
Detailed Word Document
Explores how Political, Economic, Social, Technological, Environmental and Legal forces uniquely impact DOM Security, with data‑backed, region‑specific subpoints and forward‑looking insights to inform risk mitigation, strategic planning and investor communications.
Customizable Excel Spreadsheet
A concise, visually segmented DOM Security PESTLE summary that relieves pain by clarifying external risks for quick meeting reference, editable for local context and easily shared across teams for faster alignment and decision-making.
Economic factors
Construction and retrofit cycles
New-build and renovation activity directly drives hardware and system demand; global construction output was about $12 trillion in 2024, underpinning significant security spend. Retrofits increasingly favor electromechanical upgrades and SaaS access control, with cloud-based systems forming a growing share of projects. Market downturns push buyers to incremental, modular investments, so pipeline diversification across commercial, healthcare, education and industrial segments smooths cyclicality.
Interest rates and capital availability
Higher interest rates—about a 300 bps rise in global lending costs since 2020—have pressured capex-heavy security deployments and stretched sales cycles. OpEx-friendly subscription models have preserved momentum, with recurring revenue shares rising across peers by ~15–25%. Leasing and performance-based contracts improve affordability and lower upfront churn. Rate cuts would quickly reaccelerate large integrated rollouts as financing costs fall.
Input costs and component availability
Price swings in metals, electronics, and batteries compress DOM Security margins as raw-material volatility raises BOM costs. Secure chips and controllers often attract scarcity premiums, increasing procurement expenses and time-to-market risk. Design-to-cost and multi-sourcing protect profitability by enabling component substitutions and competitive bidding. Strategic inventory buffers and close vendor partnerships stabilize delivery and reduce supply-chain shocks.
Currency fluctuations in export markets
FX volatility in export markets directly alters pricing, competitiveness, and reported earnings—typical FX swings of around 10% can materially shift margins on export contracts. Localized pricing and natural hedges (revenues and costs in the same currency) reduce exposure, while financial hedging (for example forward contracts or options) protects large project margins. Transparent escalation clauses tied to FX or input indices manage multi-year project timelines and preserve cash flow predictability.
- FX impact: pricing, competitiveness, reported earnings
- Mitigants: localized pricing, natural hedges
- Protection: financial hedging for large projects
- Contract design: transparent escalation clauses
Shift to recurring revenue
- cloud access control: +25% YoY adoption 2023–24
- credential subscriptions & maintenance: higher gross retention
- bundled SLAs: raise LTV and reduce churn
- investor preference: premium for predictable ARR
Govt security spending rises - USD 121B market; data-sovereignty and Taiwan foundry risk
Construction spend (~$12T in 2024) drives hardware/system demand while retrofit SaaS access control grows (~+25% YoY 2023–24). Higher rates (~+300 bps since 2020) pressure capex; subscription OpEx models raised recurring revenue shares ~15–25%. Raw-material and FX volatility (typical swings ~10%) compress margins; hedging, multi-sourcing and escalation clauses mitigate risk.
| Metric | Value |
|---|---|
| Global construction | $12T (2024) |
| Cloud adoption | +25% YoY (23–24) |
| Rate shift | +300 bps since 2020 |
| FX swings | ~10% typical |
Same Document Delivered
DOM Security PESTLE Analysis
The preview shown here is the exact DOM Security PESTLE Analysis you’ll receive after purchase—fully formatted, professionally structured, and ready to use. The layout, content, and structure visible here are identical to the downloadable file you get at checkout. No placeholders or teasers—this is the finished report you’ll own instantly after payment.











