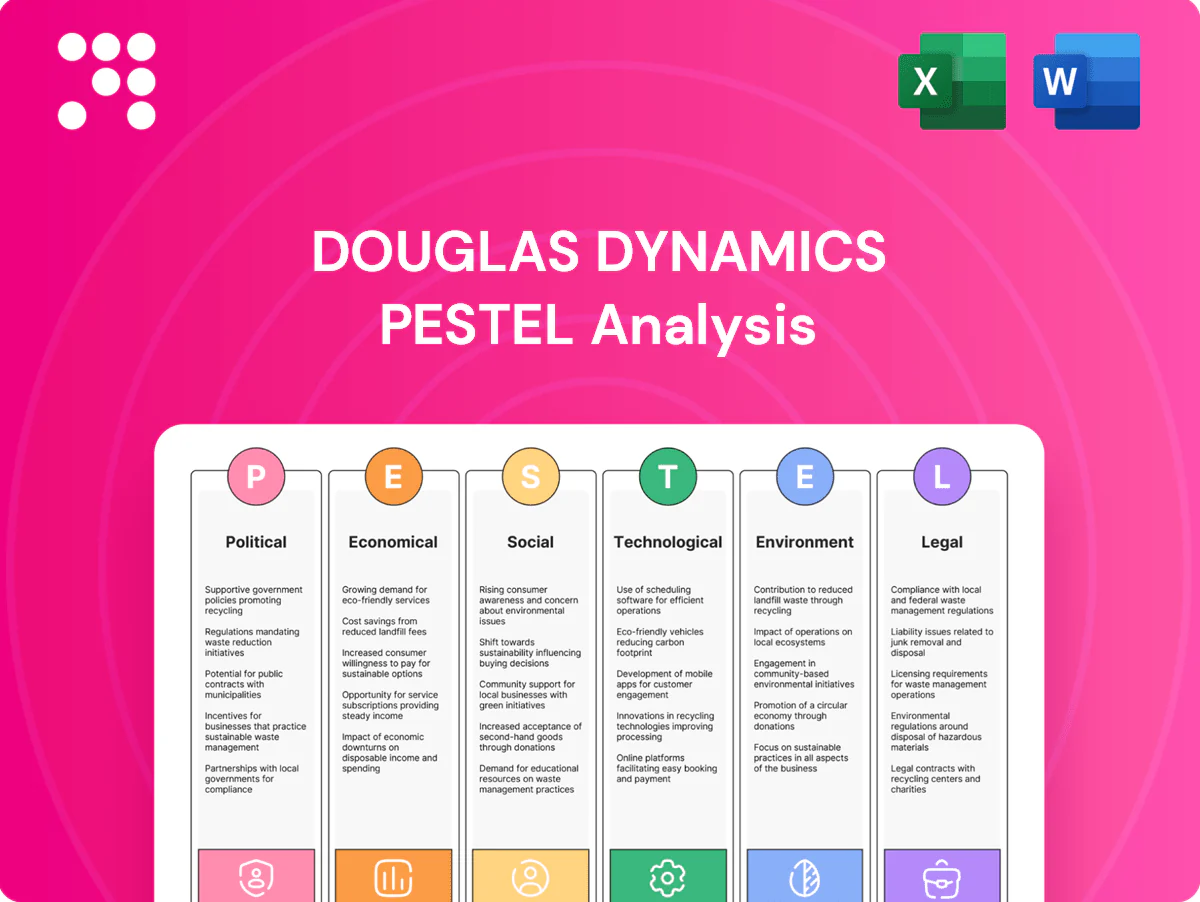
Douglas Dynamics PESTLE Analysis

Your Competitive Advantage Starts with This Report
Uncover how political shifts, economic cycles, and tech advances are shaping Douglas Dynamics with our concise PESTLE overview—three to five actionable insights ready to inform strategy and investment decisions. Purchase the full, editable PESTLE report for a complete breakdown and instant download.
Political factors

Municipal budget cycles
City and state budget approvals, often tied to fiscal year-ends like June 30, drive bulk purchases of plows and spreaders for Douglas Dynamics; election-year priorities frequently reallocate funds away from or toward winter maintenance. The 2021 Bipartisan Infrastructure Law (IIJA) of about 1.2 trillion dollars has unlocked matching funds for fleet upgrades, while federal or state appropriations delays can push municipal orders into later seasons.
Trade policy and tariffs
Tariffs imposed in 2018—25% on steel and 10% on aluminum—continue to push up input costs for Douglas Dynamics, compressing margins and raising pricing pressure. USMCA, effective July 1, 2020, and ongoing US-China trade tensions can disrupt sourcing of components. The Build America, Buy America Act (Nov 2021) tightens federal procurement domestic-content rules. Policy volatility forces hedging and supplier diversification.

Infrastructure and transportation policy
Federal infrastructure spending via the 2021 IIJA, which includes roughly 550 billion dollars of new investment, directly increases demand for snow-control equipment as roads and logistics networks expand. Designated priority corridors and state winter-service mandates raise equipment utilization and replacement cycles. Growth in public-private partnerships creates opportunities for bundled fleet contracts. Regulatory emphasis on resilience is driving higher winter readiness budgets at state and local levels.

Regional governance and snow response mandates
States and provinces set service-level standards for snow clearance that define priority routes and lane-mile targets. Mandated response times force municipalities and contractors to increase fleets and procurement budgets. Funding formulas tied to snowfall zones shift Douglas Dynamics sales toward high-snow regions. Inter-agency coordination and cooperative contracts centralize procurement for thousands of agencies.
- service-standards
- response-time-driven fleets
- snowfall-zone funding
- centralized-procurement
Workforce and immigration policy
Seasonal labor availability constrains contractors’ capacity to operate Douglas Dynamics equipment during winter peaks, affecting utilization and revenue. Visa rules, notably the H-2B cap of 66,000, and CDL regulations shape driver supply for snow-removal fleets. Federal/state training subsidies and workforce grants can expand operator pools, and policy shifts transmit directly into attachment demand and service revenue.
- H-2B cap: 66,000
- CDL rules limit driver pool
- Training grants boost operators
- Policy changes affect attachment sales & service revenue
IIJA ≈1.2T, tariffs 25%/10%, H-2B 66,000 drive municipal buys
City/state budget cycles (peak June 30) and election-year shifts drive municipal orders for Douglas Dynamics, while IIJA (≈1.2 trillion USD; ≈550 billion new investment) and Build America, Buy America boost federal procurement. 2018 tariffs (steel 25%, aluminum 10%) and USMCA/US-China tensions raise input costs. H-2B cap 66,000 and CDL rules constrain seasonal operator supply, affecting attachment and service revenue.
| Factor | 2024/2025 Data |
|---|---|
| IIJA funding | ≈1.2T total; ≈550B new |
| Steel/Al tariffs | 25% steel; 10% Al |
| H-2B cap | 66,000 |
| Municipal fiscal peak | June 30 |
What is included in the product
 Detailed Word Document
Explores how external macro-environmental factors uniquely affect Douglas Dynamics across Political, Economic, Social, Technological, Environmental and Legal dimensions. Each section is data-backed, region- and industry-specific, with forward-looking insights to inform strategy, risk mitigation and investor communications.

 Customizable Excel Spreadsheet
Douglas Dynamics PESTLE Analysis offers a concise, visually segmented summary that alleviates briefing overload and speeds decision-making in meetings. It’s easily shareable and editable so teams can align quickly on external risks, regulatory shifts, and market positioning.
Economic factors

Seasonality and weather-driven demand
Revenue skews heavily to winter quarters, with more than 50% of annual sales concentrated in Q4–Q1 and snowfall variability driving timing of orders; Douglas Dynamics reported pronounced seasonal revenue swings in recent years. Severe storms often pull forward replacement and emergency buys, creating short-term spikes. Mild winters materially depress aftermarket parts consumption, so inventory planning must buffer volatility across regions to avoid lost sales or excess stock.
Input cost inflation
Input-cost inflation—steel at roughly $760/ton in 2024, hydraulics and electronics with semiconductor-related price rises near 15% YoY, and freight cost pressure (BDI ~1,200 avg 2024)—has compressed Douglas Dynamics margins. Surcharge mechanisms and dynamic pricing have helped pass through much of the increase. Long-term contracts can lag recovery and strain profitability, while supplier consolidation offers potential scale economics and lower unit costs.

Interest rates and fleet financing
Higher interest rates—with the US prime rate near 8.5% in 2024—raise financing costs for contractors and municipalities, pressuring purchase decisions for Douglas Dynamics’ fleet products. Elevated borrowing drives capex deferrals toward repairs and aftermarket parts, benefiting parts revenue streams. Robust leasing and captive finance programs can sustain volumes when credit tightens; rate cuts would likely catalyze replacement cycles.

Light truck sales and construction activity
Light trucks made up roughly 73% of U.S. light‑vehicle sales in 2024, about 10.6 million units, setting the installed base for Douglas Dynamics attachments; housing starts totaled ~1.45 million in 2024 and IIJA infrastructure funding (~$550 billion) sustains construction-driven truck utilization and upfit demand. OEM production constraints (semiconductors, capacity) can bottleneck upfitting throughput, while company reports of strong Work Truck Solutions backlogs enhance near-term visibility.
- Light trucks ~73% of sales (~10.6M, 2024)
- Housing starts ~1.45M (2024)
- IIJA ~$550B supports infrastructure demand
- OEM constraints limit upfit throughput
- Strong WTS backlogs improve visibility
Aftermarket and parts resilience
Aftermarket demand for blades, cutting edges, hydraulics and controllers cushions Douglas Dynamics against equipment sales cyclicality, with harsh winters driving accelerated wear and higher-margin parts replacement; distribution strength and dealer networks convert that demand into captured share, while expanding e-commerce reduces friction and broadens reach.
- Recurring parts smooth revenue volatility
- Severe winters lift high-margin replacements
- Dealer network secures market share
- E-commerce expands reach and lowers transaction friction
IIJA ≈1.2T, tariffs 25%/10%, H-2B 66,000 drive municipal buys
Douglas Dynamics faces pronounced seasonality (50%+ sales in Q4–Q1) and weather-driven aftermarket demand; mild winters cut parts consumption. Input-cost inflation (steel ~$760/ton 2024) and freight pushed margins, partly offset by surcharges. High rates (US prime ~8.5% 2024) constrain fleet purchases, while strong light‑truck volumes and IIJA infrastructure support upfit demand.
| Metric | Value (2024) |
|---|---|
| Seasonal sales concentration | 50%+ Q4–Q1 |
| Steel price | $760/ton |
| US prime rate | ~8.5% |
| Light trucks sold | 10.6M |
| Housing starts | 1.45M |
| IIJA funding | $550B |
Preview Before You Purchase
Douglas Dynamics PESTLE Analysis
The preview shown here is the exact Douglas Dynamics PESTLE Analysis you’ll receive after purchase—fully formatted and ready to use. This real screenshot reflects the final file with complete political, economic, social, technological, legal, and environmental insights. No placeholders or teasers—what you see is what you’ll download immediately after payment.

Your Competitive Advantage Starts with This Report
Uncover how political shifts, economic cycles, and tech advances are shaping Douglas Dynamics with our concise PESTLE overview—three to five actionable insights ready to inform strategy and investment decisions. Purchase the full, editable PESTLE report for a complete breakdown and instant download.
Political factors
Municipal budget cycles
City and state budget approvals, often tied to fiscal year-ends like June 30, drive bulk purchases of plows and spreaders for Douglas Dynamics; election-year priorities frequently reallocate funds away from or toward winter maintenance. The 2021 Bipartisan Infrastructure Law (IIJA) of about 1.2 trillion dollars has unlocked matching funds for fleet upgrades, while federal or state appropriations delays can push municipal orders into later seasons.
Trade policy and tariffs
Tariffs imposed in 2018—25% on steel and 10% on aluminum—continue to push up input costs for Douglas Dynamics, compressing margins and raising pricing pressure. USMCA, effective July 1, 2020, and ongoing US-China trade tensions can disrupt sourcing of components. The Build America, Buy America Act (Nov 2021) tightens federal procurement domestic-content rules. Policy volatility forces hedging and supplier diversification.
Infrastructure and transportation policy
Federal infrastructure spending via the 2021 IIJA, which includes roughly 550 billion dollars of new investment, directly increases demand for snow-control equipment as roads and logistics networks expand. Designated priority corridors and state winter-service mandates raise equipment utilization and replacement cycles. Growth in public-private partnerships creates opportunities for bundled fleet contracts. Regulatory emphasis on resilience is driving higher winter readiness budgets at state and local levels.
Regional governance and snow response mandates
States and provinces set service-level standards for snow clearance that define priority routes and lane-mile targets. Mandated response times force municipalities and contractors to increase fleets and procurement budgets. Funding formulas tied to snowfall zones shift Douglas Dynamics sales toward high-snow regions. Inter-agency coordination and cooperative contracts centralize procurement for thousands of agencies.
- service-standards
- response-time-driven fleets
- snowfall-zone funding
- centralized-procurement
Workforce and immigration policy
Seasonal labor availability constrains contractors’ capacity to operate Douglas Dynamics equipment during winter peaks, affecting utilization and revenue. Visa rules, notably the H-2B cap of 66,000, and CDL regulations shape driver supply for snow-removal fleets. Federal/state training subsidies and workforce grants can expand operator pools, and policy shifts transmit directly into attachment demand and service revenue.
- H-2B cap: 66,000
- CDL rules limit driver pool
- Training grants boost operators
- Policy changes affect attachment sales & service revenue
IIJA ≈1.2T, tariffs 25%/10%, H-2B 66,000 drive municipal buys
City/state budget cycles (peak June 30) and election-year shifts drive municipal orders for Douglas Dynamics, while IIJA (≈1.2 trillion USD; ≈550 billion new investment) and Build America, Buy America boost federal procurement. 2018 tariffs (steel 25%, aluminum 10%) and USMCA/US-China tensions raise input costs. H-2B cap 66,000 and CDL rules constrain seasonal operator supply, affecting attachment and service revenue.
| Factor | 2024/2025 Data |
|---|---|
| IIJA funding | ≈1.2T total; ≈550B new |
| Steel/Al tariffs | 25% steel; 10% Al |
| H-2B cap | 66,000 |
| Municipal fiscal peak | June 30 |
What is included in the product
Detailed Word Document
Explores how external macro-environmental factors uniquely affect Douglas Dynamics across Political, Economic, Social, Technological, Environmental and Legal dimensions. Each section is data-backed, region- and industry-specific, with forward-looking insights to inform strategy, risk mitigation and investor communications.
Customizable Excel Spreadsheet
Douglas Dynamics PESTLE Analysis offers a concise, visually segmented summary that alleviates briefing overload and speeds decision-making in meetings. It’s easily shareable and editable so teams can align quickly on external risks, regulatory shifts, and market positioning.
Economic factors
Seasonality and weather-driven demand
Revenue skews heavily to winter quarters, with more than 50% of annual sales concentrated in Q4–Q1 and snowfall variability driving timing of orders; Douglas Dynamics reported pronounced seasonal revenue swings in recent years. Severe storms often pull forward replacement and emergency buys, creating short-term spikes. Mild winters materially depress aftermarket parts consumption, so inventory planning must buffer volatility across regions to avoid lost sales or excess stock.
Input cost inflation
Input-cost inflation—steel at roughly $760/ton in 2024, hydraulics and electronics with semiconductor-related price rises near 15% YoY, and freight cost pressure (BDI ~1,200 avg 2024)—has compressed Douglas Dynamics margins. Surcharge mechanisms and dynamic pricing have helped pass through much of the increase. Long-term contracts can lag recovery and strain profitability, while supplier consolidation offers potential scale economics and lower unit costs.
Interest rates and fleet financing
Higher interest rates—with the US prime rate near 8.5% in 2024—raise financing costs for contractors and municipalities, pressuring purchase decisions for Douglas Dynamics’ fleet products. Elevated borrowing drives capex deferrals toward repairs and aftermarket parts, benefiting parts revenue streams. Robust leasing and captive finance programs can sustain volumes when credit tightens; rate cuts would likely catalyze replacement cycles.
Light truck sales and construction activity
Light trucks made up roughly 73% of U.S. light‑vehicle sales in 2024, about 10.6 million units, setting the installed base for Douglas Dynamics attachments; housing starts totaled ~1.45 million in 2024 and IIJA infrastructure funding (~$550 billion) sustains construction-driven truck utilization and upfit demand. OEM production constraints (semiconductors, capacity) can bottleneck upfitting throughput, while company reports of strong Work Truck Solutions backlogs enhance near-term visibility.
- Light trucks ~73% of sales (~10.6M, 2024)
- Housing starts ~1.45M (2024)
- IIJA ~$550B supports infrastructure demand
- OEM constraints limit upfit throughput
- Strong WTS backlogs improve visibility
Aftermarket and parts resilience
Aftermarket demand for blades, cutting edges, hydraulics and controllers cushions Douglas Dynamics against equipment sales cyclicality, with harsh winters driving accelerated wear and higher-margin parts replacement; distribution strength and dealer networks convert that demand into captured share, while expanding e-commerce reduces friction and broadens reach.
- Recurring parts smooth revenue volatility
- Severe winters lift high-margin replacements
- Dealer network secures market share
- E-commerce expands reach and lowers transaction friction
IIJA ≈1.2T, tariffs 25%/10%, H-2B 66,000 drive municipal buys
Douglas Dynamics faces pronounced seasonality (50%+ sales in Q4–Q1) and weather-driven aftermarket demand; mild winters cut parts consumption. Input-cost inflation (steel ~$760/ton 2024) and freight pushed margins, partly offset by surcharges. High rates (US prime ~8.5% 2024) constrain fleet purchases, while strong light‑truck volumes and IIJA infrastructure support upfit demand.
| Metric | Value (2024) |
|---|---|
| Seasonal sales concentration | 50%+ Q4–Q1 |
| Steel price | $760/ton |
| US prime rate | ~8.5% |
| Light trucks sold | 10.6M |
| Housing starts | 1.45M |
| IIJA funding | $550B |
Preview Before You Purchase
Douglas Dynamics PESTLE Analysis
The preview shown here is the exact Douglas Dynamics PESTLE Analysis you’ll receive after purchase—fully formatted and ready to use. This real screenshot reflects the final file with complete political, economic, social, technological, legal, and environmental insights. No placeholders or teasers—what you see is what you’ll download immediately after payment.
Original: $10.00
-65%$10.00
$3.50Description
Your Competitive Advantage Starts with This Report
Uncover how political shifts, economic cycles, and tech advances are shaping Douglas Dynamics with our concise PESTLE overview—three to five actionable insights ready to inform strategy and investment decisions. Purchase the full, editable PESTLE report for a complete breakdown and instant download.
Political factors
Municipal budget cycles
City and state budget approvals, often tied to fiscal year-ends like June 30, drive bulk purchases of plows and spreaders for Douglas Dynamics; election-year priorities frequently reallocate funds away from or toward winter maintenance. The 2021 Bipartisan Infrastructure Law (IIJA) of about 1.2 trillion dollars has unlocked matching funds for fleet upgrades, while federal or state appropriations delays can push municipal orders into later seasons.
Trade policy and tariffs
Tariffs imposed in 2018—25% on steel and 10% on aluminum—continue to push up input costs for Douglas Dynamics, compressing margins and raising pricing pressure. USMCA, effective July 1, 2020, and ongoing US-China trade tensions can disrupt sourcing of components. The Build America, Buy America Act (Nov 2021) tightens federal procurement domestic-content rules. Policy volatility forces hedging and supplier diversification.
Infrastructure and transportation policy
Federal infrastructure spending via the 2021 IIJA, which includes roughly 550 billion dollars of new investment, directly increases demand for snow-control equipment as roads and logistics networks expand. Designated priority corridors and state winter-service mandates raise equipment utilization and replacement cycles. Growth in public-private partnerships creates opportunities for bundled fleet contracts. Regulatory emphasis on resilience is driving higher winter readiness budgets at state and local levels.
Regional governance and snow response mandates
States and provinces set service-level standards for snow clearance that define priority routes and lane-mile targets. Mandated response times force municipalities and contractors to increase fleets and procurement budgets. Funding formulas tied to snowfall zones shift Douglas Dynamics sales toward high-snow regions. Inter-agency coordination and cooperative contracts centralize procurement for thousands of agencies.
- service-standards
- response-time-driven fleets
- snowfall-zone funding
- centralized-procurement
Workforce and immigration policy
Seasonal labor availability constrains contractors’ capacity to operate Douglas Dynamics equipment during winter peaks, affecting utilization and revenue. Visa rules, notably the H-2B cap of 66,000, and CDL regulations shape driver supply for snow-removal fleets. Federal/state training subsidies and workforce grants can expand operator pools, and policy shifts transmit directly into attachment demand and service revenue.
- H-2B cap: 66,000
- CDL rules limit driver pool
- Training grants boost operators
- Policy changes affect attachment sales & service revenue
IIJA ≈1.2T, tariffs 25%/10%, H-2B 66,000 drive municipal buys
City/state budget cycles (peak June 30) and election-year shifts drive municipal orders for Douglas Dynamics, while IIJA (≈1.2 trillion USD; ≈550 billion new investment) and Build America, Buy America boost federal procurement. 2018 tariffs (steel 25%, aluminum 10%) and USMCA/US-China tensions raise input costs. H-2B cap 66,000 and CDL rules constrain seasonal operator supply, affecting attachment and service revenue.
| Factor | 2024/2025 Data |
|---|---|
| IIJA funding | ≈1.2T total; ≈550B new |
| Steel/Al tariffs | 25% steel; 10% Al |
| H-2B cap | 66,000 |
| Municipal fiscal peak | June 30 |
What is included in the product
Detailed Word Document
Explores how external macro-environmental factors uniquely affect Douglas Dynamics across Political, Economic, Social, Technological, Environmental and Legal dimensions. Each section is data-backed, region- and industry-specific, with forward-looking insights to inform strategy, risk mitigation and investor communications.
Customizable Excel Spreadsheet
Douglas Dynamics PESTLE Analysis offers a concise, visually segmented summary that alleviates briefing overload and speeds decision-making in meetings. It’s easily shareable and editable so teams can align quickly on external risks, regulatory shifts, and market positioning.
Economic factors
Seasonality and weather-driven demand
Revenue skews heavily to winter quarters, with more than 50% of annual sales concentrated in Q4–Q1 and snowfall variability driving timing of orders; Douglas Dynamics reported pronounced seasonal revenue swings in recent years. Severe storms often pull forward replacement and emergency buys, creating short-term spikes. Mild winters materially depress aftermarket parts consumption, so inventory planning must buffer volatility across regions to avoid lost sales or excess stock.
Input cost inflation
Input-cost inflation—steel at roughly $760/ton in 2024, hydraulics and electronics with semiconductor-related price rises near 15% YoY, and freight cost pressure (BDI ~1,200 avg 2024)—has compressed Douglas Dynamics margins. Surcharge mechanisms and dynamic pricing have helped pass through much of the increase. Long-term contracts can lag recovery and strain profitability, while supplier consolidation offers potential scale economics and lower unit costs.
Interest rates and fleet financing
Higher interest rates—with the US prime rate near 8.5% in 2024—raise financing costs for contractors and municipalities, pressuring purchase decisions for Douglas Dynamics’ fleet products. Elevated borrowing drives capex deferrals toward repairs and aftermarket parts, benefiting parts revenue streams. Robust leasing and captive finance programs can sustain volumes when credit tightens; rate cuts would likely catalyze replacement cycles.
Light truck sales and construction activity
Light trucks made up roughly 73% of U.S. light‑vehicle sales in 2024, about 10.6 million units, setting the installed base for Douglas Dynamics attachments; housing starts totaled ~1.45 million in 2024 and IIJA infrastructure funding (~$550 billion) sustains construction-driven truck utilization and upfit demand. OEM production constraints (semiconductors, capacity) can bottleneck upfitting throughput, while company reports of strong Work Truck Solutions backlogs enhance near-term visibility.
- Light trucks ~73% of sales (~10.6M, 2024)
- Housing starts ~1.45M (2024)
- IIJA ~$550B supports infrastructure demand
- OEM constraints limit upfit throughput
- Strong WTS backlogs improve visibility
Aftermarket and parts resilience
Aftermarket demand for blades, cutting edges, hydraulics and controllers cushions Douglas Dynamics against equipment sales cyclicality, with harsh winters driving accelerated wear and higher-margin parts replacement; distribution strength and dealer networks convert that demand into captured share, while expanding e-commerce reduces friction and broadens reach.
- Recurring parts smooth revenue volatility
- Severe winters lift high-margin replacements
- Dealer network secures market share
- E-commerce expands reach and lowers transaction friction
IIJA ≈1.2T, tariffs 25%/10%, H-2B 66,000 drive municipal buys
Douglas Dynamics faces pronounced seasonality (50%+ sales in Q4–Q1) and weather-driven aftermarket demand; mild winters cut parts consumption. Input-cost inflation (steel ~$760/ton 2024) and freight pushed margins, partly offset by surcharges. High rates (US prime ~8.5% 2024) constrain fleet purchases, while strong light‑truck volumes and IIJA infrastructure support upfit demand.
| Metric | Value (2024) |
|---|---|
| Seasonal sales concentration | 50%+ Q4–Q1 |
| Steel price | $760/ton |
| US prime rate | ~8.5% |
| Light trucks sold | 10.6M |
| Housing starts | 1.45M |
| IIJA funding | $550B |
Preview Before You Purchase
Douglas Dynamics PESTLE Analysis
The preview shown here is the exact Douglas Dynamics PESTLE Analysis you’ll receive after purchase—fully formatted and ready to use. This real screenshot reflects the final file with complete political, economic, social, technological, legal, and environmental insights. No placeholders or teasers—what you see is what you’ll download immediately after payment.











