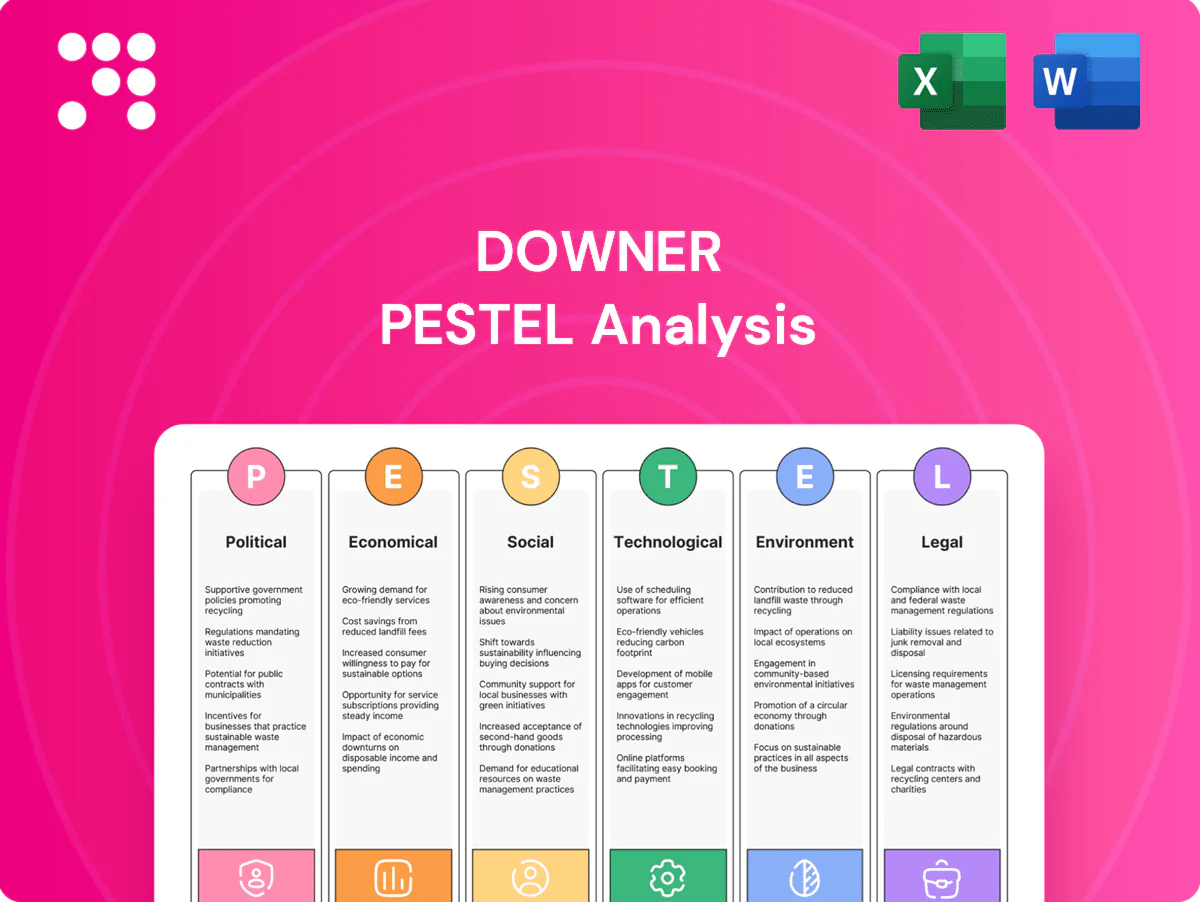
Downer PESTLE Analysis

Your Competitive Advantage Starts with This Report
Unlock how political shifts, economic cycles, social trends, and technological change affect Downer's strategy and risk profile. Our targeted PESTLE distills regulatory, environmental and legal pressures that could reshape operations. Ideal for investors, advisors and strategists, it’s ready to use in decision-making. Purchase the full report to access the complete, actionable breakdown instantly.
Political factors

Infrastructure spend cycles
Downer’s pipeline is closely tied to Australian and New Zealand public capex priorities, with Australian federal elections held every three years and annual budget resets that can reprofile transport and utilities programs. Multi‑year funding (commonly 4–10 year programs) reduces volatility but remains subject to reprioritisation at budget review. Strong, ongoing engagement with Treasury and infrastructure agencies mitigates pipeline risk and supports contract continuity.
PPP and procurement policy
Shifts between PPPs, alliancing and design–build–maintain models are reallocating construction and operational risk toward long‑term service providers, increasing demand for Downer’s integrated capability. Value‑for‑money and social procurement rules shape bid structures and compress margins while prioritising local content and social outcomes. Prequalification frameworks continue to gate access to major packages, reinforcing scale advantages for established firms. Policy emphasis on whole‑of‑life outcomes aligns with Downer’s lifecycle offering and recurring revenue focus in FY24.

Local content and capability
Mandates for local jobs, training and SME participation shape Downer’s supply chain strategy, with Australia/NZ contracts often requiring local workforce and supplier quotas; Downer’s ~43,000-strong workforce and A$8.9bn FY24 revenue support meeting these clauses. Complying raises bid costs via training and subcontracting but boosts win rates against foreign firms. Strong regional delivery networks remain a key differentiator, and government preference for local capability effectively buffers offshore competition.

Indigenous and community outcomes
Indigenous procurement and participation requirements are expanding, with some Australian state procurement frameworks now weighting social value up to 10% and Indigenous-specific targets commonly cited in the 3–5% range; robust partnerships and employment pathways strengthen Downer’s compliance and reputation, while failure risks bid penalties or exclusion and demonstrable social value can be a tie‑breaker in close tenders.
- social value weighting: up to 10%
- Indigenous targets: ~3–5%
- risks: penalties/exclusion
- advantage: measurable social value wins tenders
Trans-Tasman policy alignment
Regulatory and standards alignment between Australia and New Zealand materially affects Downer delivery efficiency; closer alignment reduces duplication while divergences add design, certification and compliance overheads, with two‑way trade around A$30bn in 2023 amplifying cross‑jurisdiction project volumes.
Cross‑border labor mobility rules shape resource deployment—roughly 150,000 NZ citizens were resident in Australia in 2024—while coordinated energy transition policy (both countries target net‑zero by 2050) creates more consistent multi‑year infrastructure opportunity streams.
- Regulatory alignment: lowers compliance costs
- Divergence: increases design/certification overhead
- Labor mobility: ~150,000 NZ residents in Australia (2024)
- Energy policy: both target net‑zero by 2050, enabling steady project pipelines
ANZ public capex follows 3-yr election cycles; PPPs, whole-of-life contracts favor local integrators
Downer’s pipeline tracks Australian/NZ public capex and 3‑year federal election cycles, with multiyear programs (4–10 years) reducing but not eliminating reprioritisation risk. Procurement shifts to PPPs/alliances and whole‑of‑life contracts favour integrated service providers and compress margins. Local content, social value (up to 10%) and Indigenous targets (~3–5%) raise bid costs but boost win rates for established local firms.
| Metric | Value |
|---|---|
| FY24 revenue | A$8.9bn |
| Workforce | ~43,000 |
| Social weighting | up to 10% |
| Indigenous targets | ~3–5% |
| AU–NZ trade (2023) | A$30bn |
What is included in the product
 Detailed Word Document
Explores how external macro-environmental factors uniquely affect Downer across Political, Economic, Social, Technological, Environmental and Legal dimensions, with data-backed trends and forward-looking insights to inform executives, investors and strategists; delivered in clean, report-ready format.

 Customizable Excel Spreadsheet
A concise, visually segmented PESTLE summary tailored to Downer that streamlines meeting prep, is editable for region or business line, easily dropped into presentations, and quickly shareable for cross-team alignment.
Economic factors

Interest rates and funding costs
Higher rates (RBA cash rate 4.35% in July 2024) squeeze client budgets and private finance for PPPs, while increasing bonding, working capital and equipment finance costs; a pivot to cuts can unlock deferred projects. Downer mitigates via interest-rate hedging and disciplined cash management to protect margins and liquidity.
Inflation and input costs
Materials costs rose about 8% year‑on‑year in 2024 and energy prices remained roughly 10% above pre‑pandemic levels, squeezing Downer’s fixed‑price contracts as subcontractor rates climbed ~7% in 2024.
Escalation clauses and collaborative contracting have become standard to mitigate exposure, while supply‑chain diversification (multiple suppliers, local sourcing) has reduced input price volatility materially.
Accurate cost indexation in bids is critical: a 1% indexation error can erode thin construction margins and turn profitable tenders into losses under current inflation dynamics.

Labor market tightness
Labor market tightness in Australia—unemployment near 3.7% (mid‑2024) and wage growth ~4.1%—is driven by shortages in skilled trades and engineering, causing wage inflation and project delays for Downer. Expanded training, apprenticeships and retention programs are essential to rebuild capacity. Flexible resourcing and productivity tech can partially offset constraints. Immigration settings, with net overseas migration around 500k (2023–24), materially affect labour supply.

Commodity and resource cycles
Resource investment cycles drive Downer’s maintenance and capital works demand; downturns typically reduce discretionary capital projects but raise brownfield efficiency and asset optimisation work, supporting utilisation and margins.
- Diversification across mining, transport, utilities smooths revenue
- Long‑term service contracts act as counter‑cyclical ballast
- Downturns shift spend from capex to sustainment
AUD/NZD and FX exposure
Currency swings in 2024–25 (AUD/NZD ~1.06–1.08 mid‑2025) increase costs for imported plant and materials, directly inflating project budgets and margins. Trans‑Tasman operations create both translation risk on consolidated results and transaction risk on NZ‑based contracts. Downer’s hedging policies and forward cover programs have historically limited short‑term FX impact, while increased local sourcing reduces exposure and stabilizes unit costs.
- FX rate (AUD/NZD ~1.06–1.08 mid‑2025)
- Imported plant/materials: higher cost sensitivity
- Translation & transaction risk across NZ ops
- Hedging stabilizes project economics
- Local sourcing lowers FX sensitivity
ANZ public capex follows 3-yr election cycles; PPPs, whole-of-life contracts favor local integrators
Higher rates (RBA 4.35% Jul 2024) and wage inflation (wages ~4.1%, unemployment ~3.7% mid‑2024) squeeze margins; materials +8% and energy +10% y/y elevate fixed‑price risk. FX (AUD/NZD ~1.06–1.08 mid‑2025) and tight labour force raise project costs; hedging, indexation and local sourcing are key mitigants.
| Metric | Value |
|---|---|
| RBA cash rate | 4.35% (Jul 2024) |
| Wage growth | ~4.1% (2024) |
| Materials | +8% y/y (2024) |
| AUD/NZD | 1.06–1.08 (mid‑2025) |
Full Version Awaits
Downer PESTLE Analysis
The Downer PESTLE Analysis preview shown here is the exact document you’ll receive after purchase—fully formatted and ready to use. The layout, content, and structure visible are exactly what you’ll download immediately after buying, with no placeholders or teasers. This is the real, final file—professionally structured and ready for your analysis and decision-making.

Your Competitive Advantage Starts with This Report
Unlock how political shifts, economic cycles, social trends, and technological change affect Downer's strategy and risk profile. Our targeted PESTLE distills regulatory, environmental and legal pressures that could reshape operations. Ideal for investors, advisors and strategists, it’s ready to use in decision-making. Purchase the full report to access the complete, actionable breakdown instantly.
Political factors
Infrastructure spend cycles
Downer’s pipeline is closely tied to Australian and New Zealand public capex priorities, with Australian federal elections held every three years and annual budget resets that can reprofile transport and utilities programs. Multi‑year funding (commonly 4–10 year programs) reduces volatility but remains subject to reprioritisation at budget review. Strong, ongoing engagement with Treasury and infrastructure agencies mitigates pipeline risk and supports contract continuity.
PPP and procurement policy
Shifts between PPPs, alliancing and design–build–maintain models are reallocating construction and operational risk toward long‑term service providers, increasing demand for Downer’s integrated capability. Value‑for‑money and social procurement rules shape bid structures and compress margins while prioritising local content and social outcomes. Prequalification frameworks continue to gate access to major packages, reinforcing scale advantages for established firms. Policy emphasis on whole‑of‑life outcomes aligns with Downer’s lifecycle offering and recurring revenue focus in FY24.
Local content and capability
Mandates for local jobs, training and SME participation shape Downer’s supply chain strategy, with Australia/NZ contracts often requiring local workforce and supplier quotas; Downer’s ~43,000-strong workforce and A$8.9bn FY24 revenue support meeting these clauses. Complying raises bid costs via training and subcontracting but boosts win rates against foreign firms. Strong regional delivery networks remain a key differentiator, and government preference for local capability effectively buffers offshore competition.
Indigenous and community outcomes
Indigenous procurement and participation requirements are expanding, with some Australian state procurement frameworks now weighting social value up to 10% and Indigenous-specific targets commonly cited in the 3–5% range; robust partnerships and employment pathways strengthen Downer’s compliance and reputation, while failure risks bid penalties or exclusion and demonstrable social value can be a tie‑breaker in close tenders.
- social value weighting: up to 10%
- Indigenous targets: ~3–5%
- risks: penalties/exclusion
- advantage: measurable social value wins tenders
Trans-Tasman policy alignment
Regulatory and standards alignment between Australia and New Zealand materially affects Downer delivery efficiency; closer alignment reduces duplication while divergences add design, certification and compliance overheads, with two‑way trade around A$30bn in 2023 amplifying cross‑jurisdiction project volumes.
Cross‑border labor mobility rules shape resource deployment—roughly 150,000 NZ citizens were resident in Australia in 2024—while coordinated energy transition policy (both countries target net‑zero by 2050) creates more consistent multi‑year infrastructure opportunity streams.
- Regulatory alignment: lowers compliance costs
- Divergence: increases design/certification overhead
- Labor mobility: ~150,000 NZ residents in Australia (2024)
- Energy policy: both target net‑zero by 2050, enabling steady project pipelines
ANZ public capex follows 3-yr election cycles; PPPs, whole-of-life contracts favor local integrators
Downer’s pipeline tracks Australian/NZ public capex and 3‑year federal election cycles, with multiyear programs (4–10 years) reducing but not eliminating reprioritisation risk. Procurement shifts to PPPs/alliances and whole‑of‑life contracts favour integrated service providers and compress margins. Local content, social value (up to 10%) and Indigenous targets (~3–5%) raise bid costs but boost win rates for established local firms.
| Metric | Value |
|---|---|
| FY24 revenue | A$8.9bn |
| Workforce | ~43,000 |
| Social weighting | up to 10% |
| Indigenous targets | ~3–5% |
| AU–NZ trade (2023) | A$30bn |
What is included in the product
Detailed Word Document
Explores how external macro-environmental factors uniquely affect Downer across Political, Economic, Social, Technological, Environmental and Legal dimensions, with data-backed trends and forward-looking insights to inform executives, investors and strategists; delivered in clean, report-ready format.
Customizable Excel Spreadsheet
A concise, visually segmented PESTLE summary tailored to Downer that streamlines meeting prep, is editable for region or business line, easily dropped into presentations, and quickly shareable for cross-team alignment.
Economic factors
Interest rates and funding costs
Higher rates (RBA cash rate 4.35% in July 2024) squeeze client budgets and private finance for PPPs, while increasing bonding, working capital and equipment finance costs; a pivot to cuts can unlock deferred projects. Downer mitigates via interest-rate hedging and disciplined cash management to protect margins and liquidity.
Inflation and input costs
Materials costs rose about 8% year‑on‑year in 2024 and energy prices remained roughly 10% above pre‑pandemic levels, squeezing Downer’s fixed‑price contracts as subcontractor rates climbed ~7% in 2024.
Escalation clauses and collaborative contracting have become standard to mitigate exposure, while supply‑chain diversification (multiple suppliers, local sourcing) has reduced input price volatility materially.
Accurate cost indexation in bids is critical: a 1% indexation error can erode thin construction margins and turn profitable tenders into losses under current inflation dynamics.
Labor market tightness
Labor market tightness in Australia—unemployment near 3.7% (mid‑2024) and wage growth ~4.1%—is driven by shortages in skilled trades and engineering, causing wage inflation and project delays for Downer. Expanded training, apprenticeships and retention programs are essential to rebuild capacity. Flexible resourcing and productivity tech can partially offset constraints. Immigration settings, with net overseas migration around 500k (2023–24), materially affect labour supply.
Commodity and resource cycles
Resource investment cycles drive Downer’s maintenance and capital works demand; downturns typically reduce discretionary capital projects but raise brownfield efficiency and asset optimisation work, supporting utilisation and margins.
- Diversification across mining, transport, utilities smooths revenue
- Long‑term service contracts act as counter‑cyclical ballast
- Downturns shift spend from capex to sustainment
AUD/NZD and FX exposure
Currency swings in 2024–25 (AUD/NZD ~1.06–1.08 mid‑2025) increase costs for imported plant and materials, directly inflating project budgets and margins. Trans‑Tasman operations create both translation risk on consolidated results and transaction risk on NZ‑based contracts. Downer’s hedging policies and forward cover programs have historically limited short‑term FX impact, while increased local sourcing reduces exposure and stabilizes unit costs.
- FX rate (AUD/NZD ~1.06–1.08 mid‑2025)
- Imported plant/materials: higher cost sensitivity
- Translation & transaction risk across NZ ops
- Hedging stabilizes project economics
- Local sourcing lowers FX sensitivity
ANZ public capex follows 3-yr election cycles; PPPs, whole-of-life contracts favor local integrators
Higher rates (RBA 4.35% Jul 2024) and wage inflation (wages ~4.1%, unemployment ~3.7% mid‑2024) squeeze margins; materials +8% and energy +10% y/y elevate fixed‑price risk. FX (AUD/NZD ~1.06–1.08 mid‑2025) and tight labour force raise project costs; hedging, indexation and local sourcing are key mitigants.
| Metric | Value |
|---|---|
| RBA cash rate | 4.35% (Jul 2024) |
| Wage growth | ~4.1% (2024) |
| Materials | +8% y/y (2024) |
| AUD/NZD | 1.06–1.08 (mid‑2025) |
Full Version Awaits
Downer PESTLE Analysis
The Downer PESTLE Analysis preview shown here is the exact document you’ll receive after purchase—fully formatted and ready to use. The layout, content, and structure visible are exactly what you’ll download immediately after buying, with no placeholders or teasers. This is the real, final file—professionally structured and ready for your analysis and decision-making.
Description
Your Competitive Advantage Starts with This Report
Unlock how political shifts, economic cycles, social trends, and technological change affect Downer's strategy and risk profile. Our targeted PESTLE distills regulatory, environmental and legal pressures that could reshape operations. Ideal for investors, advisors and strategists, it’s ready to use in decision-making. Purchase the full report to access the complete, actionable breakdown instantly.
Political factors
Infrastructure spend cycles
Downer’s pipeline is closely tied to Australian and New Zealand public capex priorities, with Australian federal elections held every three years and annual budget resets that can reprofile transport and utilities programs. Multi‑year funding (commonly 4–10 year programs) reduces volatility but remains subject to reprioritisation at budget review. Strong, ongoing engagement with Treasury and infrastructure agencies mitigates pipeline risk and supports contract continuity.
PPP and procurement policy
Shifts between PPPs, alliancing and design–build–maintain models are reallocating construction and operational risk toward long‑term service providers, increasing demand for Downer’s integrated capability. Value‑for‑money and social procurement rules shape bid structures and compress margins while prioritising local content and social outcomes. Prequalification frameworks continue to gate access to major packages, reinforcing scale advantages for established firms. Policy emphasis on whole‑of‑life outcomes aligns with Downer’s lifecycle offering and recurring revenue focus in FY24.
Local content and capability
Mandates for local jobs, training and SME participation shape Downer’s supply chain strategy, with Australia/NZ contracts often requiring local workforce and supplier quotas; Downer’s ~43,000-strong workforce and A$8.9bn FY24 revenue support meeting these clauses. Complying raises bid costs via training and subcontracting but boosts win rates against foreign firms. Strong regional delivery networks remain a key differentiator, and government preference for local capability effectively buffers offshore competition.
Indigenous and community outcomes
Indigenous procurement and participation requirements are expanding, with some Australian state procurement frameworks now weighting social value up to 10% and Indigenous-specific targets commonly cited in the 3–5% range; robust partnerships and employment pathways strengthen Downer’s compliance and reputation, while failure risks bid penalties or exclusion and demonstrable social value can be a tie‑breaker in close tenders.
- social value weighting: up to 10%
- Indigenous targets: ~3–5%
- risks: penalties/exclusion
- advantage: measurable social value wins tenders
Trans-Tasman policy alignment
Regulatory and standards alignment between Australia and New Zealand materially affects Downer delivery efficiency; closer alignment reduces duplication while divergences add design, certification and compliance overheads, with two‑way trade around A$30bn in 2023 amplifying cross‑jurisdiction project volumes.
Cross‑border labor mobility rules shape resource deployment—roughly 150,000 NZ citizens were resident in Australia in 2024—while coordinated energy transition policy (both countries target net‑zero by 2050) creates more consistent multi‑year infrastructure opportunity streams.
- Regulatory alignment: lowers compliance costs
- Divergence: increases design/certification overhead
- Labor mobility: ~150,000 NZ residents in Australia (2024)
- Energy policy: both target net‑zero by 2050, enabling steady project pipelines
ANZ public capex follows 3-yr election cycles; PPPs, whole-of-life contracts favor local integrators
Downer’s pipeline tracks Australian/NZ public capex and 3‑year federal election cycles, with multiyear programs (4–10 years) reducing but not eliminating reprioritisation risk. Procurement shifts to PPPs/alliances and whole‑of‑life contracts favour integrated service providers and compress margins. Local content, social value (up to 10%) and Indigenous targets (~3–5%) raise bid costs but boost win rates for established local firms.
| Metric | Value |
|---|---|
| FY24 revenue | A$8.9bn |
| Workforce | ~43,000 |
| Social weighting | up to 10% |
| Indigenous targets | ~3–5% |
| AU–NZ trade (2023) | A$30bn |
What is included in the product
Detailed Word Document
Explores how external macro-environmental factors uniquely affect Downer across Political, Economic, Social, Technological, Environmental and Legal dimensions, with data-backed trends and forward-looking insights to inform executives, investors and strategists; delivered in clean, report-ready format.
Customizable Excel Spreadsheet
A concise, visually segmented PESTLE summary tailored to Downer that streamlines meeting prep, is editable for region or business line, easily dropped into presentations, and quickly shareable for cross-team alignment.
Economic factors
Interest rates and funding costs
Higher rates (RBA cash rate 4.35% in July 2024) squeeze client budgets and private finance for PPPs, while increasing bonding, working capital and equipment finance costs; a pivot to cuts can unlock deferred projects. Downer mitigates via interest-rate hedging and disciplined cash management to protect margins and liquidity.
Inflation and input costs
Materials costs rose about 8% year‑on‑year in 2024 and energy prices remained roughly 10% above pre‑pandemic levels, squeezing Downer’s fixed‑price contracts as subcontractor rates climbed ~7% in 2024.
Escalation clauses and collaborative contracting have become standard to mitigate exposure, while supply‑chain diversification (multiple suppliers, local sourcing) has reduced input price volatility materially.
Accurate cost indexation in bids is critical: a 1% indexation error can erode thin construction margins and turn profitable tenders into losses under current inflation dynamics.
Labor market tightness
Labor market tightness in Australia—unemployment near 3.7% (mid‑2024) and wage growth ~4.1%—is driven by shortages in skilled trades and engineering, causing wage inflation and project delays for Downer. Expanded training, apprenticeships and retention programs are essential to rebuild capacity. Flexible resourcing and productivity tech can partially offset constraints. Immigration settings, with net overseas migration around 500k (2023–24), materially affect labour supply.
Commodity and resource cycles
Resource investment cycles drive Downer’s maintenance and capital works demand; downturns typically reduce discretionary capital projects but raise brownfield efficiency and asset optimisation work, supporting utilisation and margins.
- Diversification across mining, transport, utilities smooths revenue
- Long‑term service contracts act as counter‑cyclical ballast
- Downturns shift spend from capex to sustainment
AUD/NZD and FX exposure
Currency swings in 2024–25 (AUD/NZD ~1.06–1.08 mid‑2025) increase costs for imported plant and materials, directly inflating project budgets and margins. Trans‑Tasman operations create both translation risk on consolidated results and transaction risk on NZ‑based contracts. Downer’s hedging policies and forward cover programs have historically limited short‑term FX impact, while increased local sourcing reduces exposure and stabilizes unit costs.
- FX rate (AUD/NZD ~1.06–1.08 mid‑2025)
- Imported plant/materials: higher cost sensitivity
- Translation & transaction risk across NZ ops
- Hedging stabilizes project economics
- Local sourcing lowers FX sensitivity
ANZ public capex follows 3-yr election cycles; PPPs, whole-of-life contracts favor local integrators
Higher rates (RBA 4.35% Jul 2024) and wage inflation (wages ~4.1%, unemployment ~3.7% mid‑2024) squeeze margins; materials +8% and energy +10% y/y elevate fixed‑price risk. FX (AUD/NZD ~1.06–1.08 mid‑2025) and tight labour force raise project costs; hedging, indexation and local sourcing are key mitigants.
| Metric | Value |
|---|---|
| RBA cash rate | 4.35% (Jul 2024) |
| Wage growth | ~4.1% (2024) |
| Materials | +8% y/y (2024) |
| AUD/NZD | 1.06–1.08 (mid‑2025) |
Full Version Awaits
Downer PESTLE Analysis
The Downer PESTLE Analysis preview shown here is the exact document you’ll receive after purchase—fully formatted and ready to use. The layout, content, and structure visible are exactly what you’ll download immediately after buying, with no placeholders or teasers. This is the real, final file—professionally structured and ready for your analysis and decision-making.











