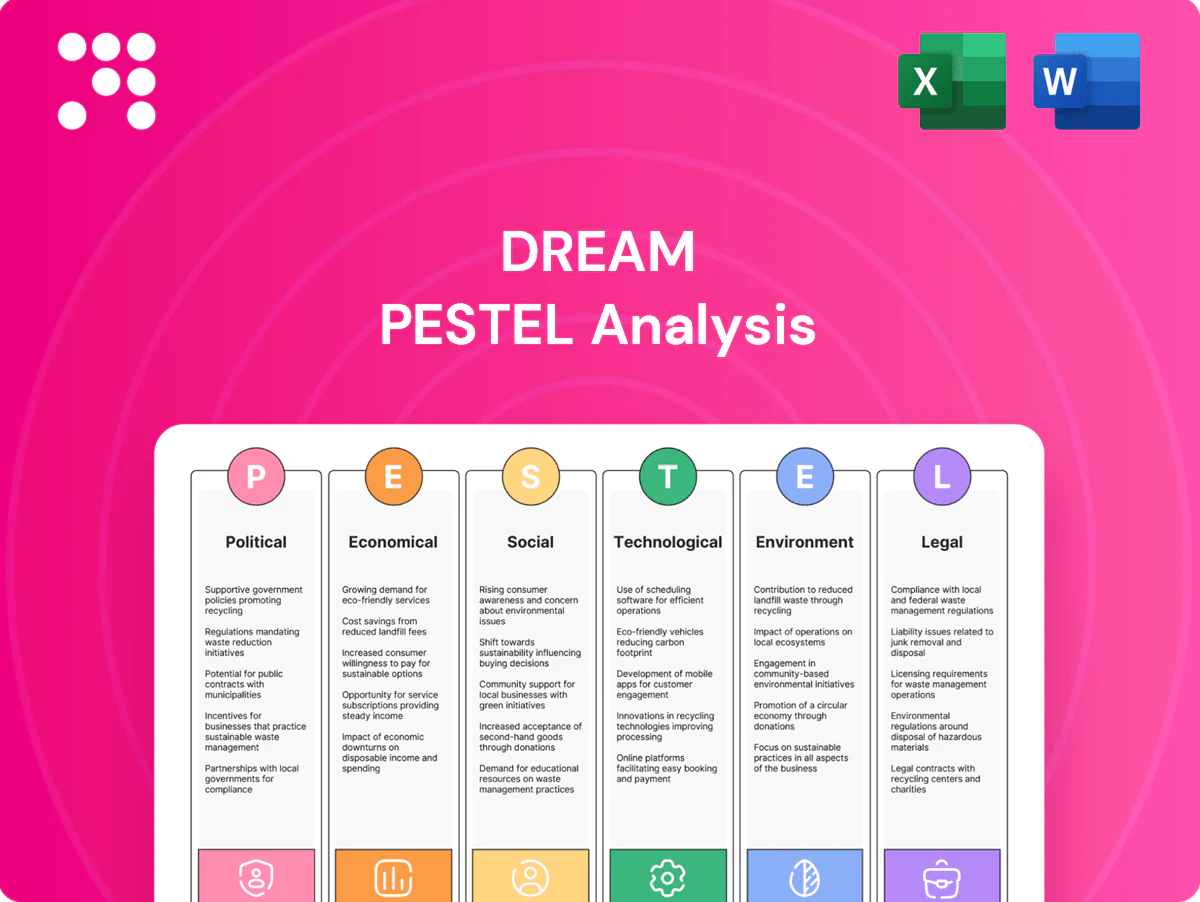
Dream PESTLE Analysis

Plan Smarter. Present Sharper. Compete Stronger.
Unlock strategic clarity with our tailored PESTLE Analysis of Dream—concise, actionable insights on political, economic, social, technological, legal, and environmental forces shaping its future. Ideal for investors, advisors, and planners seeking a competitive edge, this brief highlights key risks and growth levers. Purchase the full report for deep-dive data, scenario planning, and ready-to-use slides to inform decisions instantly.
Political factors

Municipal zoning and land-use approvals
City councils control rezoning, density and approvals, setting project timelines and yields; entitlements routinely add 12–24 months to delivery per Urban Land Institute analyses. Pro-housing agendas (dozens of U.S. cities by 2024) have accelerated approvals, while NIMBY opposition can stall projects. Active stakeholder engagement and clear community benefits measurably improve approval odds. Multi-city diversification across 5+ markets mitigates local political concentration risk.
Housing affordability and public policy incentives
Incentives for affordable and mixed-income housing can unlock density bonuses and subsidies that improve feasibility; inclusionary zoning and rent regulations materially shift project mix and returns. Dream’s impact focus aligns with programs like LIHTC (roughly $11B/year) amid a national shortage of about 7.2M affordable units, so monitor changing affordability mandates that alter underwriting.

Infrastructure and transit investment priorities
Government transit spending—for example the US Bipartisan Infrastructure Law’s roughly 65 billion for public transit—typically lifts nearby land values by about 8–12% and accelerates absorption rates. Developments sited next to funded lines often secure stronger political backing and faster approvals, while policy delays or average transit cost overruns near 30% can defer adjacent projects. Continued advocacy for priority corridors aligns with Dream’s urban strategy.

Renewable energy and climate policy direction
Participation in public‑private partnerships helps scale assets under management, enabling larger pooled capital and streamlined permitting to accelerate deployment.
- Targets: 140+ countries net‑zero commitments
- Incentives: 30% base ITC for solar/storage (US IRA)
- Delay risk: permitting often adds 12–24 months
- Scaling: PPPs increase deployable AUM and reduce project timelines
Trade, immigration, and urban growth agendas
Canada set immigration targets of 485,000 in 2024 and 500,000 in 2025, expanding urban housing demand and forcing larger pipeline sizing for mixed-use and last-mile logistics.
- Immigration targets: 485,000 (2024), 500,000 (2025)
- Trade/industrial policy: reshoring/USMCA effects on warehouse demand
- Regional political shifts: alter growth patterns and allocation needs
- Use scenario planning to buffer cross-asset allocations
Rezoning delays lengthen delivery; incentives, transit funding and immigration reshape housing demand
Local rezoning and entitlements add 12–24 months to delivery; pro‑housing cities speed approvals while NIMBY risk persists. Affordable housing incentives (LIHTC ~11B/year) and inclusionary rules alter returns amid a 7.2M US affordable-unit gap. Transit funding (Bipartisan Infrastructure Law ~65B) uplifts land values ~8–12%. IRA ITC 30% and Canada immigration targets (485k 2024, 500k 2025) shift demand.
| Metric | Value |
|---|---|
| Entitlement delay | 12–24 months |
| LIHTC | ≈11B/year |
| Affordable gap (US) | 7.2M units |
| Transit funding | ≈65B |
| ITC (IRA) | 30% |
| Canada immigration | 485k (2024), 500k (2025) |
What is included in the product
 Detailed Word Document
Explores how external macro-environmental factors uniquely affect the Dream across six dimensions—Political, Economic, Social, Technological, Environmental, and Legal—each backed by current data and trend analysis to identify threats and opportunities. Designed for executives, investors, and strategists, it provides actionable, region‑and industry‑specific insights ready for plans and pitches.

 Customizable Excel Spreadsheet
Compact, visually segmented Dream PESTLE summaries streamline external risk discussions and decision-making, easily shared or dropped into presentations for quick team alignment.
Economic factors

Interest rates, cap rates, and financing costs
Rate cycles directly affect development feasibilities and REIT valuations: with the US federal funds rate near 5.25–5.50% in mid‑2025, higher debt costs have compressed project margins and deferred starts; easing would reopen pipelines. Increased borrowing pushed commercial cap rates up roughly 100–200 bps versus 2021, reducing NAVs and shifting transaction timing. Active hedging and staggered maturities have kept cash‑flow volatility manageable across portfolios.
Housing demand, employment, and wage trends
Job and wage growth support urban absorption and rents: US unemployment 3.7% (June 2025) and average hourly earnings +3.9% YoY sustain multifamily asking rents (+1.5% YoY June 2025). Tech, logistics and services cycles drive office/industrial fundamentals—national office vacancy ~16% Q1 2025 versus industrial ~5.2%. Demand elasticity varies by submarket and product type; coastal multifamily is relatively inelastic, suburban office more elastic. Data-led leasing (dynamic pricing, tenant analytics) optimizes mix and pricing to protect NOI.

Construction costs and supply chain volatility
Material price swings and labor shortages are squeezing pro formas—AGC 2024 reports 78% of contractors face craft-worker shortages—while long-lead items and logistics disruptions commonly add 3–9 months to schedules. Strategic procurement, modularization (schedule cuts often 30–50%) and alliances lower risk, and contingency buffers of roughly 7–15% are now standard in budgeting.

Inflation and operating expenses
Inflation in 2024 (US CPI ~3.4%) pushed utilities, taxes and maintenance higher, raising operating costs for Dream. CPI-linked rent escalators and service recharges can partially offset increases where leases include clauses. Energy retrofits typically cut energy use 10–25%, reducing opex and strengthening NOI resilience. Portfolio mix (NNN versus gross leases) drives pass-through ability.
- 2024 CPI ~3.4%
- Energy retrofit savings 10–25%
- Pass-through depends on % NNN leases
Capital markets and fundraising conditions
REIT equity appetite and private fund commitments underpin growth capacity: global private capital dry powder reached about $2.7 trillion in H1 2024 (Preqin) while US listed REIT market cap was roughly $1.4 trillion in 2024 (Nareit); liquidity windows therefore dictate asset recycling and acquisition timing. Transparent impact outcomes can broaden LP base, and prudent leverage preserves covenants and credit ratings.
- REIT equity appetite: US REIT market cap ~1.4T (2024)
- Private capital dry powder: ~2.7T (H1 2024)
- Liquidity windows: drive recycling vs acquisitions
- Impact transparency: expands LP pool
- Leverage: protects covenants & ratings
Rezoning delays lengthen delivery; incentives, transit funding and immigration reshape housing demand
Higher rates (fed funds ~5.25–5.50% mid‑2025) and wider cap rates (≈+100–200bps vs 2021) have tightened development feasibilities and NAVs; easing would restart pipelines. Strong labor and wage growth (unemployment 3.7% June 2025; AHE +3.9% YoY) support rent absorption, while supply chain/labor shortages lengthen schedules 3–9 months. Inflation (CPI ~3.4% 2024) lifts opex; CPI escalators and retrofit savings (10–25%) mitigate impact.
| Metric | Value |
|---|---|
| Fed funds | 5.25–5.50% (mid‑2025) |
| Unemployment | 3.7% (Jun 2025) |
| AHE | +3.9% YoY |
| CPI | ~3.4% (2024) |
| REIT mkt cap | ~$1.4T (2024) |
| Dry powder | ~$2.7T (H1 2024) |
Preview the Actual Deliverable
Dream PESTLE Analysis
The preview shown here is the exact Dream PESTLE Analysis document you’ll receive after purchase—fully formatted, professionally structured, and ready to use. No placeholders or teasers: this is the real file. After checkout you’ll instantly download this exact finished product.

Plan Smarter. Present Sharper. Compete Stronger.
Unlock strategic clarity with our tailored PESTLE Analysis of Dream—concise, actionable insights on political, economic, social, technological, legal, and environmental forces shaping its future. Ideal for investors, advisors, and planners seeking a competitive edge, this brief highlights key risks and growth levers. Purchase the full report for deep-dive data, scenario planning, and ready-to-use slides to inform decisions instantly.
Political factors
Municipal zoning and land-use approvals
City councils control rezoning, density and approvals, setting project timelines and yields; entitlements routinely add 12–24 months to delivery per Urban Land Institute analyses. Pro-housing agendas (dozens of U.S. cities by 2024) have accelerated approvals, while NIMBY opposition can stall projects. Active stakeholder engagement and clear community benefits measurably improve approval odds. Multi-city diversification across 5+ markets mitigates local political concentration risk.
Housing affordability and public policy incentives
Incentives for affordable and mixed-income housing can unlock density bonuses and subsidies that improve feasibility; inclusionary zoning and rent regulations materially shift project mix and returns. Dream’s impact focus aligns with programs like LIHTC (roughly $11B/year) amid a national shortage of about 7.2M affordable units, so monitor changing affordability mandates that alter underwriting.
Infrastructure and transit investment priorities
Government transit spending—for example the US Bipartisan Infrastructure Law’s roughly 65 billion for public transit—typically lifts nearby land values by about 8–12% and accelerates absorption rates. Developments sited next to funded lines often secure stronger political backing and faster approvals, while policy delays or average transit cost overruns near 30% can defer adjacent projects. Continued advocacy for priority corridors aligns with Dream’s urban strategy.
Renewable energy and climate policy direction
Participation in public‑private partnerships helps scale assets under management, enabling larger pooled capital and streamlined permitting to accelerate deployment.
- Targets: 140+ countries net‑zero commitments
- Incentives: 30% base ITC for solar/storage (US IRA)
- Delay risk: permitting often adds 12–24 months
- Scaling: PPPs increase deployable AUM and reduce project timelines
Trade, immigration, and urban growth agendas
Canada set immigration targets of 485,000 in 2024 and 500,000 in 2025, expanding urban housing demand and forcing larger pipeline sizing for mixed-use and last-mile logistics.
- Immigration targets: 485,000 (2024), 500,000 (2025)
- Trade/industrial policy: reshoring/USMCA effects on warehouse demand
- Regional political shifts: alter growth patterns and allocation needs
- Use scenario planning to buffer cross-asset allocations
Rezoning delays lengthen delivery; incentives, transit funding and immigration reshape housing demand
Local rezoning and entitlements add 12–24 months to delivery; pro‑housing cities speed approvals while NIMBY risk persists. Affordable housing incentives (LIHTC ~11B/year) and inclusionary rules alter returns amid a 7.2M US affordable-unit gap. Transit funding (Bipartisan Infrastructure Law ~65B) uplifts land values ~8–12%. IRA ITC 30% and Canada immigration targets (485k 2024, 500k 2025) shift demand.
| Metric | Value |
|---|---|
| Entitlement delay | 12–24 months |
| LIHTC | ≈11B/year |
| Affordable gap (US) | 7.2M units |
| Transit funding | ≈65B |
| ITC (IRA) | 30% |
| Canada immigration | 485k (2024), 500k (2025) |
What is included in the product
Detailed Word Document
Explores how external macro-environmental factors uniquely affect the Dream across six dimensions—Political, Economic, Social, Technological, Environmental, and Legal—each backed by current data and trend analysis to identify threats and opportunities. Designed for executives, investors, and strategists, it provides actionable, region‑and industry‑specific insights ready for plans and pitches.
Customizable Excel Spreadsheet
Compact, visually segmented Dream PESTLE summaries streamline external risk discussions and decision-making, easily shared or dropped into presentations for quick team alignment.
Economic factors
Interest rates, cap rates, and financing costs
Rate cycles directly affect development feasibilities and REIT valuations: with the US federal funds rate near 5.25–5.50% in mid‑2025, higher debt costs have compressed project margins and deferred starts; easing would reopen pipelines. Increased borrowing pushed commercial cap rates up roughly 100–200 bps versus 2021, reducing NAVs and shifting transaction timing. Active hedging and staggered maturities have kept cash‑flow volatility manageable across portfolios.
Housing demand, employment, and wage trends
Job and wage growth support urban absorption and rents: US unemployment 3.7% (June 2025) and average hourly earnings +3.9% YoY sustain multifamily asking rents (+1.5% YoY June 2025). Tech, logistics and services cycles drive office/industrial fundamentals—national office vacancy ~16% Q1 2025 versus industrial ~5.2%. Demand elasticity varies by submarket and product type; coastal multifamily is relatively inelastic, suburban office more elastic. Data-led leasing (dynamic pricing, tenant analytics) optimizes mix and pricing to protect NOI.
Construction costs and supply chain volatility
Material price swings and labor shortages are squeezing pro formas—AGC 2024 reports 78% of contractors face craft-worker shortages—while long-lead items and logistics disruptions commonly add 3–9 months to schedules. Strategic procurement, modularization (schedule cuts often 30–50%) and alliances lower risk, and contingency buffers of roughly 7–15% are now standard in budgeting.
Inflation and operating expenses
Inflation in 2024 (US CPI ~3.4%) pushed utilities, taxes and maintenance higher, raising operating costs for Dream. CPI-linked rent escalators and service recharges can partially offset increases where leases include clauses. Energy retrofits typically cut energy use 10–25%, reducing opex and strengthening NOI resilience. Portfolio mix (NNN versus gross leases) drives pass-through ability.
- 2024 CPI ~3.4%
- Energy retrofit savings 10–25%
- Pass-through depends on % NNN leases
Capital markets and fundraising conditions
REIT equity appetite and private fund commitments underpin growth capacity: global private capital dry powder reached about $2.7 trillion in H1 2024 (Preqin) while US listed REIT market cap was roughly $1.4 trillion in 2024 (Nareit); liquidity windows therefore dictate asset recycling and acquisition timing. Transparent impact outcomes can broaden LP base, and prudent leverage preserves covenants and credit ratings.
- REIT equity appetite: US REIT market cap ~1.4T (2024)
- Private capital dry powder: ~2.7T (H1 2024)
- Liquidity windows: drive recycling vs acquisitions
- Impact transparency: expands LP pool
- Leverage: protects covenants & ratings
Rezoning delays lengthen delivery; incentives, transit funding and immigration reshape housing demand
Higher rates (fed funds ~5.25–5.50% mid‑2025) and wider cap rates (≈+100–200bps vs 2021) have tightened development feasibilities and NAVs; easing would restart pipelines. Strong labor and wage growth (unemployment 3.7% June 2025; AHE +3.9% YoY) support rent absorption, while supply chain/labor shortages lengthen schedules 3–9 months. Inflation (CPI ~3.4% 2024) lifts opex; CPI escalators and retrofit savings (10–25%) mitigate impact.
| Metric | Value |
|---|---|
| Fed funds | 5.25–5.50% (mid‑2025) |
| Unemployment | 3.7% (Jun 2025) |
| AHE | +3.9% YoY |
| CPI | ~3.4% (2024) |
| REIT mkt cap | ~$1.4T (2024) |
| Dry powder | ~$2.7T (H1 2024) |
Preview the Actual Deliverable
Dream PESTLE Analysis
The preview shown here is the exact Dream PESTLE Analysis document you’ll receive after purchase—fully formatted, professionally structured, and ready to use. No placeholders or teasers: this is the real file. After checkout you’ll instantly download this exact finished product.
Description
Plan Smarter. Present Sharper. Compete Stronger.
Unlock strategic clarity with our tailored PESTLE Analysis of Dream—concise, actionable insights on political, economic, social, technological, legal, and environmental forces shaping its future. Ideal for investors, advisors, and planners seeking a competitive edge, this brief highlights key risks and growth levers. Purchase the full report for deep-dive data, scenario planning, and ready-to-use slides to inform decisions instantly.
Political factors
Municipal zoning and land-use approvals
City councils control rezoning, density and approvals, setting project timelines and yields; entitlements routinely add 12–24 months to delivery per Urban Land Institute analyses. Pro-housing agendas (dozens of U.S. cities by 2024) have accelerated approvals, while NIMBY opposition can stall projects. Active stakeholder engagement and clear community benefits measurably improve approval odds. Multi-city diversification across 5+ markets mitigates local political concentration risk.
Housing affordability and public policy incentives
Incentives for affordable and mixed-income housing can unlock density bonuses and subsidies that improve feasibility; inclusionary zoning and rent regulations materially shift project mix and returns. Dream’s impact focus aligns with programs like LIHTC (roughly $11B/year) amid a national shortage of about 7.2M affordable units, so monitor changing affordability mandates that alter underwriting.
Infrastructure and transit investment priorities
Government transit spending—for example the US Bipartisan Infrastructure Law’s roughly 65 billion for public transit—typically lifts nearby land values by about 8–12% and accelerates absorption rates. Developments sited next to funded lines often secure stronger political backing and faster approvals, while policy delays or average transit cost overruns near 30% can defer adjacent projects. Continued advocacy for priority corridors aligns with Dream’s urban strategy.
Renewable energy and climate policy direction
Participation in public‑private partnerships helps scale assets under management, enabling larger pooled capital and streamlined permitting to accelerate deployment.
- Targets: 140+ countries net‑zero commitments
- Incentives: 30% base ITC for solar/storage (US IRA)
- Delay risk: permitting often adds 12–24 months
- Scaling: PPPs increase deployable AUM and reduce project timelines
Trade, immigration, and urban growth agendas
Canada set immigration targets of 485,000 in 2024 and 500,000 in 2025, expanding urban housing demand and forcing larger pipeline sizing for mixed-use and last-mile logistics.
- Immigration targets: 485,000 (2024), 500,000 (2025)
- Trade/industrial policy: reshoring/USMCA effects on warehouse demand
- Regional political shifts: alter growth patterns and allocation needs
- Use scenario planning to buffer cross-asset allocations
Rezoning delays lengthen delivery; incentives, transit funding and immigration reshape housing demand
Local rezoning and entitlements add 12–24 months to delivery; pro‑housing cities speed approvals while NIMBY risk persists. Affordable housing incentives (LIHTC ~11B/year) and inclusionary rules alter returns amid a 7.2M US affordable-unit gap. Transit funding (Bipartisan Infrastructure Law ~65B) uplifts land values ~8–12%. IRA ITC 30% and Canada immigration targets (485k 2024, 500k 2025) shift demand.
| Metric | Value |
|---|---|
| Entitlement delay | 12–24 months |
| LIHTC | ≈11B/year |
| Affordable gap (US) | 7.2M units |
| Transit funding | ≈65B |
| ITC (IRA) | 30% |
| Canada immigration | 485k (2024), 500k (2025) |
What is included in the product
Detailed Word Document
Explores how external macro-environmental factors uniquely affect the Dream across six dimensions—Political, Economic, Social, Technological, Environmental, and Legal—each backed by current data and trend analysis to identify threats and opportunities. Designed for executives, investors, and strategists, it provides actionable, region‑and industry‑specific insights ready for plans and pitches.
Customizable Excel Spreadsheet
Compact, visually segmented Dream PESTLE summaries streamline external risk discussions and decision-making, easily shared or dropped into presentations for quick team alignment.
Economic factors
Interest rates, cap rates, and financing costs
Rate cycles directly affect development feasibilities and REIT valuations: with the US federal funds rate near 5.25–5.50% in mid‑2025, higher debt costs have compressed project margins and deferred starts; easing would reopen pipelines. Increased borrowing pushed commercial cap rates up roughly 100–200 bps versus 2021, reducing NAVs and shifting transaction timing. Active hedging and staggered maturities have kept cash‑flow volatility manageable across portfolios.
Housing demand, employment, and wage trends
Job and wage growth support urban absorption and rents: US unemployment 3.7% (June 2025) and average hourly earnings +3.9% YoY sustain multifamily asking rents (+1.5% YoY June 2025). Tech, logistics and services cycles drive office/industrial fundamentals—national office vacancy ~16% Q1 2025 versus industrial ~5.2%. Demand elasticity varies by submarket and product type; coastal multifamily is relatively inelastic, suburban office more elastic. Data-led leasing (dynamic pricing, tenant analytics) optimizes mix and pricing to protect NOI.
Construction costs and supply chain volatility
Material price swings and labor shortages are squeezing pro formas—AGC 2024 reports 78% of contractors face craft-worker shortages—while long-lead items and logistics disruptions commonly add 3–9 months to schedules. Strategic procurement, modularization (schedule cuts often 30–50%) and alliances lower risk, and contingency buffers of roughly 7–15% are now standard in budgeting.
Inflation and operating expenses
Inflation in 2024 (US CPI ~3.4%) pushed utilities, taxes and maintenance higher, raising operating costs for Dream. CPI-linked rent escalators and service recharges can partially offset increases where leases include clauses. Energy retrofits typically cut energy use 10–25%, reducing opex and strengthening NOI resilience. Portfolio mix (NNN versus gross leases) drives pass-through ability.
- 2024 CPI ~3.4%
- Energy retrofit savings 10–25%
- Pass-through depends on % NNN leases
Capital markets and fundraising conditions
REIT equity appetite and private fund commitments underpin growth capacity: global private capital dry powder reached about $2.7 trillion in H1 2024 (Preqin) while US listed REIT market cap was roughly $1.4 trillion in 2024 (Nareit); liquidity windows therefore dictate asset recycling and acquisition timing. Transparent impact outcomes can broaden LP base, and prudent leverage preserves covenants and credit ratings.
- REIT equity appetite: US REIT market cap ~1.4T (2024)
- Private capital dry powder: ~2.7T (H1 2024)
- Liquidity windows: drive recycling vs acquisitions
- Impact transparency: expands LP pool
- Leverage: protects covenants & ratings
Rezoning delays lengthen delivery; incentives, transit funding and immigration reshape housing demand
Higher rates (fed funds ~5.25–5.50% mid‑2025) and wider cap rates (≈+100–200bps vs 2021) have tightened development feasibilities and NAVs; easing would restart pipelines. Strong labor and wage growth (unemployment 3.7% June 2025; AHE +3.9% YoY) support rent absorption, while supply chain/labor shortages lengthen schedules 3–9 months. Inflation (CPI ~3.4% 2024) lifts opex; CPI escalators and retrofit savings (10–25%) mitigate impact.
| Metric | Value |
|---|---|
| Fed funds | 5.25–5.50% (mid‑2025) |
| Unemployment | 3.7% (Jun 2025) |
| AHE | +3.9% YoY |
| CPI | ~3.4% (2024) |
| REIT mkt cap | ~$1.4T (2024) |
| Dry powder | ~$2.7T (H1 2024) |
Preview the Actual Deliverable
Dream PESTLE Analysis
The preview shown here is the exact Dream PESTLE Analysis document you’ll receive after purchase—fully formatted, professionally structured, and ready to use. No placeholders or teasers: this is the real file. After checkout you’ll instantly download this exact finished product.











