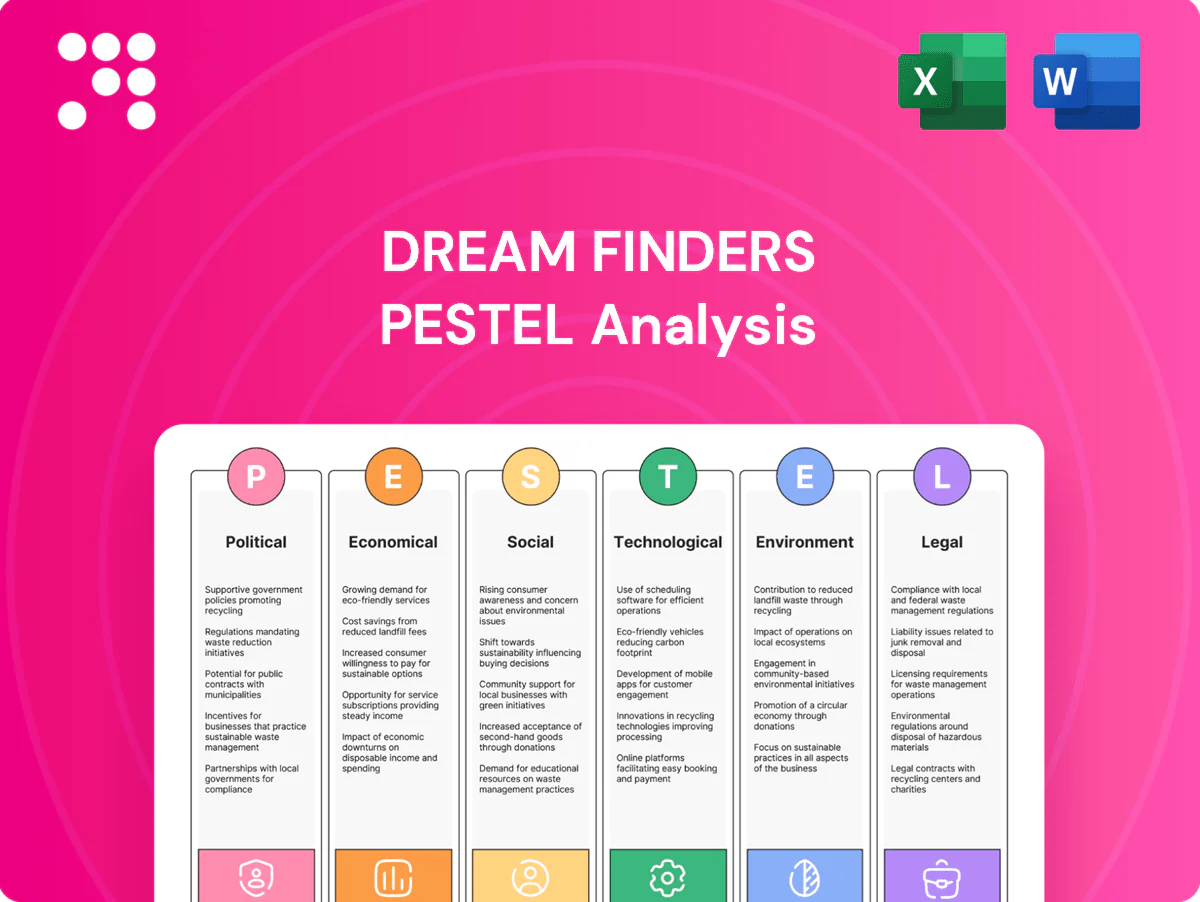
Dream Finders PESTLE Analysis

Plan Smarter. Present Sharper. Compete Stronger.
Unlock strategic clarity with our PESTLE Analysis tailored to Dream Finders—revealing how political shifts, economic trends, and regulatory changes affect growth. These concise insights help investors and planners spot risks and opportunities fast. Buy the full report for the complete, actionable breakdown and ready-to-use charts.
Political factors

Zoning and land-use approvals
Local councils in the Southeast, Southwest and Mid-Atlantic control zoning, density and permitting timelines that can accelerate or delay community launches; state laws such as California's SB9 and SB10 illustrate how policy can change supply rules. Proactive entitlement expertise shortens cycles that often span months and reduces holding costs, while federal incentives like 9% LIHTC and local density policies create new affordable or higher-density product opportunities.
Housing incentives and subsidies
State and municipal incentives, such as impact fee reductions (often ranging up to 100% in targeted zones) and tax abatements, materially improve project viability for Dream Finders Homes, headquartered in Jacksonville, FL.
Programs targeting workforce and entry-level housing align with Dream Finders’ customer mix and can be paired with Low-Income Housing Tax Credit structures to enhance returns.
Monitoring grant and bond availability, including municipal bond issuances for housing, can lower infrastructure costs, while policy reversals or mid-project budget cuts can remove expected benefits and increase project risk.

Infrastructure spending priorities
Roads, utilities and school funding determine where Dream Finders can feasibly place new subdivisions, with the Bipartisan Infrastructure Law (IIJA) totaling about 1.2 trillion USD—including roughly 110 billion USD for roads and bridges—able to unlock peripheral land by improving access. Aligning acquisitions with regional transportation plans and MPO priorities secures prime sites and reduces entitlement risk. Conversely, federal or state funding delays or reallocations can strand land positions and raise holding costs.

Immigration and labor policy
Construction labor availability for Dream Finders is sensitive to immigration enforcement and visa rules; US construction employment averaged about 7.6 million workers in 2024, and the H-2B nonimmigrant cap remains 66,000 annually (with occasional supplemental allocations), so tighter policies can raise wages and extend build cycles. Stable or expanded legal pathways support predictable staffing across trades while regional labor markets require market-specific workforce strategies.
- H-2B cap: 66,000
- US construction employment 2024: ~7.6M
- Outcome: tighter policy = higher wages, longer cycles
- Action: market-specific staffing
Trade and tariff exposure
Tariffs on lumber (duties up to about 20%) and steel (Section 232 at 25%) directly raise Dream Finders input costs and squeeze margins, while tariffs on finished goods elevate options and upgrade pricing. Policy volatility complicates bid pricing and option packages, increasing estimation risk for homebuilders. Strategic sourcing, material hedges and advocacy via trade groups (eg NAHB) help mitigate and anticipate regulatory shifts.
- Tariff exposure: lumber ~20%, steel 25%
- Impact: higher direct material costs, margin pressure
- Mitigants: strategic sourcing, hedging
- Engagement: trade-group advocacy to forecast policy moves
Zoning, incentives and IIJA unlock land; labor shortages and tariffs raise costs
Local zoning, state laws (eg SB9/SB10) and municipal incentives (impact fee reductions up to 100%) drive timing and feasibility; federal programs (IIJA ~1.2T USD, ~110B roads) unlock peripheral land. Construction labor (US 2024 ~7.6M; H-2B cap 66,000) and tariffs (lumber ~20%, steel 25%) affect costs and schedules.
| Policy | Key figure |
|---|---|
| IIJA | ~1.2T USD; roads ~110B |
| Construction employment 2024 | ~7.6M |
| H-2B cap | 66,000 |
| Tariffs | Lumber ~20% / Steel 25% |
What is included in the product
 Detailed Word Document
Explores how Political, Economic, Social, Technological, Environmental and Legal factors uniquely affect Dream Finders, with data‑backed, region‑specific insights and forward‑looking implications to identify risks and opportunities; formatted for executives and investors to use in business plans, decks, and scenario planning.

 Customizable Excel Spreadsheet
A concise, visually segmented PESTLE summary of Dream Finders that relieves meeting prep pain—editable for region or business-line notes, easily dropped into presentations, shared across teams, and used to drive quick risk and market-positioning discussions during planning sessions.
Economic factors

Mortgage rates and affordability
With the 30-year fixed near 7.0% (Freddie Mac, July 2025) interest levels directly raise monthly payments and lower qualification rates, compressing buyer pools. Volatile rates shift demand toward entry-level and active-adult segments while pressuring move-up buyers. Builder buydowns and incentives often bridge affordability gaps. Persistent high rates force tighter cost control and disciplined pricing to protect margins.
Labor and materials inflation
Input costs for framing, concrete and finishes—roughly 40–50% of direct construction costs—remain primary drivers of Dream Finders gross margins; material inflation peaked in 2021–22 but lumber prices fell ~40% from peak by 2024 while concrete and specialty finishes stay elevated. Supply‑chain normalization has eased national pressure, though regional shortages persist. Long‑term contracts and value engineering have preserved spreads, and granular cost tracking now guides lot releases and product mix decisions.

Regional job growth and migration
Sunbelt markets (Florida, Texas, Arizona, North Carolina) led domestic population gains through 2023, supporting diversified employment bases and strong local hiring. U.S. payrolls added about 2.7 million jobs in 2023 and unemployment was ~3.7% (BLS), underpinning household formation and absorption. Dream Finders uses market-by-market analytics to guide land acquisition and spec levels. During downturns rapid pace cuts preserve cash and margins.

Household income and savings
Rising household income—US median household income was $74,580 in 2023—alongside a personal saving rate near 4% in 2024 shapes down-payment capacity and upgrade demand; entry-level buyers remain most sensitive to shocks, making flexible floorplans and option tiers critical to capture varying budgets, while integrated mortgage and title services can streamline purchase decisions.
- Income: median HH income $74,580 (2023)
- Savings: personal saving rate ~4% (2024)
- Entry buyers: high shock sensitivity
- Strategy: flexible plans + mortgage/title integration
Credit availability and lending standards
Credit availability and secondary market appetite shape Dream Finders mortgage product breadth; 30‑year fixed rates ~6–7% in 2024–25 pressured affordability and narrowed options. Tighter underwriting lowered capture rates among first‑time buyers, while builder‑captive financing (DHI/Lennar models) can streamline approvals and speed closings. Monitoring credit spreads and delinquency trends informs incentive strategy.
- Secondary market: influences product breadth
- Tighter underwriting: lowers first‑time buyer capture
- Builder‑captive financing: faster approvals/closings
- Track credit spreads/delinquency to set incentives
Zoning, incentives and IIJA unlock land; labor shortages and tariffs raise costs
30-year fixed ~7.0% (Freddie Mac, Jul 2025) compresses buyer pools and shifts demand to entry/active-adult segments; builder buydowns/incentives bridge affordability. Material costs drive margins—lumber down ~40% from peak by 2024 while concrete/finishes remain elevated. Sunbelt job growth and median HH income $74,580 (2023) support absorption; saving rate ~4% (2024).
| Metric | Value |
|---|---|
| 30Y fixed | ~7.0% (Jul 2025) |
| Median HH income | $74,580 (2023) |
| Saving rate | ~4% (2024) |
| Lumber change | -40% from peak (2024) |
What You See Is What You Get
Dream Finders PESTLE Analysis
The Dream Finders PESTLE Analysis preview shown here is the exact document you’ll receive after purchase—fully formatted and ready to use. It contains the full political, economic, social, technological, legal, and environmental assessment as displayed. No placeholders or teasers—this is the final, professionally structured file you’ll download immediately after payment.

Plan Smarter. Present Sharper. Compete Stronger.
Unlock strategic clarity with our PESTLE Analysis tailored to Dream Finders—revealing how political shifts, economic trends, and regulatory changes affect growth. These concise insights help investors and planners spot risks and opportunities fast. Buy the full report for the complete, actionable breakdown and ready-to-use charts.
Political factors
Zoning and land-use approvals
Local councils in the Southeast, Southwest and Mid-Atlantic control zoning, density and permitting timelines that can accelerate or delay community launches; state laws such as California's SB9 and SB10 illustrate how policy can change supply rules. Proactive entitlement expertise shortens cycles that often span months and reduces holding costs, while federal incentives like 9% LIHTC and local density policies create new affordable or higher-density product opportunities.
Housing incentives and subsidies
State and municipal incentives, such as impact fee reductions (often ranging up to 100% in targeted zones) and tax abatements, materially improve project viability for Dream Finders Homes, headquartered in Jacksonville, FL.
Programs targeting workforce and entry-level housing align with Dream Finders’ customer mix and can be paired with Low-Income Housing Tax Credit structures to enhance returns.
Monitoring grant and bond availability, including municipal bond issuances for housing, can lower infrastructure costs, while policy reversals or mid-project budget cuts can remove expected benefits and increase project risk.
Infrastructure spending priorities
Roads, utilities and school funding determine where Dream Finders can feasibly place new subdivisions, with the Bipartisan Infrastructure Law (IIJA) totaling about 1.2 trillion USD—including roughly 110 billion USD for roads and bridges—able to unlock peripheral land by improving access. Aligning acquisitions with regional transportation plans and MPO priorities secures prime sites and reduces entitlement risk. Conversely, federal or state funding delays or reallocations can strand land positions and raise holding costs.
Immigration and labor policy
Construction labor availability for Dream Finders is sensitive to immigration enforcement and visa rules; US construction employment averaged about 7.6 million workers in 2024, and the H-2B nonimmigrant cap remains 66,000 annually (with occasional supplemental allocations), so tighter policies can raise wages and extend build cycles. Stable or expanded legal pathways support predictable staffing across trades while regional labor markets require market-specific workforce strategies.
- H-2B cap: 66,000
- US construction employment 2024: ~7.6M
- Outcome: tighter policy = higher wages, longer cycles
- Action: market-specific staffing
Trade and tariff exposure
Tariffs on lumber (duties up to about 20%) and steel (Section 232 at 25%) directly raise Dream Finders input costs and squeeze margins, while tariffs on finished goods elevate options and upgrade pricing. Policy volatility complicates bid pricing and option packages, increasing estimation risk for homebuilders. Strategic sourcing, material hedges and advocacy via trade groups (eg NAHB) help mitigate and anticipate regulatory shifts.
- Tariff exposure: lumber ~20%, steel 25%
- Impact: higher direct material costs, margin pressure
- Mitigants: strategic sourcing, hedging
- Engagement: trade-group advocacy to forecast policy moves
Zoning, incentives and IIJA unlock land; labor shortages and tariffs raise costs
Local zoning, state laws (eg SB9/SB10) and municipal incentives (impact fee reductions up to 100%) drive timing and feasibility; federal programs (IIJA ~1.2T USD, ~110B roads) unlock peripheral land. Construction labor (US 2024 ~7.6M; H-2B cap 66,000) and tariffs (lumber ~20%, steel 25%) affect costs and schedules.
| Policy | Key figure |
|---|---|
| IIJA | ~1.2T USD; roads ~110B |
| Construction employment 2024 | ~7.6M |
| H-2B cap | 66,000 |
| Tariffs | Lumber ~20% / Steel 25% |
What is included in the product
Detailed Word Document
Explores how Political, Economic, Social, Technological, Environmental and Legal factors uniquely affect Dream Finders, with data‑backed, region‑specific insights and forward‑looking implications to identify risks and opportunities; formatted for executives and investors to use in business plans, decks, and scenario planning.
Customizable Excel Spreadsheet
A concise, visually segmented PESTLE summary of Dream Finders that relieves meeting prep pain—editable for region or business-line notes, easily dropped into presentations, shared across teams, and used to drive quick risk and market-positioning discussions during planning sessions.
Economic factors
Mortgage rates and affordability
With the 30-year fixed near 7.0% (Freddie Mac, July 2025) interest levels directly raise monthly payments and lower qualification rates, compressing buyer pools. Volatile rates shift demand toward entry-level and active-adult segments while pressuring move-up buyers. Builder buydowns and incentives often bridge affordability gaps. Persistent high rates force tighter cost control and disciplined pricing to protect margins.
Labor and materials inflation
Input costs for framing, concrete and finishes—roughly 40–50% of direct construction costs—remain primary drivers of Dream Finders gross margins; material inflation peaked in 2021–22 but lumber prices fell ~40% from peak by 2024 while concrete and specialty finishes stay elevated. Supply‑chain normalization has eased national pressure, though regional shortages persist. Long‑term contracts and value engineering have preserved spreads, and granular cost tracking now guides lot releases and product mix decisions.
Regional job growth and migration
Sunbelt markets (Florida, Texas, Arizona, North Carolina) led domestic population gains through 2023, supporting diversified employment bases and strong local hiring. U.S. payrolls added about 2.7 million jobs in 2023 and unemployment was ~3.7% (BLS), underpinning household formation and absorption. Dream Finders uses market-by-market analytics to guide land acquisition and spec levels. During downturns rapid pace cuts preserve cash and margins.
Household income and savings
Rising household income—US median household income was $74,580 in 2023—alongside a personal saving rate near 4% in 2024 shapes down-payment capacity and upgrade demand; entry-level buyers remain most sensitive to shocks, making flexible floorplans and option tiers critical to capture varying budgets, while integrated mortgage and title services can streamline purchase decisions.
- Income: median HH income $74,580 (2023)
- Savings: personal saving rate ~4% (2024)
- Entry buyers: high shock sensitivity
- Strategy: flexible plans + mortgage/title integration
Credit availability and lending standards
Credit availability and secondary market appetite shape Dream Finders mortgage product breadth; 30‑year fixed rates ~6–7% in 2024–25 pressured affordability and narrowed options. Tighter underwriting lowered capture rates among first‑time buyers, while builder‑captive financing (DHI/Lennar models) can streamline approvals and speed closings. Monitoring credit spreads and delinquency trends informs incentive strategy.
- Secondary market: influences product breadth
- Tighter underwriting: lowers first‑time buyer capture
- Builder‑captive financing: faster approvals/closings
- Track credit spreads/delinquency to set incentives
Zoning, incentives and IIJA unlock land; labor shortages and tariffs raise costs
30-year fixed ~7.0% (Freddie Mac, Jul 2025) compresses buyer pools and shifts demand to entry/active-adult segments; builder buydowns/incentives bridge affordability. Material costs drive margins—lumber down ~40% from peak by 2024 while concrete/finishes remain elevated. Sunbelt job growth and median HH income $74,580 (2023) support absorption; saving rate ~4% (2024).
| Metric | Value |
|---|---|
| 30Y fixed | ~7.0% (Jul 2025) |
| Median HH income | $74,580 (2023) |
| Saving rate | ~4% (2024) |
| Lumber change | -40% from peak (2024) |
What You See Is What You Get
Dream Finders PESTLE Analysis
The Dream Finders PESTLE Analysis preview shown here is the exact document you’ll receive after purchase—fully formatted and ready to use. It contains the full political, economic, social, technological, legal, and environmental assessment as displayed. No placeholders or teasers—this is the final, professionally structured file you’ll download immediately after payment.
Original: $10.00
-65%$10.00
$3.50Description
Plan Smarter. Present Sharper. Compete Stronger.
Unlock strategic clarity with our PESTLE Analysis tailored to Dream Finders—revealing how political shifts, economic trends, and regulatory changes affect growth. These concise insights help investors and planners spot risks and opportunities fast. Buy the full report for the complete, actionable breakdown and ready-to-use charts.
Political factors
Zoning and land-use approvals
Local councils in the Southeast, Southwest and Mid-Atlantic control zoning, density and permitting timelines that can accelerate or delay community launches; state laws such as California's SB9 and SB10 illustrate how policy can change supply rules. Proactive entitlement expertise shortens cycles that often span months and reduces holding costs, while federal incentives like 9% LIHTC and local density policies create new affordable or higher-density product opportunities.
Housing incentives and subsidies
State and municipal incentives, such as impact fee reductions (often ranging up to 100% in targeted zones) and tax abatements, materially improve project viability for Dream Finders Homes, headquartered in Jacksonville, FL.
Programs targeting workforce and entry-level housing align with Dream Finders’ customer mix and can be paired with Low-Income Housing Tax Credit structures to enhance returns.
Monitoring grant and bond availability, including municipal bond issuances for housing, can lower infrastructure costs, while policy reversals or mid-project budget cuts can remove expected benefits and increase project risk.
Infrastructure spending priorities
Roads, utilities and school funding determine where Dream Finders can feasibly place new subdivisions, with the Bipartisan Infrastructure Law (IIJA) totaling about 1.2 trillion USD—including roughly 110 billion USD for roads and bridges—able to unlock peripheral land by improving access. Aligning acquisitions with regional transportation plans and MPO priorities secures prime sites and reduces entitlement risk. Conversely, federal or state funding delays or reallocations can strand land positions and raise holding costs.
Immigration and labor policy
Construction labor availability for Dream Finders is sensitive to immigration enforcement and visa rules; US construction employment averaged about 7.6 million workers in 2024, and the H-2B nonimmigrant cap remains 66,000 annually (with occasional supplemental allocations), so tighter policies can raise wages and extend build cycles. Stable or expanded legal pathways support predictable staffing across trades while regional labor markets require market-specific workforce strategies.
- H-2B cap: 66,000
- US construction employment 2024: ~7.6M
- Outcome: tighter policy = higher wages, longer cycles
- Action: market-specific staffing
Trade and tariff exposure
Tariffs on lumber (duties up to about 20%) and steel (Section 232 at 25%) directly raise Dream Finders input costs and squeeze margins, while tariffs on finished goods elevate options and upgrade pricing. Policy volatility complicates bid pricing and option packages, increasing estimation risk for homebuilders. Strategic sourcing, material hedges and advocacy via trade groups (eg NAHB) help mitigate and anticipate regulatory shifts.
- Tariff exposure: lumber ~20%, steel 25%
- Impact: higher direct material costs, margin pressure
- Mitigants: strategic sourcing, hedging
- Engagement: trade-group advocacy to forecast policy moves
Zoning, incentives and IIJA unlock land; labor shortages and tariffs raise costs
Local zoning, state laws (eg SB9/SB10) and municipal incentives (impact fee reductions up to 100%) drive timing and feasibility; federal programs (IIJA ~1.2T USD, ~110B roads) unlock peripheral land. Construction labor (US 2024 ~7.6M; H-2B cap 66,000) and tariffs (lumber ~20%, steel 25%) affect costs and schedules.
| Policy | Key figure |
|---|---|
| IIJA | ~1.2T USD; roads ~110B |
| Construction employment 2024 | ~7.6M |
| H-2B cap | 66,000 |
| Tariffs | Lumber ~20% / Steel 25% |
What is included in the product
Detailed Word Document
Explores how Political, Economic, Social, Technological, Environmental and Legal factors uniquely affect Dream Finders, with data‑backed, region‑specific insights and forward‑looking implications to identify risks and opportunities; formatted for executives and investors to use in business plans, decks, and scenario planning.
Customizable Excel Spreadsheet
A concise, visually segmented PESTLE summary of Dream Finders that relieves meeting prep pain—editable for region or business-line notes, easily dropped into presentations, shared across teams, and used to drive quick risk and market-positioning discussions during planning sessions.
Economic factors
Mortgage rates and affordability
With the 30-year fixed near 7.0% (Freddie Mac, July 2025) interest levels directly raise monthly payments and lower qualification rates, compressing buyer pools. Volatile rates shift demand toward entry-level and active-adult segments while pressuring move-up buyers. Builder buydowns and incentives often bridge affordability gaps. Persistent high rates force tighter cost control and disciplined pricing to protect margins.
Labor and materials inflation
Input costs for framing, concrete and finishes—roughly 40–50% of direct construction costs—remain primary drivers of Dream Finders gross margins; material inflation peaked in 2021–22 but lumber prices fell ~40% from peak by 2024 while concrete and specialty finishes stay elevated. Supply‑chain normalization has eased national pressure, though regional shortages persist. Long‑term contracts and value engineering have preserved spreads, and granular cost tracking now guides lot releases and product mix decisions.
Regional job growth and migration
Sunbelt markets (Florida, Texas, Arizona, North Carolina) led domestic population gains through 2023, supporting diversified employment bases and strong local hiring. U.S. payrolls added about 2.7 million jobs in 2023 and unemployment was ~3.7% (BLS), underpinning household formation and absorption. Dream Finders uses market-by-market analytics to guide land acquisition and spec levels. During downturns rapid pace cuts preserve cash and margins.
Household income and savings
Rising household income—US median household income was $74,580 in 2023—alongside a personal saving rate near 4% in 2024 shapes down-payment capacity and upgrade demand; entry-level buyers remain most sensitive to shocks, making flexible floorplans and option tiers critical to capture varying budgets, while integrated mortgage and title services can streamline purchase decisions.
- Income: median HH income $74,580 (2023)
- Savings: personal saving rate ~4% (2024)
- Entry buyers: high shock sensitivity
- Strategy: flexible plans + mortgage/title integration
Credit availability and lending standards
Credit availability and secondary market appetite shape Dream Finders mortgage product breadth; 30‑year fixed rates ~6–7% in 2024–25 pressured affordability and narrowed options. Tighter underwriting lowered capture rates among first‑time buyers, while builder‑captive financing (DHI/Lennar models) can streamline approvals and speed closings. Monitoring credit spreads and delinquency trends informs incentive strategy.
- Secondary market: influences product breadth
- Tighter underwriting: lowers first‑time buyer capture
- Builder‑captive financing: faster approvals/closings
- Track credit spreads/delinquency to set incentives
Zoning, incentives and IIJA unlock land; labor shortages and tariffs raise costs
30-year fixed ~7.0% (Freddie Mac, Jul 2025) compresses buyer pools and shifts demand to entry/active-adult segments; builder buydowns/incentives bridge affordability. Material costs drive margins—lumber down ~40% from peak by 2024 while concrete/finishes remain elevated. Sunbelt job growth and median HH income $74,580 (2023) support absorption; saving rate ~4% (2024).
| Metric | Value |
|---|---|
| 30Y fixed | ~7.0% (Jul 2025) |
| Median HH income | $74,580 (2023) |
| Saving rate | ~4% (2024) |
| Lumber change | -40% from peak (2024) |
What You See Is What You Get
Dream Finders PESTLE Analysis
The Dream Finders PESTLE Analysis preview shown here is the exact document you’ll receive after purchase—fully formatted and ready to use. It contains the full political, economic, social, technological, legal, and environmental assessment as displayed. No placeholders or teasers—this is the final, professionally structured file you’ll download immediately after payment.











