Driven Brands SWOT Analysis

Dive Deeper Into the Company’s Strategic Blueprint
Driven Brands combines scale, a resilient franchise model, and acquisitive growth with margin benefits from diversified auto-service offerings, but faces economic sensitivity, intense competition, and integration risks; discover the full SWOT—professionally formatted Word + Excel—to unlock actionable strategies and investor-grade insights for confident decisions.
Strengths

Diversified service portfolio
Coverage across maintenance, paint, collision and car wash reduces reliance on any single segment, with Driven Brands operating 18+ brands and over 5,000 locations. Diversification smooths revenue through cycles as consumer spend shifts between discretionary and non-discretionary services. Cross-brand customer capture increases wallet share via repeat visits and bundled offerings. The portfolio also broadens relationships with insurers, fleet partners and consumers, supporting scale in claims and fleet programs.
Asset-light franchise model
Driven Brands' asset-light franchise model accelerated unit growth to roughly 5,200 locations by mid-2024, minimizing corporate capital deployment while expanding footprint. Local owner-operators boost execution and market responsiveness, reflected in segment-level revenue resilience. Royalties and advertised fund inflows deliver stable recurring cash, allowing corporate to allocate capital to brand, technology and supply-chain scale.

Scale-driven procurement and marketing
Centralized sourcing across Driven Brands' network of over 5,000 service locations lowers parts, paint and consumables costs for franchisees through volume purchasing and standardization. National marketing and CRM programs drive brand awareness and local demand by coordinating campaigns and customer retention tools across brands. Scale also secures preferred insurer and fleet partnerships, creating a durable competitive moat versus smaller regional competitors.

Strong brand portfolio and recognition
Driven Brands operates multiple well-known banners including Meineke, Maaco, CARSTAR, Take 5 Oil Change and Mister Car Wash, each targeting distinct customer needs and price points. Strong brand equity drives higher conversion and retention, notably in collision services and car wash membership programs. Differentiated positioning lets the company run targeted promotions without diluting the parent brand while enabling cross-promotions and bundled offers across its portfolio.
- Multi-banner reach
- Higher conversion & retention
- Targeted promotions
- Cross-promotions & bundles
Data, technology, and operational toolset
Unified POS, scheduling, and CRM platforms at Driven Brands boost throughput and customer experience, supporting operations across its ~4,400+ franchise and company locations (2024 figure).
Data insights inform dynamic pricing, labor scheduling, and inventory turns, improving margins and same-store efficiency.
Digital booking and membership management drive repeat visits while standardized playbooks raise franchise performance consistency.
- Unified POS/CRM: company-wide consistency
- Data-driven: pricing, labor, inventory optimization
- Digital bookings: higher retention
- Playbooks: standardized franchise performance
18+ brands, ~5,200 locations: asset-light franchise model driving recurring royalty growth
Driven Brands operates 18+ brands and over 5,200 locations (mid-2024), reducing segment concentration and smoothing revenue across maintenance, paint, collision and car wash. An asset-light franchise model (~4,400+ franchised/company locations in 2024) drives rapid unit growth, recurring royalty cashflows and local execution. Centralized sourcing, unified POS/CRM and national marketing lower costs and boost retention.
| Metric | Value (2024) |
|---|---|
| Brands | 18+ |
| Locations (mid-2024) | ~5,200 |
| Franchised/company sites (2024) | ~4,400+ |
What is included in the product
 Detailed Word Document
Provides a concise SWOT analysis of Driven Brands, highlighting strengths like scale, franchise network and recurring service revenue; weaknesses such as exposure to labor/material costs and integration risks; opportunities in service diversification and international growth; and threats from economic cycles and competitive pressure.

 Customizable Excel Spreadsheet
Provides a concise SWOT matrix for Driven Brands to quickly pinpoint strengths, weaknesses, opportunities, and threats, easing cross-team alignment and accelerating strategic decision-making.
Weaknesses

Franchisee execution variability
Outcomes depend heavily on local operators across Driven Brands' 5,000+ locations (company disclosure through 2024), producing uneven service quality and localized performance gaps. Inconsistent experiences risk eroding brand trust and compressing NPS, forcing corporate to invest in monitoring that raises G&A and operating overhead. Scaling training and compliance across a vast network creates persistent executional complexity and capitalizes on limited centralized control.
Exposure to discretionary categories
Car wash and cosmetic paint services at Driven Brands are highly sensitive to consumer spending cycles, so traffic and average ticket sizes can soften in downturns; the company operates roughly 5,800 locations as of 2024, concentrating exposure in discretionary categories.
Greater reliance on promotions to sustain volume can compress margins, and mix shifts toward lower-margin services can destabilize unit-level economics, pressuring franchisee and corporate profitability.

Collision reimbursement and cycle times
Reliance on insurer relationships exposes Driven Brands margins to reimbursement pressure, as negotiated DRP rates directly affect repair revenue. Parts delays and technician bottlenecks can lengthen cycle times, and Driven Brands' ~4,800 locations and 2024 revenue of about $2.3B magnify throughput impacts across the network. Longer keys-to-keys erode customer satisfaction and DRP standing, while throughput variability hits franchisee profitability.

Capital intensity in owned formats
Company-operated flagship car washes demand heavy upfront capex—industry estimates range $500k–$2M per site—with payback typically 3–7 years; Driven Brands’ owned-format exposure raises balance-sheet and payback risk. Site acquisition, permitting and specialized equipment heighten cost and timing variability, while weather-driven seasonal swings can cut revenue by up to ~20–30% in colder months.
- High capex: $500k–$2M per site
- Payback: 3–7 years
- Weather impact: revenue down ~20–30%
- Franchise/owned mix must be optimized
Integration and brand complexity
Driven Brands, traded on NASDAQ as DRVN, faces integration and brand complexity as multiple acquisitions—including Meineke, Maaco, CARSTAR and Take 5—create overlapping processes and systems; aligning tech stacks, supply contracts and culture materially extends integration timelines and raises costs. Brand proliferation can confuse consumers and dilute marketing ROI, while governance layers increase operational risk.
- Overlapping systems
- Lengthy tech/supply integration
- Diluted marketing efficiency
- Higher governance risk
5,800+ sites, $2.3B rev, capex & seasonality hit margins
Driven Brands' 5,800+ locations (2024) create uneven service quality and monitoring-driven G&A; 2024 revenue ~ $2.3B magnifies throughput and DRP risks. Heavy capex for owned washes ($500k–$2M; 3–7yr payback) and seasonal revenue swings (~20–30% down) compress returns. Reliance on insurer reimbursements and promo-driven volume pressures margins while multi-brand integrations raise IT, supply and governance costs.
| Metric | Value |
|---|---|
| Locations | ~5,800 (2024) |
| Revenue | ~$2.3B (2024) |
| Capex/site | $500k–$2M |
| Payback | 3–7 years |
| Seasonal decline | ~20–30% |
Same Document Delivered
Driven Brands SWOT Analysis
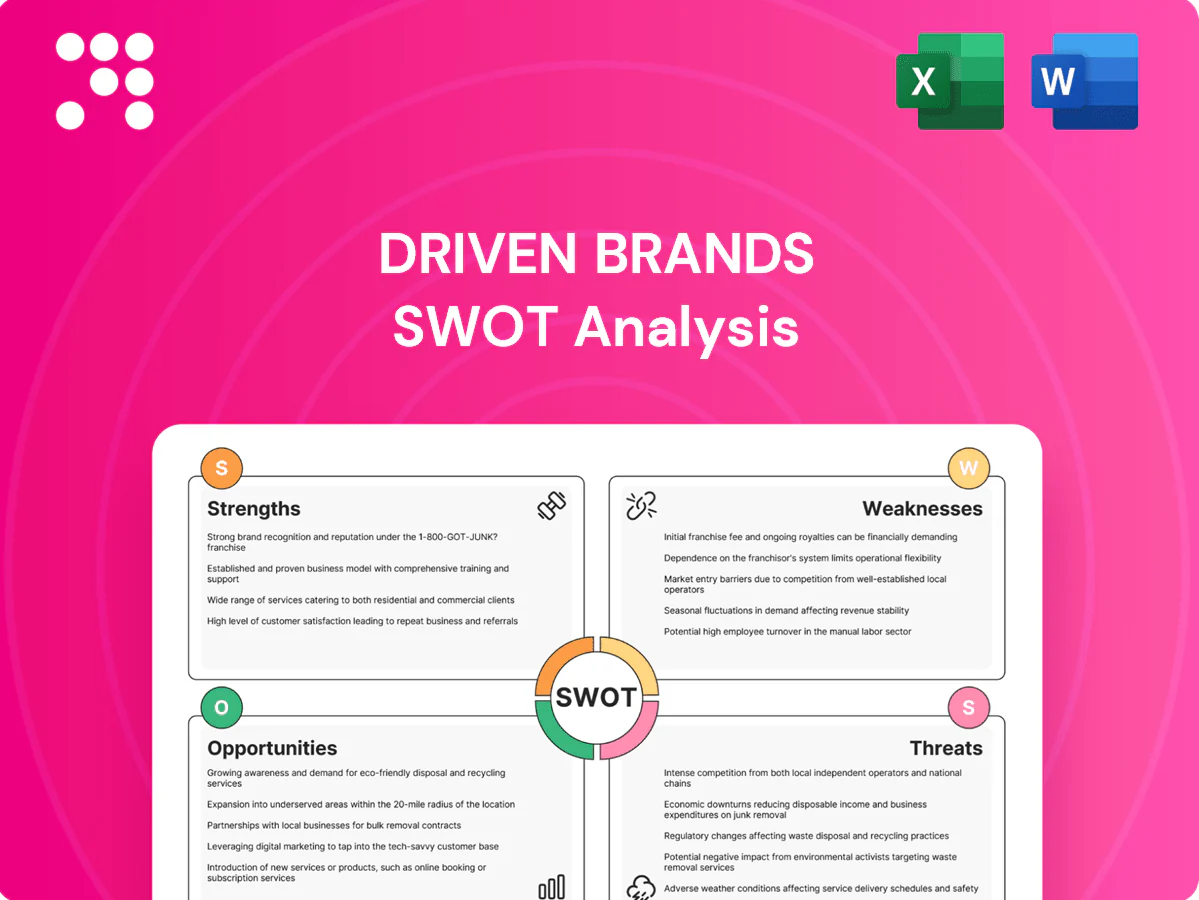
This is the actual SWOT analysis document you’ll receive upon purchase—no surprises, just professional quality. The preview below is taken directly from the full SWOT report for Driven Brands; purchase unlocks the entire in-depth, editable version. Use it for strategic planning, valuation, or presentations.

Dive Deeper Into the Company’s Strategic Blueprint
Driven Brands combines scale, a resilient franchise model, and acquisitive growth with margin benefits from diversified auto-service offerings, but faces economic sensitivity, intense competition, and integration risks; discover the full SWOT—professionally formatted Word + Excel—to unlock actionable strategies and investor-grade insights for confident decisions.
Strengths
Diversified service portfolio
Coverage across maintenance, paint, collision and car wash reduces reliance on any single segment, with Driven Brands operating 18+ brands and over 5,000 locations. Diversification smooths revenue through cycles as consumer spend shifts between discretionary and non-discretionary services. Cross-brand customer capture increases wallet share via repeat visits and bundled offerings. The portfolio also broadens relationships with insurers, fleet partners and consumers, supporting scale in claims and fleet programs.
Asset-light franchise model
Driven Brands' asset-light franchise model accelerated unit growth to roughly 5,200 locations by mid-2024, minimizing corporate capital deployment while expanding footprint. Local owner-operators boost execution and market responsiveness, reflected in segment-level revenue resilience. Royalties and advertised fund inflows deliver stable recurring cash, allowing corporate to allocate capital to brand, technology and supply-chain scale.
Scale-driven procurement and marketing
Centralized sourcing across Driven Brands' network of over 5,000 service locations lowers parts, paint and consumables costs for franchisees through volume purchasing and standardization. National marketing and CRM programs drive brand awareness and local demand by coordinating campaigns and customer retention tools across brands. Scale also secures preferred insurer and fleet partnerships, creating a durable competitive moat versus smaller regional competitors.
Strong brand portfolio and recognition
Driven Brands operates multiple well-known banners including Meineke, Maaco, CARSTAR, Take 5 Oil Change and Mister Car Wash, each targeting distinct customer needs and price points. Strong brand equity drives higher conversion and retention, notably in collision services and car wash membership programs. Differentiated positioning lets the company run targeted promotions without diluting the parent brand while enabling cross-promotions and bundled offers across its portfolio.
- Multi-banner reach
- Higher conversion & retention
- Targeted promotions
- Cross-promotions & bundles
Data, technology, and operational toolset
Unified POS, scheduling, and CRM platforms at Driven Brands boost throughput and customer experience, supporting operations across its ~4,400+ franchise and company locations (2024 figure).
Data insights inform dynamic pricing, labor scheduling, and inventory turns, improving margins and same-store efficiency.
Digital booking and membership management drive repeat visits while standardized playbooks raise franchise performance consistency.
- Unified POS/CRM: company-wide consistency
- Data-driven: pricing, labor, inventory optimization
- Digital bookings: higher retention
- Playbooks: standardized franchise performance
18+ brands, ~5,200 locations: asset-light franchise model driving recurring royalty growth
Driven Brands operates 18+ brands and over 5,200 locations (mid-2024), reducing segment concentration and smoothing revenue across maintenance, paint, collision and car wash. An asset-light franchise model (~4,400+ franchised/company locations in 2024) drives rapid unit growth, recurring royalty cashflows and local execution. Centralized sourcing, unified POS/CRM and national marketing lower costs and boost retention.
| Metric | Value (2024) |
|---|---|
| Brands | 18+ |
| Locations (mid-2024) | ~5,200 |
| Franchised/company sites (2024) | ~4,400+ |
What is included in the product
Detailed Word Document
Provides a concise SWOT analysis of Driven Brands, highlighting strengths like scale, franchise network and recurring service revenue; weaknesses such as exposure to labor/material costs and integration risks; opportunities in service diversification and international growth; and threats from economic cycles and competitive pressure.
Customizable Excel Spreadsheet
Provides a concise SWOT matrix for Driven Brands to quickly pinpoint strengths, weaknesses, opportunities, and threats, easing cross-team alignment and accelerating strategic decision-making.
Weaknesses
Franchisee execution variability
Outcomes depend heavily on local operators across Driven Brands' 5,000+ locations (company disclosure through 2024), producing uneven service quality and localized performance gaps. Inconsistent experiences risk eroding brand trust and compressing NPS, forcing corporate to invest in monitoring that raises G&A and operating overhead. Scaling training and compliance across a vast network creates persistent executional complexity and capitalizes on limited centralized control.
Exposure to discretionary categories
Car wash and cosmetic paint services at Driven Brands are highly sensitive to consumer spending cycles, so traffic and average ticket sizes can soften in downturns; the company operates roughly 5,800 locations as of 2024, concentrating exposure in discretionary categories.
Greater reliance on promotions to sustain volume can compress margins, and mix shifts toward lower-margin services can destabilize unit-level economics, pressuring franchisee and corporate profitability.
Collision reimbursement and cycle times
Reliance on insurer relationships exposes Driven Brands margins to reimbursement pressure, as negotiated DRP rates directly affect repair revenue. Parts delays and technician bottlenecks can lengthen cycle times, and Driven Brands' ~4,800 locations and 2024 revenue of about $2.3B magnify throughput impacts across the network. Longer keys-to-keys erode customer satisfaction and DRP standing, while throughput variability hits franchisee profitability.
Capital intensity in owned formats
Company-operated flagship car washes demand heavy upfront capex—industry estimates range $500k–$2M per site—with payback typically 3–7 years; Driven Brands’ owned-format exposure raises balance-sheet and payback risk. Site acquisition, permitting and specialized equipment heighten cost and timing variability, while weather-driven seasonal swings can cut revenue by up to ~20–30% in colder months.
- High capex: $500k–$2M per site
- Payback: 3–7 years
- Weather impact: revenue down ~20–30%
- Franchise/owned mix must be optimized
Integration and brand complexity
Driven Brands, traded on NASDAQ as DRVN, faces integration and brand complexity as multiple acquisitions—including Meineke, Maaco, CARSTAR and Take 5—create overlapping processes and systems; aligning tech stacks, supply contracts and culture materially extends integration timelines and raises costs. Brand proliferation can confuse consumers and dilute marketing ROI, while governance layers increase operational risk.
- Overlapping systems
- Lengthy tech/supply integration
- Diluted marketing efficiency
- Higher governance risk
5,800+ sites, $2.3B rev, capex & seasonality hit margins
Driven Brands' 5,800+ locations (2024) create uneven service quality and monitoring-driven G&A; 2024 revenue ~ $2.3B magnifies throughput and DRP risks. Heavy capex for owned washes ($500k–$2M; 3–7yr payback) and seasonal revenue swings (~20–30% down) compress returns. Reliance on insurer reimbursements and promo-driven volume pressures margins while multi-brand integrations raise IT, supply and governance costs.
| Metric | Value |
|---|---|
| Locations | ~5,800 (2024) |
| Revenue | ~$2.3B (2024) |
| Capex/site | $500k–$2M |
| Payback | 3–7 years |
| Seasonal decline | ~20–30% |
Same Document Delivered
Driven Brands SWOT Analysis
This is the actual SWOT analysis document you’ll receive upon purchase—no surprises, just professional quality. The preview below is taken directly from the full SWOT report for Driven Brands; purchase unlocks the entire in-depth, editable version. Use it for strategic planning, valuation, or presentations.
Description
Dive Deeper Into the Company’s Strategic Blueprint
Driven Brands combines scale, a resilient franchise model, and acquisitive growth with margin benefits from diversified auto-service offerings, but faces economic sensitivity, intense competition, and integration risks; discover the full SWOT—professionally formatted Word + Excel—to unlock actionable strategies and investor-grade insights for confident decisions.
Strengths
Diversified service portfolio
Coverage across maintenance, paint, collision and car wash reduces reliance on any single segment, with Driven Brands operating 18+ brands and over 5,000 locations. Diversification smooths revenue through cycles as consumer spend shifts between discretionary and non-discretionary services. Cross-brand customer capture increases wallet share via repeat visits and bundled offerings. The portfolio also broadens relationships with insurers, fleet partners and consumers, supporting scale in claims and fleet programs.
Asset-light franchise model
Driven Brands' asset-light franchise model accelerated unit growth to roughly 5,200 locations by mid-2024, minimizing corporate capital deployment while expanding footprint. Local owner-operators boost execution and market responsiveness, reflected in segment-level revenue resilience. Royalties and advertised fund inflows deliver stable recurring cash, allowing corporate to allocate capital to brand, technology and supply-chain scale.
Scale-driven procurement and marketing
Centralized sourcing across Driven Brands' network of over 5,000 service locations lowers parts, paint and consumables costs for franchisees through volume purchasing and standardization. National marketing and CRM programs drive brand awareness and local demand by coordinating campaigns and customer retention tools across brands. Scale also secures preferred insurer and fleet partnerships, creating a durable competitive moat versus smaller regional competitors.
Strong brand portfolio and recognition
Driven Brands operates multiple well-known banners including Meineke, Maaco, CARSTAR, Take 5 Oil Change and Mister Car Wash, each targeting distinct customer needs and price points. Strong brand equity drives higher conversion and retention, notably in collision services and car wash membership programs. Differentiated positioning lets the company run targeted promotions without diluting the parent brand while enabling cross-promotions and bundled offers across its portfolio.
- Multi-banner reach
- Higher conversion & retention
- Targeted promotions
- Cross-promotions & bundles
Data, technology, and operational toolset
Unified POS, scheduling, and CRM platforms at Driven Brands boost throughput and customer experience, supporting operations across its ~4,400+ franchise and company locations (2024 figure).
Data insights inform dynamic pricing, labor scheduling, and inventory turns, improving margins and same-store efficiency.
Digital booking and membership management drive repeat visits while standardized playbooks raise franchise performance consistency.
- Unified POS/CRM: company-wide consistency
- Data-driven: pricing, labor, inventory optimization
- Digital bookings: higher retention
- Playbooks: standardized franchise performance
18+ brands, ~5,200 locations: asset-light franchise model driving recurring royalty growth
Driven Brands operates 18+ brands and over 5,200 locations (mid-2024), reducing segment concentration and smoothing revenue across maintenance, paint, collision and car wash. An asset-light franchise model (~4,400+ franchised/company locations in 2024) drives rapid unit growth, recurring royalty cashflows and local execution. Centralized sourcing, unified POS/CRM and national marketing lower costs and boost retention.
| Metric | Value (2024) |
|---|---|
| Brands | 18+ |
| Locations (mid-2024) | ~5,200 |
| Franchised/company sites (2024) | ~4,400+ |
What is included in the product
Detailed Word Document
Provides a concise SWOT analysis of Driven Brands, highlighting strengths like scale, franchise network and recurring service revenue; weaknesses such as exposure to labor/material costs and integration risks; opportunities in service diversification and international growth; and threats from economic cycles and competitive pressure.
Customizable Excel Spreadsheet
Provides a concise SWOT matrix for Driven Brands to quickly pinpoint strengths, weaknesses, opportunities, and threats, easing cross-team alignment and accelerating strategic decision-making.
Weaknesses
Franchisee execution variability
Outcomes depend heavily on local operators across Driven Brands' 5,000+ locations (company disclosure through 2024), producing uneven service quality and localized performance gaps. Inconsistent experiences risk eroding brand trust and compressing NPS, forcing corporate to invest in monitoring that raises G&A and operating overhead. Scaling training and compliance across a vast network creates persistent executional complexity and capitalizes on limited centralized control.
Exposure to discretionary categories
Car wash and cosmetic paint services at Driven Brands are highly sensitive to consumer spending cycles, so traffic and average ticket sizes can soften in downturns; the company operates roughly 5,800 locations as of 2024, concentrating exposure in discretionary categories.
Greater reliance on promotions to sustain volume can compress margins, and mix shifts toward lower-margin services can destabilize unit-level economics, pressuring franchisee and corporate profitability.
Collision reimbursement and cycle times
Reliance on insurer relationships exposes Driven Brands margins to reimbursement pressure, as negotiated DRP rates directly affect repair revenue. Parts delays and technician bottlenecks can lengthen cycle times, and Driven Brands' ~4,800 locations and 2024 revenue of about $2.3B magnify throughput impacts across the network. Longer keys-to-keys erode customer satisfaction and DRP standing, while throughput variability hits franchisee profitability.
Capital intensity in owned formats
Company-operated flagship car washes demand heavy upfront capex—industry estimates range $500k–$2M per site—with payback typically 3–7 years; Driven Brands’ owned-format exposure raises balance-sheet and payback risk. Site acquisition, permitting and specialized equipment heighten cost and timing variability, while weather-driven seasonal swings can cut revenue by up to ~20–30% in colder months.
- High capex: $500k–$2M per site
- Payback: 3–7 years
- Weather impact: revenue down ~20–30%
- Franchise/owned mix must be optimized
Integration and brand complexity
Driven Brands, traded on NASDAQ as DRVN, faces integration and brand complexity as multiple acquisitions—including Meineke, Maaco, CARSTAR and Take 5—create overlapping processes and systems; aligning tech stacks, supply contracts and culture materially extends integration timelines and raises costs. Brand proliferation can confuse consumers and dilute marketing ROI, while governance layers increase operational risk.
- Overlapping systems
- Lengthy tech/supply integration
- Diluted marketing efficiency
- Higher governance risk
5,800+ sites, $2.3B rev, capex & seasonality hit margins
Driven Brands' 5,800+ locations (2024) create uneven service quality and monitoring-driven G&A; 2024 revenue ~ $2.3B magnifies throughput and DRP risks. Heavy capex for owned washes ($500k–$2M; 3–7yr payback) and seasonal revenue swings (~20–30% down) compress returns. Reliance on insurer reimbursements and promo-driven volume pressures margins while multi-brand integrations raise IT, supply and governance costs.
| Metric | Value |
|---|---|
| Locations | ~5,800 (2024) |
| Revenue | ~$2.3B (2024) |
| Capex/site | $500k–$2M |
| Payback | 3–7 years |
| Seasonal decline | ~20–30% |
Same Document Delivered
Driven Brands SWOT Analysis
This is the actual SWOT analysis document you’ll receive upon purchase—no surprises, just professional quality. The preview below is taken directly from the full SWOT report for Driven Brands; purchase unlocks the entire in-depth, editable version. Use it for strategic planning, valuation, or presentations.











