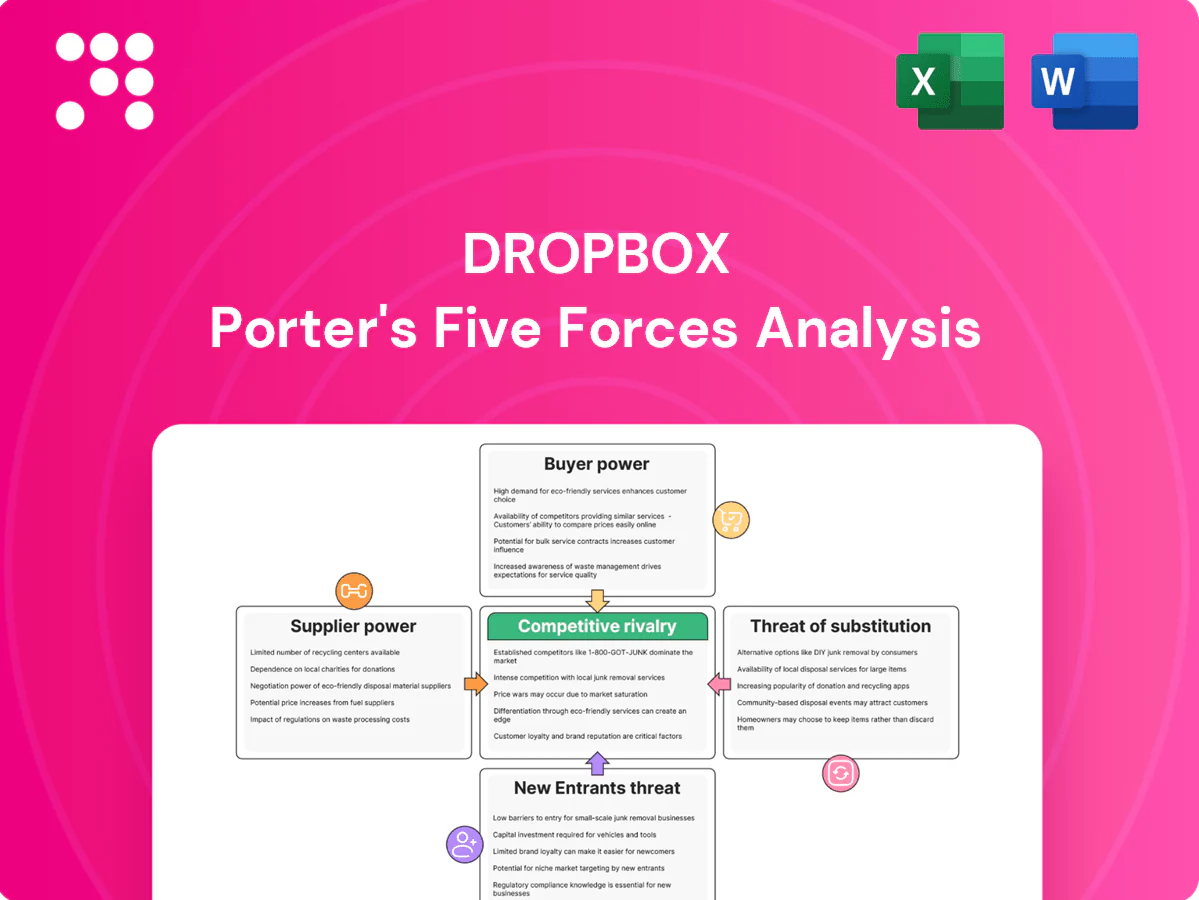
Dropbox Porter's Five Forces Analysis

A Must-Have Tool for Decision-Makers
Dropbox faces intense competitive rivalry from cloud storage and collaboration rivals, moderate buyer power driven by switching options, manageable supplier power, a moderate threat of new entrants, and meaningful substitute pressures from alternative collaboration tools. This snapshot highlights key pressures but only scratches the surface. Unlock the full Porter's Five Forces Analysis to explore force-by-force ratings, visuals, and strategic implications for Dropbox.
Suppliers Bargaining Power

Global infrastructure vendors
Dropbox depends on data center operators, server OEMs, storage-component suppliers and network providers to run at scale, and industry research shows the top three server OEMs account for roughly half of global shipments (IDC, 2024), concentrating leverage. Concentration among leading colocation players raises switching costs and lead times, while long-term contracts and volume commitments blunt price spikes but limit flexibility. Global chip and power shocks (notably 2020–22 semiconductor tightness) have historically tightened capacity and increased supplier bargaining power.
Bandwidth and CDN providers
High-throughput sync and sharing force Dropbox to rely on peering, transit and CDN partners; the global CDN market reached about $28 billion in 2024, concentrating leverage among top vendors. Limited premium routes in some regions give suppliers bargaining power, though multihoming across carriers reduces single-vendor risk while increasing complexity and cost. Enterprise traffic spikes can trigger burst pricing or renegotiated commitments, driving volatile network spend as a share of cost of revenue.

Platform gatekeepers
Mobile app stores and OS ecosystems (iOS, Android, Windows, macOS) control distribution, policies and fees—App Store/Play Store commissions typically range 15–30%, affecting Dropbox’s margins and pricing. Sudden API, privacy or fee changes can hit acquisition, monetization and feature parity. Ongoing compliance drives dev and legal costs. Gatekeeper power is moderated by Dropbox’s cross-platform apps and web access and by Android’s ~71% vs iOS ~28% global mobile share (2024).

SaaS integration partners
Integrations with Microsoft 365 (300M+ commercial seats), Google Workspace and Slack are essential for workflow stickiness and help Dropbox (FY2023 revenue $2.03B) retain users, but heavy dependence on third-party APIs creates exposure to policy shifts and technical breakages and co-opetition when partners offer storage themselves.
- Dependency: API policy risk
- Co-opetition: partners as rivals
- Mitigation: standards-based APIs
- Diversification: multiple partners reduces concentration
Energy and sustainability inputs
Energy and sustainability inputs materially influence Dropbox cost structure and ESG standing: 2024 corporate renewable procurement stays elevated, tightening markets and giving utilities/brokers leverage on price and availability; sustainability targets can constrain site choices, and hedging plus location diversification cut but do not eliminate exposure.
- Supplier leverage: higher in tight power markets
- Contract impact: binds location/supplier choices
- Mitigation: hedging/diversification limited
Supplier power moderate-high; CDN $28B; Android 71%
Supplier power is moderate-high: top 3 server OEMs ~50% of shipments (IDC, 2024), CDN market ~$28B (2024) concentrates vendors, and cloud/colocation concentration raises switching costs. App store cuts (15–30%) and mobile share Android ~71%/iOS ~28% (2024) affect margins. Energy/semiconductor tightness (2020–22) showed supplier-driven cost shocks; Dropbox FY2023 revenue $2.03B.
| Metric | Value (2024/2023) |
|---|---|
| Top3 server OEMs | ~50% (IDC, 2024) |
| CDN market | $28B (2024) |
| Mobile share | Android 71% / iOS 28% (2024) |
| Dropbox revenue | $2.03B (FY2023) |
What is included in the product
 Detailed Word Document
Tailored Porter's Five Forces analysis for Dropbox that uncovers competitive intensity, buyer and supplier power, threat of substitutes and new entrants, and highlights disruptive forces and strategic levers to protect market share and pricing power.

 Customizable Excel Spreadsheet
One-sheet Porter's Five Forces for Dropbox—instantly visualize competitive pressure with a customizable radar chart and clean, slide-ready layout you can swap data into, duplicate for scenario analysis, and integrate into dashboards without macros.
Customers Bargaining Power

Freemium-driven price sensitivity
Dropbox's large freemium base (roughly 700 million registered users vs about 16.6 million paying customers in 2024) creates strong price sensitivity as many users can churn or remain non-paying, pressuring conversion economics. Buyers routinely benchmark paid tiers against "good enough" free alternatives, limiting willingness to pay. Price experiments trigger immediate user feedback and viral amplification, so value-add features must clearly justify upsell to neutralize downward price pressure.
Low switching and multi-homing
Low switching costs and widespread multi-homing—many users keep accounts across Dropbox, Google Drive and OneDrive—give buyers leverage to demand better value or cancel at renewal; Dropbox reported about 12.6 million paying users in 2024, highlighting broad multi-account use. Cross-platform clients and open file formats make dual-using easy, lowering lock-in. Strong differentiation in reliability, search and collaboration reduces perceived substitutability.

Enterprise procurement leverage
Enterprise procurement negotiates volume discounts, SLAs and security add-ons, driving large deals within Dropbox’s installed base (Dropbox reported $2.12B revenue and ~15.48M paying users in FY2023). Competitive RFPs force head-to-head vendor comparisons and margin pressure while SOC 2, ISO, HIPAA and GDPR compliance raise cost-to-serve. Strong admin controls and governance features are a documented defense in winning higher-value, stickier contracts.

Feature and workflow expectations
Churn visibility and contract terms
Monthly plans enable rapid exit and increase buyer leverage; annual contracts with seat minimums reduce churn but force continuous value proof. 2024 SaaS benchmarks show median monthly churn ~5% vs annual ~1.5%; Dropbox reported $2.3B revenue in FY2023. Usage-based analytics sharpen renewal negotiations and customer success motions can rebalance leverage by delivering realized outcomes.
- Monthly plans = higher buyer leverage (~5% monthly churn)
- Annual + seat minimums = lower churn (~1.5%)
- Usage analytics guide renewal terms
- Customer success shifts leverage via outcomes
Buyers dominate: ~700M vs ~16.6M payers — pricing & churn
Buyers hold strong leverage: ~700M registered vs ~16.6M paying (2024) drives price sensitivity and multi-homing; enterprise procurement extracts discounts and SLAs, pressuring margins; monthly plans raise churn while annual seats lower it, forcing continuous value proof.
| Metric | Value (2024) |
|---|---|
| Registered users | ~700M |
| Paying users | ~16.6M |
Same Document Delivered
Dropbox Porter's Five Forces Analysis
This preview shows the exact Dropbox Porter's Five Forces Analysis you'll receive immediately after purchase—no placeholders. The analysis is fully formatted, professionally written, and ready for download and use the moment you buy. No mockups or samples; this is the final deliverable.

A Must-Have Tool for Decision-Makers
Dropbox faces intense competitive rivalry from cloud storage and collaboration rivals, moderate buyer power driven by switching options, manageable supplier power, a moderate threat of new entrants, and meaningful substitute pressures from alternative collaboration tools. This snapshot highlights key pressures but only scratches the surface. Unlock the full Porter's Five Forces Analysis to explore force-by-force ratings, visuals, and strategic implications for Dropbox.
Suppliers Bargaining Power
Global infrastructure vendors
Dropbox depends on data center operators, server OEMs, storage-component suppliers and network providers to run at scale, and industry research shows the top three server OEMs account for roughly half of global shipments (IDC, 2024), concentrating leverage. Concentration among leading colocation players raises switching costs and lead times, while long-term contracts and volume commitments blunt price spikes but limit flexibility. Global chip and power shocks (notably 2020–22 semiconductor tightness) have historically tightened capacity and increased supplier bargaining power.
Bandwidth and CDN providers
High-throughput sync and sharing force Dropbox to rely on peering, transit and CDN partners; the global CDN market reached about $28 billion in 2024, concentrating leverage among top vendors. Limited premium routes in some regions give suppliers bargaining power, though multihoming across carriers reduces single-vendor risk while increasing complexity and cost. Enterprise traffic spikes can trigger burst pricing or renegotiated commitments, driving volatile network spend as a share of cost of revenue.
Platform gatekeepers
Mobile app stores and OS ecosystems (iOS, Android, Windows, macOS) control distribution, policies and fees—App Store/Play Store commissions typically range 15–30%, affecting Dropbox’s margins and pricing. Sudden API, privacy or fee changes can hit acquisition, monetization and feature parity. Ongoing compliance drives dev and legal costs. Gatekeeper power is moderated by Dropbox’s cross-platform apps and web access and by Android’s ~71% vs iOS ~28% global mobile share (2024).
SaaS integration partners
Integrations with Microsoft 365 (300M+ commercial seats), Google Workspace and Slack are essential for workflow stickiness and help Dropbox (FY2023 revenue $2.03B) retain users, but heavy dependence on third-party APIs creates exposure to policy shifts and technical breakages and co-opetition when partners offer storage themselves.
- Dependency: API policy risk
- Co-opetition: partners as rivals
- Mitigation: standards-based APIs
- Diversification: multiple partners reduces concentration
Energy and sustainability inputs
Energy and sustainability inputs materially influence Dropbox cost structure and ESG standing: 2024 corporate renewable procurement stays elevated, tightening markets and giving utilities/brokers leverage on price and availability; sustainability targets can constrain site choices, and hedging plus location diversification cut but do not eliminate exposure.
- Supplier leverage: higher in tight power markets
- Contract impact: binds location/supplier choices
- Mitigation: hedging/diversification limited
Supplier power moderate-high; CDN $28B; Android 71%
Supplier power is moderate-high: top 3 server OEMs ~50% of shipments (IDC, 2024), CDN market ~$28B (2024) concentrates vendors, and cloud/colocation concentration raises switching costs. App store cuts (15–30%) and mobile share Android ~71%/iOS ~28% (2024) affect margins. Energy/semiconductor tightness (2020–22) showed supplier-driven cost shocks; Dropbox FY2023 revenue $2.03B.
| Metric | Value (2024/2023) |
|---|---|
| Top3 server OEMs | ~50% (IDC, 2024) |
| CDN market | $28B (2024) |
| Mobile share | Android 71% / iOS 28% (2024) |
| Dropbox revenue | $2.03B (FY2023) |
What is included in the product
Detailed Word Document
Tailored Porter's Five Forces analysis for Dropbox that uncovers competitive intensity, buyer and supplier power, threat of substitutes and new entrants, and highlights disruptive forces and strategic levers to protect market share and pricing power.
Customizable Excel Spreadsheet
One-sheet Porter's Five Forces for Dropbox—instantly visualize competitive pressure with a customizable radar chart and clean, slide-ready layout you can swap data into, duplicate for scenario analysis, and integrate into dashboards without macros.
Customers Bargaining Power
Freemium-driven price sensitivity
Dropbox's large freemium base (roughly 700 million registered users vs about 16.6 million paying customers in 2024) creates strong price sensitivity as many users can churn or remain non-paying, pressuring conversion economics. Buyers routinely benchmark paid tiers against "good enough" free alternatives, limiting willingness to pay. Price experiments trigger immediate user feedback and viral amplification, so value-add features must clearly justify upsell to neutralize downward price pressure.
Low switching and multi-homing
Low switching costs and widespread multi-homing—many users keep accounts across Dropbox, Google Drive and OneDrive—give buyers leverage to demand better value or cancel at renewal; Dropbox reported about 12.6 million paying users in 2024, highlighting broad multi-account use. Cross-platform clients and open file formats make dual-using easy, lowering lock-in. Strong differentiation in reliability, search and collaboration reduces perceived substitutability.
Enterprise procurement leverage
Enterprise procurement negotiates volume discounts, SLAs and security add-ons, driving large deals within Dropbox’s installed base (Dropbox reported $2.12B revenue and ~15.48M paying users in FY2023). Competitive RFPs force head-to-head vendor comparisons and margin pressure while SOC 2, ISO, HIPAA and GDPR compliance raise cost-to-serve. Strong admin controls and governance features are a documented defense in winning higher-value, stickier contracts.
Feature and workflow expectations
Churn visibility and contract terms
Monthly plans enable rapid exit and increase buyer leverage; annual contracts with seat minimums reduce churn but force continuous value proof. 2024 SaaS benchmarks show median monthly churn ~5% vs annual ~1.5%; Dropbox reported $2.3B revenue in FY2023. Usage-based analytics sharpen renewal negotiations and customer success motions can rebalance leverage by delivering realized outcomes.
- Monthly plans = higher buyer leverage (~5% monthly churn)
- Annual + seat minimums = lower churn (~1.5%)
- Usage analytics guide renewal terms
- Customer success shifts leverage via outcomes
Buyers dominate: ~700M vs ~16.6M payers — pricing & churn
Buyers hold strong leverage: ~700M registered vs ~16.6M paying (2024) drives price sensitivity and multi-homing; enterprise procurement extracts discounts and SLAs, pressuring margins; monthly plans raise churn while annual seats lower it, forcing continuous value proof.
| Metric | Value (2024) |
|---|---|
| Registered users | ~700M |
| Paying users | ~16.6M |
Same Document Delivered
Dropbox Porter's Five Forces Analysis
This preview shows the exact Dropbox Porter's Five Forces Analysis you'll receive immediately after purchase—no placeholders. The analysis is fully formatted, professionally written, and ready for download and use the moment you buy. No mockups or samples; this is the final deliverable.
Original: $10.00
-65%$10.00
$3.50Description
A Must-Have Tool for Decision-Makers
Dropbox faces intense competitive rivalry from cloud storage and collaboration rivals, moderate buyer power driven by switching options, manageable supplier power, a moderate threat of new entrants, and meaningful substitute pressures from alternative collaboration tools. This snapshot highlights key pressures but only scratches the surface. Unlock the full Porter's Five Forces Analysis to explore force-by-force ratings, visuals, and strategic implications for Dropbox.
Suppliers Bargaining Power
Global infrastructure vendors
Dropbox depends on data center operators, server OEMs, storage-component suppliers and network providers to run at scale, and industry research shows the top three server OEMs account for roughly half of global shipments (IDC, 2024), concentrating leverage. Concentration among leading colocation players raises switching costs and lead times, while long-term contracts and volume commitments blunt price spikes but limit flexibility. Global chip and power shocks (notably 2020–22 semiconductor tightness) have historically tightened capacity and increased supplier bargaining power.
Bandwidth and CDN providers
High-throughput sync and sharing force Dropbox to rely on peering, transit and CDN partners; the global CDN market reached about $28 billion in 2024, concentrating leverage among top vendors. Limited premium routes in some regions give suppliers bargaining power, though multihoming across carriers reduces single-vendor risk while increasing complexity and cost. Enterprise traffic spikes can trigger burst pricing or renegotiated commitments, driving volatile network spend as a share of cost of revenue.
Platform gatekeepers
Mobile app stores and OS ecosystems (iOS, Android, Windows, macOS) control distribution, policies and fees—App Store/Play Store commissions typically range 15–30%, affecting Dropbox’s margins and pricing. Sudden API, privacy or fee changes can hit acquisition, monetization and feature parity. Ongoing compliance drives dev and legal costs. Gatekeeper power is moderated by Dropbox’s cross-platform apps and web access and by Android’s ~71% vs iOS ~28% global mobile share (2024).
SaaS integration partners
Integrations with Microsoft 365 (300M+ commercial seats), Google Workspace and Slack are essential for workflow stickiness and help Dropbox (FY2023 revenue $2.03B) retain users, but heavy dependence on third-party APIs creates exposure to policy shifts and technical breakages and co-opetition when partners offer storage themselves.
- Dependency: API policy risk
- Co-opetition: partners as rivals
- Mitigation: standards-based APIs
- Diversification: multiple partners reduces concentration
Energy and sustainability inputs
Energy and sustainability inputs materially influence Dropbox cost structure and ESG standing: 2024 corporate renewable procurement stays elevated, tightening markets and giving utilities/brokers leverage on price and availability; sustainability targets can constrain site choices, and hedging plus location diversification cut but do not eliminate exposure.
- Supplier leverage: higher in tight power markets
- Contract impact: binds location/supplier choices
- Mitigation: hedging/diversification limited
Supplier power moderate-high; CDN $28B; Android 71%
Supplier power is moderate-high: top 3 server OEMs ~50% of shipments (IDC, 2024), CDN market ~$28B (2024) concentrates vendors, and cloud/colocation concentration raises switching costs. App store cuts (15–30%) and mobile share Android ~71%/iOS ~28% (2024) affect margins. Energy/semiconductor tightness (2020–22) showed supplier-driven cost shocks; Dropbox FY2023 revenue $2.03B.
| Metric | Value (2024/2023) |
|---|---|
| Top3 server OEMs | ~50% (IDC, 2024) |
| CDN market | $28B (2024) |
| Mobile share | Android 71% / iOS 28% (2024) |
| Dropbox revenue | $2.03B (FY2023) |
What is included in the product
Detailed Word Document
Tailored Porter's Five Forces analysis for Dropbox that uncovers competitive intensity, buyer and supplier power, threat of substitutes and new entrants, and highlights disruptive forces and strategic levers to protect market share and pricing power.
Customizable Excel Spreadsheet
One-sheet Porter's Five Forces for Dropbox—instantly visualize competitive pressure with a customizable radar chart and clean, slide-ready layout you can swap data into, duplicate for scenario analysis, and integrate into dashboards without macros.
Customers Bargaining Power
Freemium-driven price sensitivity
Dropbox's large freemium base (roughly 700 million registered users vs about 16.6 million paying customers in 2024) creates strong price sensitivity as many users can churn or remain non-paying, pressuring conversion economics. Buyers routinely benchmark paid tiers against "good enough" free alternatives, limiting willingness to pay. Price experiments trigger immediate user feedback and viral amplification, so value-add features must clearly justify upsell to neutralize downward price pressure.
Low switching and multi-homing
Low switching costs and widespread multi-homing—many users keep accounts across Dropbox, Google Drive and OneDrive—give buyers leverage to demand better value or cancel at renewal; Dropbox reported about 12.6 million paying users in 2024, highlighting broad multi-account use. Cross-platform clients and open file formats make dual-using easy, lowering lock-in. Strong differentiation in reliability, search and collaboration reduces perceived substitutability.
Enterprise procurement leverage
Enterprise procurement negotiates volume discounts, SLAs and security add-ons, driving large deals within Dropbox’s installed base (Dropbox reported $2.12B revenue and ~15.48M paying users in FY2023). Competitive RFPs force head-to-head vendor comparisons and margin pressure while SOC 2, ISO, HIPAA and GDPR compliance raise cost-to-serve. Strong admin controls and governance features are a documented defense in winning higher-value, stickier contracts.
Feature and workflow expectations
Churn visibility and contract terms
Monthly plans enable rapid exit and increase buyer leverage; annual contracts with seat minimums reduce churn but force continuous value proof. 2024 SaaS benchmarks show median monthly churn ~5% vs annual ~1.5%; Dropbox reported $2.3B revenue in FY2023. Usage-based analytics sharpen renewal negotiations and customer success motions can rebalance leverage by delivering realized outcomes.
- Monthly plans = higher buyer leverage (~5% monthly churn)
- Annual + seat minimums = lower churn (~1.5%)
- Usage analytics guide renewal terms
- Customer success shifts leverage via outcomes
Buyers dominate: ~700M vs ~16.6M payers — pricing & churn
Buyers hold strong leverage: ~700M registered vs ~16.6M paying (2024) drives price sensitivity and multi-homing; enterprise procurement extracts discounts and SLAs, pressuring margins; monthly plans raise churn while annual seats lower it, forcing continuous value proof.
| Metric | Value (2024) |
|---|---|
| Registered users | ~700M |
| Paying users | ~16.6M |
Same Document Delivered
Dropbox Porter's Five Forces Analysis
This preview shows the exact Dropbox Porter's Five Forces Analysis you'll receive immediately after purchase—no placeholders. The analysis is fully formatted, professionally written, and ready for download and use the moment you buy. No mockups or samples; this is the final deliverable.











