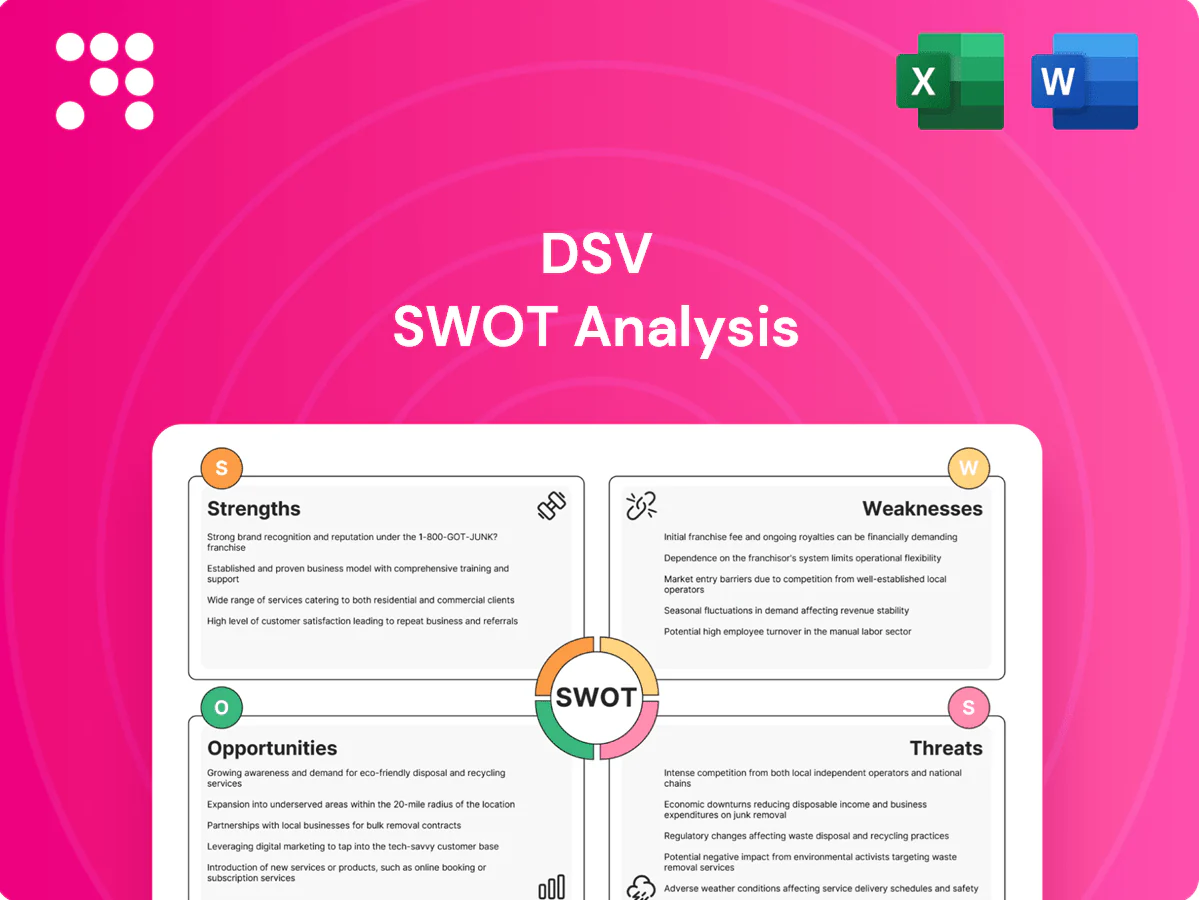
DSV SWOT Analysis

Go Beyond the Preview—Access the Full Strategic Report
DSV’s SWOT highlights its global scale, integrated freight and contract logistics capabilities, and growing digital platform as key strengths, while regulatory exposure, margin pressure, and integration risks show up as weaknesses. Rapid e‑commerce growth and sustainability-driven logistics offer clear opportunities, contrasted by intense competition and fuel volatility as threats. Want the full strategic picture with editable Word and Excel deliverables? Purchase the complete SWOT analysis to plan, pitch, or invest with confidence.
Strengths

Global network scale
DSV’s air, sea, road and rail network spans 90+ countries, delivering lane density and broad market access for complex multi-region supply chains. Scale boosts buying power with carriers and service reliability; the group had about 75,000 employees worldwide in 2023. This global footprint enables rapid capacity reallocation during disruptions to maintain continuity.
Multimodal portfolio
DSV’s air, ocean, road and rail mix—supported by a network in more than 100 countries and revenue remaining above DKK 100bn in 2024—allows flexible routing and cost-service tradeoffs; customers optimize lead times, risk and spend with one provider. Cross-modal coordination boosts resilience when a mode is constrained and creates tangible cross-selling opportunities across the transport mix.

End-to-end integrated solutions
DSV’s end-to-end portfolio—warehousing, distribution, customs brokerage and value-added services—complements forwarding to reduce handoffs and improve visibility and control, enhancing operational efficiency. Integrated offerings increase client stickiness through long-term contracts and deeper solution depth, shifting relationships from transactional to strategic. With operations across 90+ countries and roughly 75,000 employees, DSV leverages scale to embed itself in customers’ supply chains.

Technology and data capabilities
Digital platforms deliver end-to-end shipment visibility, track-and-trace and planning analytics; DSV's network spans 90+ countries with ~75,000 employees (2024). Data-driven optimization improves routing, consolidation and inventory positioning, cutting transit and holding costs. Automation in warehouses raises throughput and accuracy across 1,000+ facilities, differentiating service quality and scalability.
- Visibility & analytics: real-time track-and-trace
- Optimization: routing, consolidation, inventory positioning
- Automation: 1,000+ automated warehouses; scalable service quality
Sector expertise and reliability
Sector expertise across automotive, pharma, retail and industrials enables DSV to deploy tailored SOPs and GDP/temperature-control, dangerous-goods and customs compliance that reduce risk; proven on-time execution for time-critical, high-value cargo builds trust and supports premium pricing and retention, backed by presence in 90+ countries and ~75,000 employees (2024).
- Industry-tailored SOPs
- GDP/temperature & dangerous-goods compliance
- Reliable execution for time-critical cargo
- Supports premium pricing & client retention
Global multimodal network, 90+ countries, ~75,000 employees, 1,000+ automated sites
DSV’s global multimodal network (90+ countries) and scale (~75,000 employees) deliver lane density, strong carrier leverage and fast disruption response. Integrated forwarding, warehousing and customs lower handoffs and increase client stickiness; digital visibility and 1,000+ automated facilities drive efficiency and cost reduction. Sector-specific SOPs (pharma, auto, retail) support premium pricing and retention.
| Metric | Value (2024) |
|---|---|
| Revenue | >DKK 100bn |
| Employees | ~75,000 |
| Countries | 90+ |
| Automated warehouses | 1,000+ |
What is included in the product
 Detailed Word Document
Delivers a strategic overview of DSV’s internal and external business factors, outlining strengths, weaknesses, opportunities, and threats to assess its competitive position, growth drivers, and future risks.

 Customizable Excel Spreadsheet
Delivers a concise DSV SWOT matrix for rapid logistics strategy alignment, relieving analysis bottlenecks and speeding stakeholder consensus.
Weaknesses

Volume cyclicality
Freight forwarding volumes at DSV are highly sensitive to global trade and GDP cycles—IMF projected global GDP growth of 3.2% in 2024—so demand swings materially affect revenue. Downturns compress volumes and yields, as seen when container spot rates collapsed by over 70% from 2021 peaks, pressuring margins. Customers may defer shipments or switch to lower-cost services, and this volatility complicates planning and capacity commitments.
Thin margins and cost pressure
Industry competition in 2024 kept net yields tight as ocean and air rates normalized post-pandemic, squeezing forwarder margins. Carrier rate swings and fuel cost volatility often outpace contractual pass-throughs, creating short-term margin shocks. Balancing service quality with SG&A control remains difficult, and margin dilution risk rises sharply during soft market cycles.

Integration and change management
Frequent large acquisitions — notably Panalpina (2019, ~USD 4.6bn) and Agility GIL (2021, ~USD 4.6bn) — create integration complexity across systems, culture and processes, and delays have in the past limited realized synergies and affected customer experience. IT harmonization and data migration carry measurable execution risk, risking service disruptions and cost overruns. Retaining key talent during transitions is critical to preserve operational knowledge and protect projected merger benefits.

Asset-light carrier dependency
DSV’s asset-light model means heavy reliance on third-party carriers, limiting direct control over capacity and service levels, which became evident in 2023–24 market tightness when spot rates and space constraints spiked across key trade lanes.
Service failures by partners can directly damage DSV’s brand and customer retention, while negotiating leverage fluctuates significantly by trade lane and season, constraining margin management.
- Reliance on third parties limits capacity control
- Tight markets raise buy rates and reduce space
- Partner failures risk brand and retention
- Leverage varies by trade lane and season
Environmental footprint perception
Logistics emissions across scopes expose DSV to stakeholder scrutiny as customers and regulators push for low-carbon options and transparent reporting; gaps in green capacity or emissions data risk losing bids, while capital and operational transition costs could compress margins.
Logistics firm faces volatile demand, >70% spot slump, acquisition and emissions risks
DSV faces demand volatility tied to global GDP (IMF 2024 GDP +3.2%), with container spot rates collapsing >70% from 2021 peaks, pressuring yields. Tight 2024 market competition and fuel swings squeezed margins; Panalpina and Agility GIL integrations (~USD 4.6bn each) add execution risk. Asset-light model limits capacity control; scope emissions scrutiny risks lost bids and transition costs.
| Metric | Value |
|---|---|
| IMF global GDP 2024 | +3.2% |
| Container spot drop since 2021 | >70% |
| Major acquisitions | ~USD 4.6bn each |
| Emissions risk | High (scope 1–3) |
Preview Before You Purchase
DSV SWOT Analysis
This is the actual DSV SWOT analysis document you’ll receive upon purchase—no surprises, just professional quality. The preview below is taken directly from the full SWOT report you'll get; purchasing unlocks the complete, editable version. You’re viewing a live preview of the real file, structured and ready for immediate download after payment.

Go Beyond the Preview—Access the Full Strategic Report
DSV’s SWOT highlights its global scale, integrated freight and contract logistics capabilities, and growing digital platform as key strengths, while regulatory exposure, margin pressure, and integration risks show up as weaknesses. Rapid e‑commerce growth and sustainability-driven logistics offer clear opportunities, contrasted by intense competition and fuel volatility as threats. Want the full strategic picture with editable Word and Excel deliverables? Purchase the complete SWOT analysis to plan, pitch, or invest with confidence.
Strengths
Global network scale
DSV’s air, sea, road and rail network spans 90+ countries, delivering lane density and broad market access for complex multi-region supply chains. Scale boosts buying power with carriers and service reliability; the group had about 75,000 employees worldwide in 2023. This global footprint enables rapid capacity reallocation during disruptions to maintain continuity.
Multimodal portfolio
DSV’s air, ocean, road and rail mix—supported by a network in more than 100 countries and revenue remaining above DKK 100bn in 2024—allows flexible routing and cost-service tradeoffs; customers optimize lead times, risk and spend with one provider. Cross-modal coordination boosts resilience when a mode is constrained and creates tangible cross-selling opportunities across the transport mix.
End-to-end integrated solutions
DSV’s end-to-end portfolio—warehousing, distribution, customs brokerage and value-added services—complements forwarding to reduce handoffs and improve visibility and control, enhancing operational efficiency. Integrated offerings increase client stickiness through long-term contracts and deeper solution depth, shifting relationships from transactional to strategic. With operations across 90+ countries and roughly 75,000 employees, DSV leverages scale to embed itself in customers’ supply chains.
Technology and data capabilities
Digital platforms deliver end-to-end shipment visibility, track-and-trace and planning analytics; DSV's network spans 90+ countries with ~75,000 employees (2024). Data-driven optimization improves routing, consolidation and inventory positioning, cutting transit and holding costs. Automation in warehouses raises throughput and accuracy across 1,000+ facilities, differentiating service quality and scalability.
- Visibility & analytics: real-time track-and-trace
- Optimization: routing, consolidation, inventory positioning
- Automation: 1,000+ automated warehouses; scalable service quality
Sector expertise and reliability
Sector expertise across automotive, pharma, retail and industrials enables DSV to deploy tailored SOPs and GDP/temperature-control, dangerous-goods and customs compliance that reduce risk; proven on-time execution for time-critical, high-value cargo builds trust and supports premium pricing and retention, backed by presence in 90+ countries and ~75,000 employees (2024).
- Industry-tailored SOPs
- GDP/temperature & dangerous-goods compliance
- Reliable execution for time-critical cargo
- Supports premium pricing & client retention
Global multimodal network, 90+ countries, ~75,000 employees, 1,000+ automated sites
DSV’s global multimodal network (90+ countries) and scale (~75,000 employees) deliver lane density, strong carrier leverage and fast disruption response. Integrated forwarding, warehousing and customs lower handoffs and increase client stickiness; digital visibility and 1,000+ automated facilities drive efficiency and cost reduction. Sector-specific SOPs (pharma, auto, retail) support premium pricing and retention.
| Metric | Value (2024) |
|---|---|
| Revenue | >DKK 100bn |
| Employees | ~75,000 |
| Countries | 90+ |
| Automated warehouses | 1,000+ |
What is included in the product
Detailed Word Document
Delivers a strategic overview of DSV’s internal and external business factors, outlining strengths, weaknesses, opportunities, and threats to assess its competitive position, growth drivers, and future risks.
Customizable Excel Spreadsheet
Delivers a concise DSV SWOT matrix for rapid logistics strategy alignment, relieving analysis bottlenecks and speeding stakeholder consensus.
Weaknesses
Volume cyclicality
Freight forwarding volumes at DSV are highly sensitive to global trade and GDP cycles—IMF projected global GDP growth of 3.2% in 2024—so demand swings materially affect revenue. Downturns compress volumes and yields, as seen when container spot rates collapsed by over 70% from 2021 peaks, pressuring margins. Customers may defer shipments or switch to lower-cost services, and this volatility complicates planning and capacity commitments.
Thin margins and cost pressure
Industry competition in 2024 kept net yields tight as ocean and air rates normalized post-pandemic, squeezing forwarder margins. Carrier rate swings and fuel cost volatility often outpace contractual pass-throughs, creating short-term margin shocks. Balancing service quality with SG&A control remains difficult, and margin dilution risk rises sharply during soft market cycles.
Integration and change management
Frequent large acquisitions — notably Panalpina (2019, ~USD 4.6bn) and Agility GIL (2021, ~USD 4.6bn) — create integration complexity across systems, culture and processes, and delays have in the past limited realized synergies and affected customer experience. IT harmonization and data migration carry measurable execution risk, risking service disruptions and cost overruns. Retaining key talent during transitions is critical to preserve operational knowledge and protect projected merger benefits.
Asset-light carrier dependency
DSV’s asset-light model means heavy reliance on third-party carriers, limiting direct control over capacity and service levels, which became evident in 2023–24 market tightness when spot rates and space constraints spiked across key trade lanes.
Service failures by partners can directly damage DSV’s brand and customer retention, while negotiating leverage fluctuates significantly by trade lane and season, constraining margin management.
- Reliance on third parties limits capacity control
- Tight markets raise buy rates and reduce space
- Partner failures risk brand and retention
- Leverage varies by trade lane and season
Environmental footprint perception
Logistics emissions across scopes expose DSV to stakeholder scrutiny as customers and regulators push for low-carbon options and transparent reporting; gaps in green capacity or emissions data risk losing bids, while capital and operational transition costs could compress margins.
Logistics firm faces volatile demand, >70% spot slump, acquisition and emissions risks
DSV faces demand volatility tied to global GDP (IMF 2024 GDP +3.2%), with container spot rates collapsing >70% from 2021 peaks, pressuring yields. Tight 2024 market competition and fuel swings squeezed margins; Panalpina and Agility GIL integrations (~USD 4.6bn each) add execution risk. Asset-light model limits capacity control; scope emissions scrutiny risks lost bids and transition costs.
| Metric | Value |
|---|---|
| IMF global GDP 2024 | +3.2% |
| Container spot drop since 2021 | >70% |
| Major acquisitions | ~USD 4.6bn each |
| Emissions risk | High (scope 1–3) |
Preview Before You Purchase
DSV SWOT Analysis
This is the actual DSV SWOT analysis document you’ll receive upon purchase—no surprises, just professional quality. The preview below is taken directly from the full SWOT report you'll get; purchasing unlocks the complete, editable version. You’re viewing a live preview of the real file, structured and ready for immediate download after payment.
Description
Go Beyond the Preview—Access the Full Strategic Report
DSV’s SWOT highlights its global scale, integrated freight and contract logistics capabilities, and growing digital platform as key strengths, while regulatory exposure, margin pressure, and integration risks show up as weaknesses. Rapid e‑commerce growth and sustainability-driven logistics offer clear opportunities, contrasted by intense competition and fuel volatility as threats. Want the full strategic picture with editable Word and Excel deliverables? Purchase the complete SWOT analysis to plan, pitch, or invest with confidence.
Strengths
Global network scale
DSV’s air, sea, road and rail network spans 90+ countries, delivering lane density and broad market access for complex multi-region supply chains. Scale boosts buying power with carriers and service reliability; the group had about 75,000 employees worldwide in 2023. This global footprint enables rapid capacity reallocation during disruptions to maintain continuity.
Multimodal portfolio
DSV’s air, ocean, road and rail mix—supported by a network in more than 100 countries and revenue remaining above DKK 100bn in 2024—allows flexible routing and cost-service tradeoffs; customers optimize lead times, risk and spend with one provider. Cross-modal coordination boosts resilience when a mode is constrained and creates tangible cross-selling opportunities across the transport mix.
End-to-end integrated solutions
DSV’s end-to-end portfolio—warehousing, distribution, customs brokerage and value-added services—complements forwarding to reduce handoffs and improve visibility and control, enhancing operational efficiency. Integrated offerings increase client stickiness through long-term contracts and deeper solution depth, shifting relationships from transactional to strategic. With operations across 90+ countries and roughly 75,000 employees, DSV leverages scale to embed itself in customers’ supply chains.
Technology and data capabilities
Digital platforms deliver end-to-end shipment visibility, track-and-trace and planning analytics; DSV's network spans 90+ countries with ~75,000 employees (2024). Data-driven optimization improves routing, consolidation and inventory positioning, cutting transit and holding costs. Automation in warehouses raises throughput and accuracy across 1,000+ facilities, differentiating service quality and scalability.
- Visibility & analytics: real-time track-and-trace
- Optimization: routing, consolidation, inventory positioning
- Automation: 1,000+ automated warehouses; scalable service quality
Sector expertise and reliability
Sector expertise across automotive, pharma, retail and industrials enables DSV to deploy tailored SOPs and GDP/temperature-control, dangerous-goods and customs compliance that reduce risk; proven on-time execution for time-critical, high-value cargo builds trust and supports premium pricing and retention, backed by presence in 90+ countries and ~75,000 employees (2024).
- Industry-tailored SOPs
- GDP/temperature & dangerous-goods compliance
- Reliable execution for time-critical cargo
- Supports premium pricing & client retention
Global multimodal network, 90+ countries, ~75,000 employees, 1,000+ automated sites
DSV’s global multimodal network (90+ countries) and scale (~75,000 employees) deliver lane density, strong carrier leverage and fast disruption response. Integrated forwarding, warehousing and customs lower handoffs and increase client stickiness; digital visibility and 1,000+ automated facilities drive efficiency and cost reduction. Sector-specific SOPs (pharma, auto, retail) support premium pricing and retention.
| Metric | Value (2024) |
|---|---|
| Revenue | >DKK 100bn |
| Employees | ~75,000 |
| Countries | 90+ |
| Automated warehouses | 1,000+ |
What is included in the product
Detailed Word Document
Delivers a strategic overview of DSV’s internal and external business factors, outlining strengths, weaknesses, opportunities, and threats to assess its competitive position, growth drivers, and future risks.
Customizable Excel Spreadsheet
Delivers a concise DSV SWOT matrix for rapid logistics strategy alignment, relieving analysis bottlenecks and speeding stakeholder consensus.
Weaknesses
Volume cyclicality
Freight forwarding volumes at DSV are highly sensitive to global trade and GDP cycles—IMF projected global GDP growth of 3.2% in 2024—so demand swings materially affect revenue. Downturns compress volumes and yields, as seen when container spot rates collapsed by over 70% from 2021 peaks, pressuring margins. Customers may defer shipments or switch to lower-cost services, and this volatility complicates planning and capacity commitments.
Thin margins and cost pressure
Industry competition in 2024 kept net yields tight as ocean and air rates normalized post-pandemic, squeezing forwarder margins. Carrier rate swings and fuel cost volatility often outpace contractual pass-throughs, creating short-term margin shocks. Balancing service quality with SG&A control remains difficult, and margin dilution risk rises sharply during soft market cycles.
Integration and change management
Frequent large acquisitions — notably Panalpina (2019, ~USD 4.6bn) and Agility GIL (2021, ~USD 4.6bn) — create integration complexity across systems, culture and processes, and delays have in the past limited realized synergies and affected customer experience. IT harmonization and data migration carry measurable execution risk, risking service disruptions and cost overruns. Retaining key talent during transitions is critical to preserve operational knowledge and protect projected merger benefits.
Asset-light carrier dependency
DSV’s asset-light model means heavy reliance on third-party carriers, limiting direct control over capacity and service levels, which became evident in 2023–24 market tightness when spot rates and space constraints spiked across key trade lanes.
Service failures by partners can directly damage DSV’s brand and customer retention, while negotiating leverage fluctuates significantly by trade lane and season, constraining margin management.
- Reliance on third parties limits capacity control
- Tight markets raise buy rates and reduce space
- Partner failures risk brand and retention
- Leverage varies by trade lane and season
Environmental footprint perception
Logistics emissions across scopes expose DSV to stakeholder scrutiny as customers and regulators push for low-carbon options and transparent reporting; gaps in green capacity or emissions data risk losing bids, while capital and operational transition costs could compress margins.
Logistics firm faces volatile demand, >70% spot slump, acquisition and emissions risks
DSV faces demand volatility tied to global GDP (IMF 2024 GDP +3.2%), with container spot rates collapsing >70% from 2021 peaks, pressuring yields. Tight 2024 market competition and fuel swings squeezed margins; Panalpina and Agility GIL integrations (~USD 4.6bn each) add execution risk. Asset-light model limits capacity control; scope emissions scrutiny risks lost bids and transition costs.
| Metric | Value |
|---|---|
| IMF global GDP 2024 | +3.2% |
| Container spot drop since 2021 | >70% |
| Major acquisitions | ~USD 4.6bn each |
| Emissions risk | High (scope 1–3) |
Preview Before You Purchase
DSV SWOT Analysis
This is the actual DSV SWOT analysis document you’ll receive upon purchase—no surprises, just professional quality. The preview below is taken directly from the full SWOT report you'll get; purchasing unlocks the complete, editable version. You’re viewing a live preview of the real file, structured and ready for immediate download after payment.











