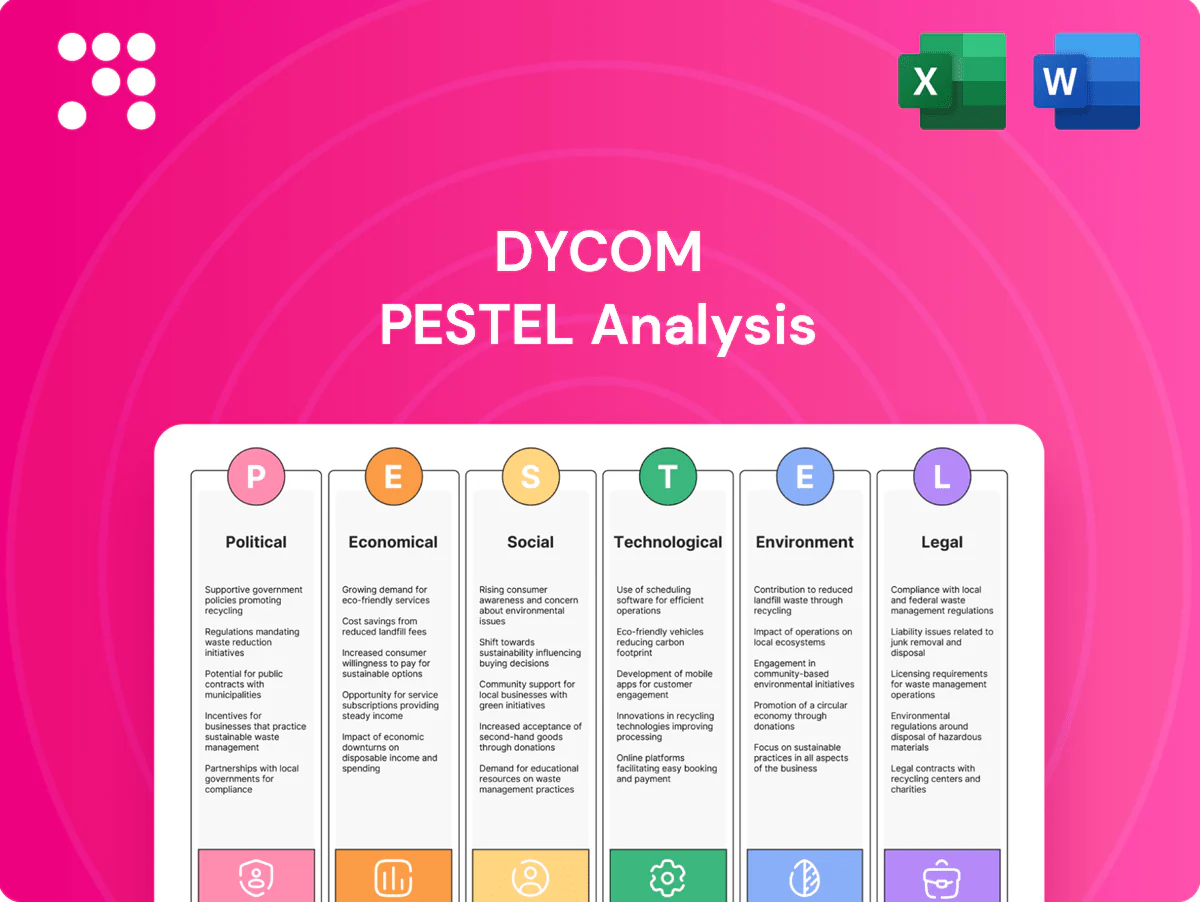
Dycom PESTLE Analysis

Your Shortcut to Market Insight Starts Here
Unlock how political, economic, social, technological, legal and environmental forces are shaping Dycom’s strategic outlook in our concise PESTLE snapshot. This briefing highlights key external pressures and opportunities to inform investment and planning decisions. Buy the full PESTLE analysis to access detailed risks, forecasts and actionable recommendations—download instantly.
Political factors

Federal broadband funding priorities
Federal shifts in programs—notably the BEAD program with $42.45 billion from the Bipartisan Infrastructure Law—can markedly accelerate or delay Dycom’s fiber deployment pipelines as awards and timelines change. Tracking state allotments and state-set matching requirements is essential for bidding strategy and resource staging. Prioritizing relationships with state broadband offices improves influence over project timelines and eligibility criteria.
Permitting and “dig once” policies
Local and state streamlining of rights-of-way and trenching permits directly shortens project cycle times and protects Dycom margins by reducing idle labor and equipment costs. Advocacy for dig once ordinances lowers repeat street cuts, cutting per‑unit installation costs and rework. Maintaining a permitting center of excellence standardizes compliance across municipalities and accelerates approvals, improving bid accuracy and cash conversion.

Telecom spectrum and 5G rollout agendas
National spectrum auctions and carrier policy commitments set the cadence for Dycom’s 5G densification work. The FCC C-band auction in 2021 raised $81 billion, unlocking midband capacity that accelerated carrier small‑cell and macro upgrades. Capacity planning must align with announced C-band, 3.45 GHz and mmWave build waves. Geopolitical constraints such as US export controls and Huawei/ZTE entity‑list restrictions have already disrupted vendor supply chains and risk delaying deployments.

Infrastructure and utility grid modernization
Federal and state incentives — notably the Bipartisan Infrastructure Law's roughly 65 billion for power infrastructure and USDA ReConnect rounds totaling about 1.15 billion for rural upgrades — create adjacent revenue streams for Dycom when positioning integrated locating and construction services for multi-utility corridors, and require close tracking of public utility commission directives that shape multi-year capex plans.
- Federal funding: BIL ~65B for power
- Rural grants: USDA ReConnect ~1.15B
- Strategy: integrated locating + construction
- Regulatory focus: PUC directives drive long-term capex
Buy America and domestic content rules
Evolving Buy America and domestic content rules tied to the Bipartisan Infrastructure Law (about $550 billion new investment) are tightening material sourcing and can raise prices and cause supply delays for contractors like Dycom in 2024–25. Implement multi-supplier strategies and robust documentation systems to meet domestic-content audits and avoid funding disqualifications. Proactively communicate cost and lead-time impacts to customers to protect margins and negotiate pass-throughs.
- Impact: tighter sourcing => higher input costs, longer lead times
- Action: multi-supplier + documented compliance systems
- Customer: early notification of cost/lead-time changes to preserve margins
BEAD, C-band auctions and Buy America reshape fiber and 5G build timelines
Federal BEAD ($42.45B) and state allocations drive fiber rollouts and bidding; PUCs and state matching rules change timelines. Streamlined ROW/permitting and dig‑once ordinances cut cycle time and costs. Spectrum auctions (C‑band $81B) and 5G policies set carrier build cadence; export controls risk supply delays. Buy America/BIL sourcing rules tied to ~$550B infrastructure push raise input costs.
| Item | Value | Impact |
|---|---|---|
| BEAD | $42.45B | Fiber awards/timelines |
| C‑band auction | $81B | 5G densification |
| BIL power | $65B | Multi‑utility work |
| USDA ReConnect | $1.15B | Rural upgrades |
What is included in the product
 Detailed Word Document
Explores how external macro-environmental factors uniquely affect Dycom across Political, Economic, Social, Technological, Environmental, and Legal dimensions, with each section backed by relevant data and current trends. Designed for executives and investors, it offers forward-looking insights and clean, report-ready formatting to guide strategy and funding decisions.

 Customizable Excel Spreadsheet
A compact, visually segmented PESTLE summary for Dycom that clarifies external risks and opportunities at a glance, usable in presentations or planning sessions and easily shared across teams.
Economic factors

Carrier capex cycles and budget volatility
Large telco and cable MSO capex shifts drive Dycom revenue visibility and crew utilization; top U.S. carriers and MSOs accounted for roughly 65% of industry capex in 2024, concentrating demand. Diversifying across customers and regions smooths downturns and reduces single‑customer exposure. Flexible labor models and subcontractor pools let Dycom scale crews quickly as quarterly budgets move—often by up to 20% quarter‑over‑quarter.
Labor availability and wage inflation
Tight skilled-trades markets are increasing bid prices and delaying project delivery, with U.S. construction wages rising about 5% year-over-year in 2024 per BLS, amplifying labor cost risk for Dycom. Investing in training pipelines and retention reduces turnover and rework, improving productivity. Indexing contracts to wage escalators where possible protects project margins against ongoing wage inflation.

Interest rates and bonding capacity
Higher policy rates (Fed funds ~5.25–5.50% mid‑2025) have pushed equipment financing spreads up roughly 200–300 bps versus 2021, raising Dycom’s capital costs and tightening client ROI thresholds. Maintaining ample liquidity and full surety lines—performance bonds often sized to 100% of contract value—is essential to win large multi‑year awards. Dycom should optimize fleet ownership versus rental to limit interest sensitivity and preserve bonding headroom.

Material costs and supply-chain resilience
Fiber, conduit and electronics price swings change Dycom bid assumptions and can compress margins; firms often face volatile input costs tied to global raw-material cycles.
Locking pricing via frame agreements and hedging where feasible stabilizes unit costs and protects backlog profitability.
Maintaining buffer inventories for critical components reduces risk of project delays and liquidated-damages exposure.
- price volatility: affects bids
- hedging: lock rates
- agreements: frame contracts
- buffers: prevent delays
Regional economic growth and housing starts
Regional suburban expansions and new housing starts drive last-mile connectivity demand as homebuilding supports fiber and service extensions; US housing starts averaged about 1.5 million annualized in 2024 (U.S. Census Bureau). Prioritize markets with sustained population inflows and business formation—Sun Belt and selected metro suburbs showing fastest growth remain strategic. Calibrate satellite yards to reduce mobilization costs and shorten response times for turn-up and maintenance.
- Target markets: Sun Belt metros, high single‑family starts
- Metric: US housing starts ~1.5M (2024)
- Operational: satellite yards to cut mobilization and response times
- Strategy: align bids with local permits and business formation rates
BEAD, C-band auctions and Buy America reshape fiber and 5G build timelines
Large carrier/MSO capex concentration (~65% of industry capex in 2024) and US housing starts (~1.5M annualized 2024) drive Dycom demand concentration and regional focus; construction wages rose ~5% YoY (BLS 2024), pressuring margins. Fed funds ~5.25–5.50% (mid‑2025) and equipment spreads +200–300 bps vs 2021 raise capital costs; bonding often equals 100% contract value, so liquidity and hedges matter.
| Metric | Value |
|---|---|
| Carrier/MSO capex share (2024) | ~65% |
| US housing starts (2024) | ~1.5M annualized |
| Construction wage growth (2024) | ~+5% YoY (BLS) |
| Fed funds (mid‑2025) | 5.25–5.50% |
| Equipment financing spread vs 2021 | +200–300 bps |
Same Document Delivered
Dycom PESTLE Analysis
The Dycom PESTLE Analysis offers a concise evaluation of political, economic, social, technological, legal and environmental factors affecting Dycom. The content and structure shown in the preview is the same document you’ll download after payment. It’s fully formatted, professionally structured, and ready to use for strategic planning or investment decisions.

Your Shortcut to Market Insight Starts Here
Unlock how political, economic, social, technological, legal and environmental forces are shaping Dycom’s strategic outlook in our concise PESTLE snapshot. This briefing highlights key external pressures and opportunities to inform investment and planning decisions. Buy the full PESTLE analysis to access detailed risks, forecasts and actionable recommendations—download instantly.
Political factors
Federal broadband funding priorities
Federal shifts in programs—notably the BEAD program with $42.45 billion from the Bipartisan Infrastructure Law—can markedly accelerate or delay Dycom’s fiber deployment pipelines as awards and timelines change. Tracking state allotments and state-set matching requirements is essential for bidding strategy and resource staging. Prioritizing relationships with state broadband offices improves influence over project timelines and eligibility criteria.
Permitting and “dig once” policies
Local and state streamlining of rights-of-way and trenching permits directly shortens project cycle times and protects Dycom margins by reducing idle labor and equipment costs. Advocacy for dig once ordinances lowers repeat street cuts, cutting per‑unit installation costs and rework. Maintaining a permitting center of excellence standardizes compliance across municipalities and accelerates approvals, improving bid accuracy and cash conversion.
Telecom spectrum and 5G rollout agendas
National spectrum auctions and carrier policy commitments set the cadence for Dycom’s 5G densification work. The FCC C-band auction in 2021 raised $81 billion, unlocking midband capacity that accelerated carrier small‑cell and macro upgrades. Capacity planning must align with announced C-band, 3.45 GHz and mmWave build waves. Geopolitical constraints such as US export controls and Huawei/ZTE entity‑list restrictions have already disrupted vendor supply chains and risk delaying deployments.
Infrastructure and utility grid modernization
Federal and state incentives — notably the Bipartisan Infrastructure Law's roughly 65 billion for power infrastructure and USDA ReConnect rounds totaling about 1.15 billion for rural upgrades — create adjacent revenue streams for Dycom when positioning integrated locating and construction services for multi-utility corridors, and require close tracking of public utility commission directives that shape multi-year capex plans.
- Federal funding: BIL ~65B for power
- Rural grants: USDA ReConnect ~1.15B
- Strategy: integrated locating + construction
- Regulatory focus: PUC directives drive long-term capex
Buy America and domestic content rules
Evolving Buy America and domestic content rules tied to the Bipartisan Infrastructure Law (about $550 billion new investment) are tightening material sourcing and can raise prices and cause supply delays for contractors like Dycom in 2024–25. Implement multi-supplier strategies and robust documentation systems to meet domestic-content audits and avoid funding disqualifications. Proactively communicate cost and lead-time impacts to customers to protect margins and negotiate pass-throughs.
- Impact: tighter sourcing => higher input costs, longer lead times
- Action: multi-supplier + documented compliance systems
- Customer: early notification of cost/lead-time changes to preserve margins
BEAD, C-band auctions and Buy America reshape fiber and 5G build timelines
Federal BEAD ($42.45B) and state allocations drive fiber rollouts and bidding; PUCs and state matching rules change timelines. Streamlined ROW/permitting and dig‑once ordinances cut cycle time and costs. Spectrum auctions (C‑band $81B) and 5G policies set carrier build cadence; export controls risk supply delays. Buy America/BIL sourcing rules tied to ~$550B infrastructure push raise input costs.
| Item | Value | Impact |
|---|---|---|
| BEAD | $42.45B | Fiber awards/timelines |
| C‑band auction | $81B | 5G densification |
| BIL power | $65B | Multi‑utility work |
| USDA ReConnect | $1.15B | Rural upgrades |
What is included in the product
Detailed Word Document
Explores how external macro-environmental factors uniquely affect Dycom across Political, Economic, Social, Technological, Environmental, and Legal dimensions, with each section backed by relevant data and current trends. Designed for executives and investors, it offers forward-looking insights and clean, report-ready formatting to guide strategy and funding decisions.
Customizable Excel Spreadsheet
A compact, visually segmented PESTLE summary for Dycom that clarifies external risks and opportunities at a glance, usable in presentations or planning sessions and easily shared across teams.
Economic factors
Carrier capex cycles and budget volatility
Large telco and cable MSO capex shifts drive Dycom revenue visibility and crew utilization; top U.S. carriers and MSOs accounted for roughly 65% of industry capex in 2024, concentrating demand. Diversifying across customers and regions smooths downturns and reduces single‑customer exposure. Flexible labor models and subcontractor pools let Dycom scale crews quickly as quarterly budgets move—often by up to 20% quarter‑over‑quarter.
Labor availability and wage inflation
Tight skilled-trades markets are increasing bid prices and delaying project delivery, with U.S. construction wages rising about 5% year-over-year in 2024 per BLS, amplifying labor cost risk for Dycom. Investing in training pipelines and retention reduces turnover and rework, improving productivity. Indexing contracts to wage escalators where possible protects project margins against ongoing wage inflation.
Interest rates and bonding capacity
Higher policy rates (Fed funds ~5.25–5.50% mid‑2025) have pushed equipment financing spreads up roughly 200–300 bps versus 2021, raising Dycom’s capital costs and tightening client ROI thresholds. Maintaining ample liquidity and full surety lines—performance bonds often sized to 100% of contract value—is essential to win large multi‑year awards. Dycom should optimize fleet ownership versus rental to limit interest sensitivity and preserve bonding headroom.
Material costs and supply-chain resilience
Fiber, conduit and electronics price swings change Dycom bid assumptions and can compress margins; firms often face volatile input costs tied to global raw-material cycles.
Locking pricing via frame agreements and hedging where feasible stabilizes unit costs and protects backlog profitability.
Maintaining buffer inventories for critical components reduces risk of project delays and liquidated-damages exposure.
- price volatility: affects bids
- hedging: lock rates
- agreements: frame contracts
- buffers: prevent delays
Regional economic growth and housing starts
Regional suburban expansions and new housing starts drive last-mile connectivity demand as homebuilding supports fiber and service extensions; US housing starts averaged about 1.5 million annualized in 2024 (U.S. Census Bureau). Prioritize markets with sustained population inflows and business formation—Sun Belt and selected metro suburbs showing fastest growth remain strategic. Calibrate satellite yards to reduce mobilization costs and shorten response times for turn-up and maintenance.
- Target markets: Sun Belt metros, high single‑family starts
- Metric: US housing starts ~1.5M (2024)
- Operational: satellite yards to cut mobilization and response times
- Strategy: align bids with local permits and business formation rates
BEAD, C-band auctions and Buy America reshape fiber and 5G build timelines
Large carrier/MSO capex concentration (~65% of industry capex in 2024) and US housing starts (~1.5M annualized 2024) drive Dycom demand concentration and regional focus; construction wages rose ~5% YoY (BLS 2024), pressuring margins. Fed funds ~5.25–5.50% (mid‑2025) and equipment spreads +200–300 bps vs 2021 raise capital costs; bonding often equals 100% contract value, so liquidity and hedges matter.
| Metric | Value |
|---|---|
| Carrier/MSO capex share (2024) | ~65% |
| US housing starts (2024) | ~1.5M annualized |
| Construction wage growth (2024) | ~+5% YoY (BLS) |
| Fed funds (mid‑2025) | 5.25–5.50% |
| Equipment financing spread vs 2021 | +200–300 bps |
Same Document Delivered
Dycom PESTLE Analysis
The Dycom PESTLE Analysis offers a concise evaluation of political, economic, social, technological, legal and environmental factors affecting Dycom. The content and structure shown in the preview is the same document you’ll download after payment. It’s fully formatted, professionally structured, and ready to use for strategic planning or investment decisions.
Description
Your Shortcut to Market Insight Starts Here
Unlock how political, economic, social, technological, legal and environmental forces are shaping Dycom’s strategic outlook in our concise PESTLE snapshot. This briefing highlights key external pressures and opportunities to inform investment and planning decisions. Buy the full PESTLE analysis to access detailed risks, forecasts and actionable recommendations—download instantly.
Political factors
Federal broadband funding priorities
Federal shifts in programs—notably the BEAD program with $42.45 billion from the Bipartisan Infrastructure Law—can markedly accelerate or delay Dycom’s fiber deployment pipelines as awards and timelines change. Tracking state allotments and state-set matching requirements is essential for bidding strategy and resource staging. Prioritizing relationships with state broadband offices improves influence over project timelines and eligibility criteria.
Permitting and “dig once” policies
Local and state streamlining of rights-of-way and trenching permits directly shortens project cycle times and protects Dycom margins by reducing idle labor and equipment costs. Advocacy for dig once ordinances lowers repeat street cuts, cutting per‑unit installation costs and rework. Maintaining a permitting center of excellence standardizes compliance across municipalities and accelerates approvals, improving bid accuracy and cash conversion.
Telecom spectrum and 5G rollout agendas
National spectrum auctions and carrier policy commitments set the cadence for Dycom’s 5G densification work. The FCC C-band auction in 2021 raised $81 billion, unlocking midband capacity that accelerated carrier small‑cell and macro upgrades. Capacity planning must align with announced C-band, 3.45 GHz and mmWave build waves. Geopolitical constraints such as US export controls and Huawei/ZTE entity‑list restrictions have already disrupted vendor supply chains and risk delaying deployments.
Infrastructure and utility grid modernization
Federal and state incentives — notably the Bipartisan Infrastructure Law's roughly 65 billion for power infrastructure and USDA ReConnect rounds totaling about 1.15 billion for rural upgrades — create adjacent revenue streams for Dycom when positioning integrated locating and construction services for multi-utility corridors, and require close tracking of public utility commission directives that shape multi-year capex plans.
- Federal funding: BIL ~65B for power
- Rural grants: USDA ReConnect ~1.15B
- Strategy: integrated locating + construction
- Regulatory focus: PUC directives drive long-term capex
Buy America and domestic content rules
Evolving Buy America and domestic content rules tied to the Bipartisan Infrastructure Law (about $550 billion new investment) are tightening material sourcing and can raise prices and cause supply delays for contractors like Dycom in 2024–25. Implement multi-supplier strategies and robust documentation systems to meet domestic-content audits and avoid funding disqualifications. Proactively communicate cost and lead-time impacts to customers to protect margins and negotiate pass-throughs.
- Impact: tighter sourcing => higher input costs, longer lead times
- Action: multi-supplier + documented compliance systems
- Customer: early notification of cost/lead-time changes to preserve margins
BEAD, C-band auctions and Buy America reshape fiber and 5G build timelines
Federal BEAD ($42.45B) and state allocations drive fiber rollouts and bidding; PUCs and state matching rules change timelines. Streamlined ROW/permitting and dig‑once ordinances cut cycle time and costs. Spectrum auctions (C‑band $81B) and 5G policies set carrier build cadence; export controls risk supply delays. Buy America/BIL sourcing rules tied to ~$550B infrastructure push raise input costs.
| Item | Value | Impact |
|---|---|---|
| BEAD | $42.45B | Fiber awards/timelines |
| C‑band auction | $81B | 5G densification |
| BIL power | $65B | Multi‑utility work |
| USDA ReConnect | $1.15B | Rural upgrades |
What is included in the product
Detailed Word Document
Explores how external macro-environmental factors uniquely affect Dycom across Political, Economic, Social, Technological, Environmental, and Legal dimensions, with each section backed by relevant data and current trends. Designed for executives and investors, it offers forward-looking insights and clean, report-ready formatting to guide strategy and funding decisions.
Customizable Excel Spreadsheet
A compact, visually segmented PESTLE summary for Dycom that clarifies external risks and opportunities at a glance, usable in presentations or planning sessions and easily shared across teams.
Economic factors
Carrier capex cycles and budget volatility
Large telco and cable MSO capex shifts drive Dycom revenue visibility and crew utilization; top U.S. carriers and MSOs accounted for roughly 65% of industry capex in 2024, concentrating demand. Diversifying across customers and regions smooths downturns and reduces single‑customer exposure. Flexible labor models and subcontractor pools let Dycom scale crews quickly as quarterly budgets move—often by up to 20% quarter‑over‑quarter.
Labor availability and wage inflation
Tight skilled-trades markets are increasing bid prices and delaying project delivery, with U.S. construction wages rising about 5% year-over-year in 2024 per BLS, amplifying labor cost risk for Dycom. Investing in training pipelines and retention reduces turnover and rework, improving productivity. Indexing contracts to wage escalators where possible protects project margins against ongoing wage inflation.
Interest rates and bonding capacity
Higher policy rates (Fed funds ~5.25–5.50% mid‑2025) have pushed equipment financing spreads up roughly 200–300 bps versus 2021, raising Dycom’s capital costs and tightening client ROI thresholds. Maintaining ample liquidity and full surety lines—performance bonds often sized to 100% of contract value—is essential to win large multi‑year awards. Dycom should optimize fleet ownership versus rental to limit interest sensitivity and preserve bonding headroom.
Material costs and supply-chain resilience
Fiber, conduit and electronics price swings change Dycom bid assumptions and can compress margins; firms often face volatile input costs tied to global raw-material cycles.
Locking pricing via frame agreements and hedging where feasible stabilizes unit costs and protects backlog profitability.
Maintaining buffer inventories for critical components reduces risk of project delays and liquidated-damages exposure.
- price volatility: affects bids
- hedging: lock rates
- agreements: frame contracts
- buffers: prevent delays
Regional economic growth and housing starts
Regional suburban expansions and new housing starts drive last-mile connectivity demand as homebuilding supports fiber and service extensions; US housing starts averaged about 1.5 million annualized in 2024 (U.S. Census Bureau). Prioritize markets with sustained population inflows and business formation—Sun Belt and selected metro suburbs showing fastest growth remain strategic. Calibrate satellite yards to reduce mobilization costs and shorten response times for turn-up and maintenance.
- Target markets: Sun Belt metros, high single‑family starts
- Metric: US housing starts ~1.5M (2024)
- Operational: satellite yards to cut mobilization and response times
- Strategy: align bids with local permits and business formation rates
BEAD, C-band auctions and Buy America reshape fiber and 5G build timelines
Large carrier/MSO capex concentration (~65% of industry capex in 2024) and US housing starts (~1.5M annualized 2024) drive Dycom demand concentration and regional focus; construction wages rose ~5% YoY (BLS 2024), pressuring margins. Fed funds ~5.25–5.50% (mid‑2025) and equipment spreads +200–300 bps vs 2021 raise capital costs; bonding often equals 100% contract value, so liquidity and hedges matter.
| Metric | Value |
|---|---|
| Carrier/MSO capex share (2024) | ~65% |
| US housing starts (2024) | ~1.5M annualized |
| Construction wage growth (2024) | ~+5% YoY (BLS) |
| Fed funds (mid‑2025) | 5.25–5.50% |
| Equipment financing spread vs 2021 | +200–300 bps |
Same Document Delivered
Dycom PESTLE Analysis
The Dycom PESTLE Analysis offers a concise evaluation of political, economic, social, technological, legal and environmental factors affecting Dycom. The content and structure shown in the preview is the same document you’ll download after payment. It’s fully formatted, professionally structured, and ready to use for strategic planning or investment decisions.











