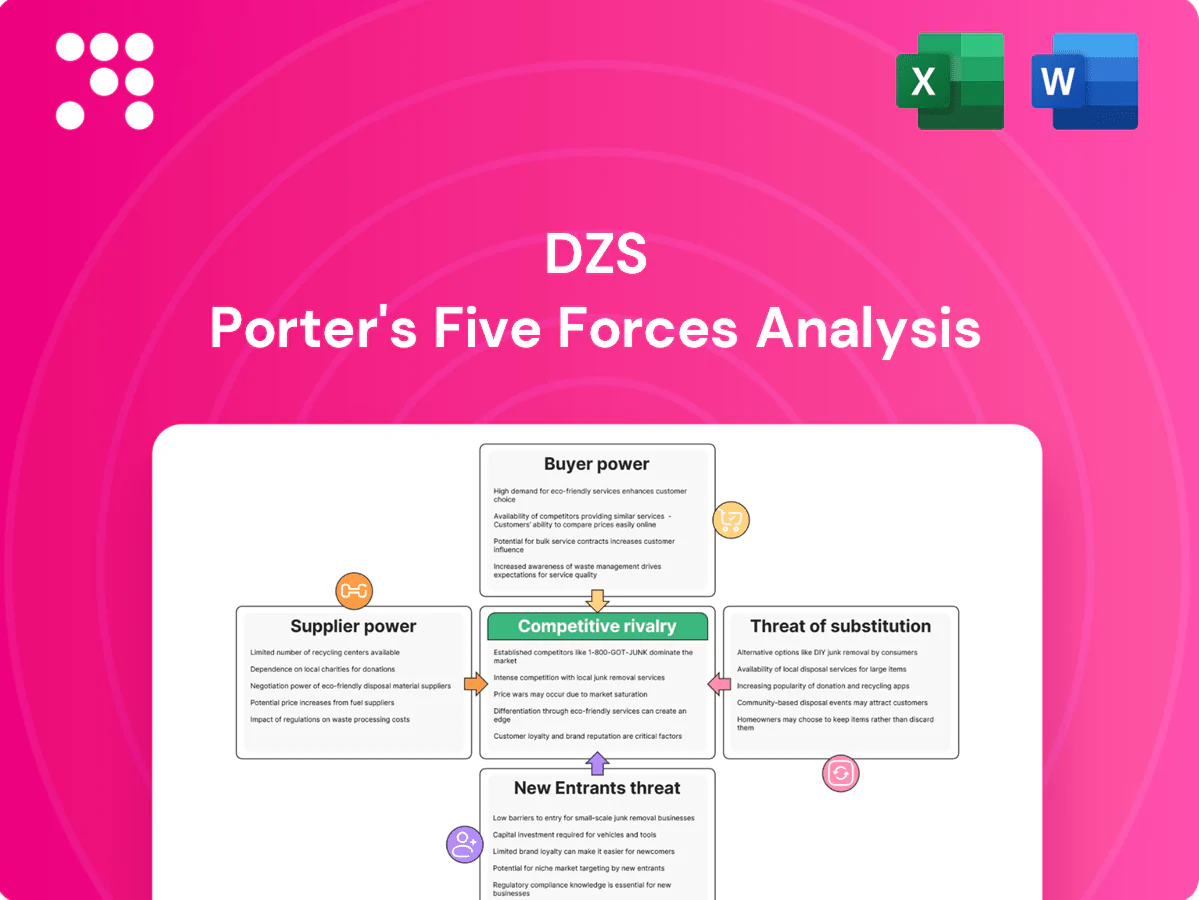
DZS Porter's Five Forces Analysis

Don't Miss the Bigger Picture
DZS faces moderate buyer power, evolving supplier dynamics, and increasing rivalry as connectivity markets consolidate; threats from substitutes and new entrants hinge on technology and scale. Strategic positioning depends on margins, partnerships, and IP moat. This brief snapshot only scratches the surface. Unlock the full Porter's Five Forces Analysis to explore DZS’s competitive dynamics in detail.
Suppliers Bargaining Power

Concentrated chip suppliers
Optical and networking silicon in 2024 remains concentrated, with analysts estimating the top three vendors control over 60% of merchant silicon, giving suppliers pricing and allocation leverage.
Historic shortages and node transitions continue to squeeze margins and delay shipments, forcing DZS to dual-source and design around constraints.
Long-term agreements mitigate but do not eliminate supplier risk, as allocation shifts can still disrupt quarterly deliveries.
Specialized optics and modules
Specialized PON optics, coherent modules and precision timing parts are niche and spec-heavy, with supplier pools small enough that top four vendors held over 70% of addressable coherent-optics supply in 2024; qualification timelines commonly ran 6–12 months and lead times 12–24 weeks. Any yield or quality hiccup cascades through delivery schedules, so vendor-managed inventory and strict QA (incoming inspection, ATE) are used to mitigate exposure.

Contract manufacturing dependence
Dependence on contract manufacturers gives EMS partners leverage over cost, lead times and flexibility, with the global EMS market surpassing $500 billion in 2024, concentrating bargaining power. Labor shifts or geopolitical events can compress throughput and spike pricing, as seen in 2021–24 supply shocks. Diversifying manufacturing geographies and holding 6–12 weeks of buffer stock improves resilience. Design-for-manufacture cuts changeover friction and supplier negotiation leverage.

Standards and software stacks
Reliance on standards-compliant firmware, third-party SDKs and open-source components creates switching frictions that shape supplier power; 98% of codebases include open-source components (Synopsys 2023). Licensing terms and support SLAs influence total cost and roadmap flexibility, while in-house abstraction reduces lock-in at the cost of engineering overhead and compliance testing that extends time-to-market.
- Standards/OSS lock-in
- Licensing & SLAs drive TCO
- Abstraction reduces lock-in, raises costs
- Compliance adds weeks–months to launch
Logistics and rare materials
Global logistics costs and availability directly raise landed cost and affect delivery reliability; container freight averaged roughly $2,000 per FEU in 2024, often contributing 10–15% of landed cost, while port congestion increased lead-time variability. Rare earths and specialty materials showed high volatility in 2024, with NdPr swings near 30% y/y, pressuring input costs. Use of forward freight agreements and commodity hedges has materially reduced spot-driven swings, and design substitutions can cut exposure to scarce inputs by significant percentages.
- Logistics impact: ~ $2,000/FEU (2024); 10–15% of landed cost
- Rare materials: NdPr volatility ~30% y/y (2024)
- Mitigation: FFAs/hedging reduce freight volatility
- Design substitutions: can lower scarce-input exposure materially
High supplier concentration (>60%, >70%) and 6–24wk lead times raise allocation risk
Supplier power is high: top-three merchant silicon vendors >60% share and top-four coherent-optics >70% in 2024, giving pricing and allocation leverage.
Qualification timelines of 6–12 months and lead times of 12–24 weeks magnify disruption risk; EMS market size >$500B (2024) concentrates manufacturing leverage.
Logistics and materials drive cost volatility: freight ~ $2,000/FEU (10–15% landed cost) and NdPr swings ~30% y/y (2024); 6–12 weeks buffer and hedges commonly used.
| Metric | 2024 value |
|---|---|
| Top-3 merchant silicon share | >60% |
| Top-4 coherent supply | >70% |
| EMS market | >$500B |
| Freight | ~$2,000/FEU (10–15%) |
| NdPr volatility | ~30% y/y |
| Qual lead times | 6–12 months; 12–24 weeks |
What is included in the product
 Detailed Word Document
Tailored Porter’s Five Forces analysis for DZS that uncovers competitive drivers, evaluates supplier and buyer power, threat of substitutes and new entrants, and highlights disruptive risks and strategic defenses for investors, executives, and analysts.

 Customizable Excel Spreadsheet
One-sheet DZS Porter's Five Forces that instantly visualizes competitive pressure with a customizable spider chart—no macros, easy to edit, and ready to drop into decks or dashboards for quick strategic decisions.
Customers Bargaining Power

Carrier concentration
Telcos, ISPs and cable operators run formal RFPs; the top three US mobile carriers held ~93% of mobile subscribers in 2024, while Comcast and Charter together served ~57% of US cable broadband customers in 2024. High deal sizes and few strategic accounts create severe pricing pressure, and losing a single multi‑million RFP can materially cut pipeline. Multi‑year frameworks stabilize volumes but at tight margins.
High switching costs
Integration into OSS/BSS, field operations, and network standards raises switching barriers—OSS/BSS replacements typically span 18–36 months and lifetime TCO is evaluated over 5–10 years, which empowers buyers to negotiate aggressively. Vendors must deliver feature parity and pass interoperability testing (often >95% test success) to win conversions. Strong 24/7 support and SLAs cut churn materially, commonly reducing voluntary churn by 20–30%.

Price and performance sensitivity
Capex cycles and ARPU pressures in 2024 keep buyers focused on unit economics, driving negotiations toward cost per port and life‑time OPEX. Benchmarks such as 10 Gbps access, sub‑millisecond latency targets and 100 Gbps transport, plus power-per-port goals, set hard technical comparators. Buyers now demand clear roadmaps for 10G/25G/50G PON evolution and transport upgrades. Value‑add software and analytics bundles often soften pure price comparisons.

Global compliance demands
Buyers demand certifications, security hardening, and localization; failure to meet regulatory or security requirements is disqualifying, giving purchasers strong leverage and lengthening vendor qualification timelines. In 2024 many large public-sector tenders required data residency and at least one ISO/IEC or SOC attestation, raising vendor qualification costs materially and favoring incumbents with regional references and proven deployments.
- Higher buyer leverage
- Qualification cost uplift: regional certifications
- Disqualifying non-compliance
- Proven regional references accelerate trust
Service-level expectations
Service-level expectations drive customer bargaining power: 99.999% availability and rapid RMA (48–72 hours) are table stakes for access and transport. SLA penalties—commonly 1–10% credits or liquidated damages—shift risk to vendors and compress margins. Spares programs and remote diagnostics cut MTTR by about 30–40% and act as differentiators, while strong field engineering presence correlates with roughly 15% higher renewal rates.
- 99.999% availability; 48–72h RMA
- SLA penalties 1–10% shift vendor risk
- Spares + remote diagnostics → MTTR −30–40%
- Field engineering → ~15% higher renewals
Buyers wield leverage: winner-take-most RFPs, long OSS/BSS cycles and strict SLAs squeeze margins
Buyers hold high leverage: top-3 US mobile ~93% share (2024) and Comcast+Charter ~57% cable broadband (2024), making RFPs winner-take-most. Long OSS/BSS lifecycles (18–36 months) and 5–10y TCO empower aggressive price negotiation. SLAs (99.999%, 48–72h RMA) and certification demands raise qualification costs and favor incumbents.
| Metric | 2024 value | Impact |
|---|---|---|
| Top-3 mobile share | ~93% | High buyer leverage |
| Comcast+Charter broadband | ~57% | Concentrated procurement |
| OSS/BSS life | 18–36 months | Switching barriers |
| SLA | 99.999% / 48–72h RMA | Margin pressure |
Preview the Actual Deliverable
DZS Porter's Five Forces Analysis
This preview shows the exact DZS Porter's Five Forces Analysis you'll receive immediately after purchase—no surprises or placeholders. The document is fully formatted, professionally written, and ready for download and use the moment you buy. You're viewing the final deliverable: the same file you'll get instantly after payment.

Don't Miss the Bigger Picture
DZS faces moderate buyer power, evolving supplier dynamics, and increasing rivalry as connectivity markets consolidate; threats from substitutes and new entrants hinge on technology and scale. Strategic positioning depends on margins, partnerships, and IP moat. This brief snapshot only scratches the surface. Unlock the full Porter's Five Forces Analysis to explore DZS’s competitive dynamics in detail.
Suppliers Bargaining Power
Concentrated chip suppliers
Optical and networking silicon in 2024 remains concentrated, with analysts estimating the top three vendors control over 60% of merchant silicon, giving suppliers pricing and allocation leverage.
Historic shortages and node transitions continue to squeeze margins and delay shipments, forcing DZS to dual-source and design around constraints.
Long-term agreements mitigate but do not eliminate supplier risk, as allocation shifts can still disrupt quarterly deliveries.
Specialized optics and modules
Specialized PON optics, coherent modules and precision timing parts are niche and spec-heavy, with supplier pools small enough that top four vendors held over 70% of addressable coherent-optics supply in 2024; qualification timelines commonly ran 6–12 months and lead times 12–24 weeks. Any yield or quality hiccup cascades through delivery schedules, so vendor-managed inventory and strict QA (incoming inspection, ATE) are used to mitigate exposure.
Contract manufacturing dependence
Dependence on contract manufacturers gives EMS partners leverage over cost, lead times and flexibility, with the global EMS market surpassing $500 billion in 2024, concentrating bargaining power. Labor shifts or geopolitical events can compress throughput and spike pricing, as seen in 2021–24 supply shocks. Diversifying manufacturing geographies and holding 6–12 weeks of buffer stock improves resilience. Design-for-manufacture cuts changeover friction and supplier negotiation leverage.
Standards and software stacks
Reliance on standards-compliant firmware, third-party SDKs and open-source components creates switching frictions that shape supplier power; 98% of codebases include open-source components (Synopsys 2023). Licensing terms and support SLAs influence total cost and roadmap flexibility, while in-house abstraction reduces lock-in at the cost of engineering overhead and compliance testing that extends time-to-market.
- Standards/OSS lock-in
- Licensing & SLAs drive TCO
- Abstraction reduces lock-in, raises costs
- Compliance adds weeks–months to launch
Logistics and rare materials
Global logistics costs and availability directly raise landed cost and affect delivery reliability; container freight averaged roughly $2,000 per FEU in 2024, often contributing 10–15% of landed cost, while port congestion increased lead-time variability. Rare earths and specialty materials showed high volatility in 2024, with NdPr swings near 30% y/y, pressuring input costs. Use of forward freight agreements and commodity hedges has materially reduced spot-driven swings, and design substitutions can cut exposure to scarce inputs by significant percentages.
- Logistics impact: ~ $2,000/FEU (2024); 10–15% of landed cost
- Rare materials: NdPr volatility ~30% y/y (2024)
- Mitigation: FFAs/hedging reduce freight volatility
- Design substitutions: can lower scarce-input exposure materially
High supplier concentration (>60%, >70%) and 6–24wk lead times raise allocation risk
Supplier power is high: top-three merchant silicon vendors >60% share and top-four coherent-optics >70% in 2024, giving pricing and allocation leverage.
Qualification timelines of 6–12 months and lead times of 12–24 weeks magnify disruption risk; EMS market size >$500B (2024) concentrates manufacturing leverage.
Logistics and materials drive cost volatility: freight ~ $2,000/FEU (10–15% landed cost) and NdPr swings ~30% y/y (2024); 6–12 weeks buffer and hedges commonly used.
| Metric | 2024 value |
|---|---|
| Top-3 merchant silicon share | >60% |
| Top-4 coherent supply | >70% |
| EMS market | >$500B |
| Freight | ~$2,000/FEU (10–15%) |
| NdPr volatility | ~30% y/y |
| Qual lead times | 6–12 months; 12–24 weeks |
What is included in the product
Detailed Word Document
Tailored Porter’s Five Forces analysis for DZS that uncovers competitive drivers, evaluates supplier and buyer power, threat of substitutes and new entrants, and highlights disruptive risks and strategic defenses for investors, executives, and analysts.
Customizable Excel Spreadsheet
One-sheet DZS Porter's Five Forces that instantly visualizes competitive pressure with a customizable spider chart—no macros, easy to edit, and ready to drop into decks or dashboards for quick strategic decisions.
Customers Bargaining Power
Carrier concentration
Telcos, ISPs and cable operators run formal RFPs; the top three US mobile carriers held ~93% of mobile subscribers in 2024, while Comcast and Charter together served ~57% of US cable broadband customers in 2024. High deal sizes and few strategic accounts create severe pricing pressure, and losing a single multi‑million RFP can materially cut pipeline. Multi‑year frameworks stabilize volumes but at tight margins.
High switching costs
Integration into OSS/BSS, field operations, and network standards raises switching barriers—OSS/BSS replacements typically span 18–36 months and lifetime TCO is evaluated over 5–10 years, which empowers buyers to negotiate aggressively. Vendors must deliver feature parity and pass interoperability testing (often >95% test success) to win conversions. Strong 24/7 support and SLAs cut churn materially, commonly reducing voluntary churn by 20–30%.
Price and performance sensitivity
Capex cycles and ARPU pressures in 2024 keep buyers focused on unit economics, driving negotiations toward cost per port and life‑time OPEX. Benchmarks such as 10 Gbps access, sub‑millisecond latency targets and 100 Gbps transport, plus power-per-port goals, set hard technical comparators. Buyers now demand clear roadmaps for 10G/25G/50G PON evolution and transport upgrades. Value‑add software and analytics bundles often soften pure price comparisons.
Global compliance demands
Buyers demand certifications, security hardening, and localization; failure to meet regulatory or security requirements is disqualifying, giving purchasers strong leverage and lengthening vendor qualification timelines. In 2024 many large public-sector tenders required data residency and at least one ISO/IEC or SOC attestation, raising vendor qualification costs materially and favoring incumbents with regional references and proven deployments.
- Higher buyer leverage
- Qualification cost uplift: regional certifications
- Disqualifying non-compliance
- Proven regional references accelerate trust
Service-level expectations
Service-level expectations drive customer bargaining power: 99.999% availability and rapid RMA (48–72 hours) are table stakes for access and transport. SLA penalties—commonly 1–10% credits or liquidated damages—shift risk to vendors and compress margins. Spares programs and remote diagnostics cut MTTR by about 30–40% and act as differentiators, while strong field engineering presence correlates with roughly 15% higher renewal rates.
- 99.999% availability; 48–72h RMA
- SLA penalties 1–10% shift vendor risk
- Spares + remote diagnostics → MTTR −30–40%
- Field engineering → ~15% higher renewals
Buyers wield leverage: winner-take-most RFPs, long OSS/BSS cycles and strict SLAs squeeze margins
Buyers hold high leverage: top-3 US mobile ~93% share (2024) and Comcast+Charter ~57% cable broadband (2024), making RFPs winner-take-most. Long OSS/BSS lifecycles (18–36 months) and 5–10y TCO empower aggressive price negotiation. SLAs (99.999%, 48–72h RMA) and certification demands raise qualification costs and favor incumbents.
| Metric | 2024 value | Impact |
|---|---|---|
| Top-3 mobile share | ~93% | High buyer leverage |
| Comcast+Charter broadband | ~57% | Concentrated procurement |
| OSS/BSS life | 18–36 months | Switching barriers |
| SLA | 99.999% / 48–72h RMA | Margin pressure |
Preview the Actual Deliverable
DZS Porter's Five Forces Analysis
This preview shows the exact DZS Porter's Five Forces Analysis you'll receive immediately after purchase—no surprises or placeholders. The document is fully formatted, professionally written, and ready for download and use the moment you buy. You're viewing the final deliverable: the same file you'll get instantly after payment.
Original: $10.00
-65%$10.00
$3.50Description
Don't Miss the Bigger Picture
DZS faces moderate buyer power, evolving supplier dynamics, and increasing rivalry as connectivity markets consolidate; threats from substitutes and new entrants hinge on technology and scale. Strategic positioning depends on margins, partnerships, and IP moat. This brief snapshot only scratches the surface. Unlock the full Porter's Five Forces Analysis to explore DZS’s competitive dynamics in detail.
Suppliers Bargaining Power
Concentrated chip suppliers
Optical and networking silicon in 2024 remains concentrated, with analysts estimating the top three vendors control over 60% of merchant silicon, giving suppliers pricing and allocation leverage.
Historic shortages and node transitions continue to squeeze margins and delay shipments, forcing DZS to dual-source and design around constraints.
Long-term agreements mitigate but do not eliminate supplier risk, as allocation shifts can still disrupt quarterly deliveries.
Specialized optics and modules
Specialized PON optics, coherent modules and precision timing parts are niche and spec-heavy, with supplier pools small enough that top four vendors held over 70% of addressable coherent-optics supply in 2024; qualification timelines commonly ran 6–12 months and lead times 12–24 weeks. Any yield or quality hiccup cascades through delivery schedules, so vendor-managed inventory and strict QA (incoming inspection, ATE) are used to mitigate exposure.
Contract manufacturing dependence
Dependence on contract manufacturers gives EMS partners leverage over cost, lead times and flexibility, with the global EMS market surpassing $500 billion in 2024, concentrating bargaining power. Labor shifts or geopolitical events can compress throughput and spike pricing, as seen in 2021–24 supply shocks. Diversifying manufacturing geographies and holding 6–12 weeks of buffer stock improves resilience. Design-for-manufacture cuts changeover friction and supplier negotiation leverage.
Standards and software stacks
Reliance on standards-compliant firmware, third-party SDKs and open-source components creates switching frictions that shape supplier power; 98% of codebases include open-source components (Synopsys 2023). Licensing terms and support SLAs influence total cost and roadmap flexibility, while in-house abstraction reduces lock-in at the cost of engineering overhead and compliance testing that extends time-to-market.
- Standards/OSS lock-in
- Licensing & SLAs drive TCO
- Abstraction reduces lock-in, raises costs
- Compliance adds weeks–months to launch
Logistics and rare materials
Global logistics costs and availability directly raise landed cost and affect delivery reliability; container freight averaged roughly $2,000 per FEU in 2024, often contributing 10–15% of landed cost, while port congestion increased lead-time variability. Rare earths and specialty materials showed high volatility in 2024, with NdPr swings near 30% y/y, pressuring input costs. Use of forward freight agreements and commodity hedges has materially reduced spot-driven swings, and design substitutions can cut exposure to scarce inputs by significant percentages.
- Logistics impact: ~ $2,000/FEU (2024); 10–15% of landed cost
- Rare materials: NdPr volatility ~30% y/y (2024)
- Mitigation: FFAs/hedging reduce freight volatility
- Design substitutions: can lower scarce-input exposure materially
High supplier concentration (>60%, >70%) and 6–24wk lead times raise allocation risk
Supplier power is high: top-three merchant silicon vendors >60% share and top-four coherent-optics >70% in 2024, giving pricing and allocation leverage.
Qualification timelines of 6–12 months and lead times of 12–24 weeks magnify disruption risk; EMS market size >$500B (2024) concentrates manufacturing leverage.
Logistics and materials drive cost volatility: freight ~ $2,000/FEU (10–15% landed cost) and NdPr swings ~30% y/y (2024); 6–12 weeks buffer and hedges commonly used.
| Metric | 2024 value |
|---|---|
| Top-3 merchant silicon share | >60% |
| Top-4 coherent supply | >70% |
| EMS market | >$500B |
| Freight | ~$2,000/FEU (10–15%) |
| NdPr volatility | ~30% y/y |
| Qual lead times | 6–12 months; 12–24 weeks |
What is included in the product
Detailed Word Document
Tailored Porter’s Five Forces analysis for DZS that uncovers competitive drivers, evaluates supplier and buyer power, threat of substitutes and new entrants, and highlights disruptive risks and strategic defenses for investors, executives, and analysts.
Customizable Excel Spreadsheet
One-sheet DZS Porter's Five Forces that instantly visualizes competitive pressure with a customizable spider chart—no macros, easy to edit, and ready to drop into decks or dashboards for quick strategic decisions.
Customers Bargaining Power
Carrier concentration
Telcos, ISPs and cable operators run formal RFPs; the top three US mobile carriers held ~93% of mobile subscribers in 2024, while Comcast and Charter together served ~57% of US cable broadband customers in 2024. High deal sizes and few strategic accounts create severe pricing pressure, and losing a single multi‑million RFP can materially cut pipeline. Multi‑year frameworks stabilize volumes but at tight margins.
High switching costs
Integration into OSS/BSS, field operations, and network standards raises switching barriers—OSS/BSS replacements typically span 18–36 months and lifetime TCO is evaluated over 5–10 years, which empowers buyers to negotiate aggressively. Vendors must deliver feature parity and pass interoperability testing (often >95% test success) to win conversions. Strong 24/7 support and SLAs cut churn materially, commonly reducing voluntary churn by 20–30%.
Price and performance sensitivity
Capex cycles and ARPU pressures in 2024 keep buyers focused on unit economics, driving negotiations toward cost per port and life‑time OPEX. Benchmarks such as 10 Gbps access, sub‑millisecond latency targets and 100 Gbps transport, plus power-per-port goals, set hard technical comparators. Buyers now demand clear roadmaps for 10G/25G/50G PON evolution and transport upgrades. Value‑add software and analytics bundles often soften pure price comparisons.
Global compliance demands
Buyers demand certifications, security hardening, and localization; failure to meet regulatory or security requirements is disqualifying, giving purchasers strong leverage and lengthening vendor qualification timelines. In 2024 many large public-sector tenders required data residency and at least one ISO/IEC or SOC attestation, raising vendor qualification costs materially and favoring incumbents with regional references and proven deployments.
- Higher buyer leverage
- Qualification cost uplift: regional certifications
- Disqualifying non-compliance
- Proven regional references accelerate trust
Service-level expectations
Service-level expectations drive customer bargaining power: 99.999% availability and rapid RMA (48–72 hours) are table stakes for access and transport. SLA penalties—commonly 1–10% credits or liquidated damages—shift risk to vendors and compress margins. Spares programs and remote diagnostics cut MTTR by about 30–40% and act as differentiators, while strong field engineering presence correlates with roughly 15% higher renewal rates.
- 99.999% availability; 48–72h RMA
- SLA penalties 1–10% shift vendor risk
- Spares + remote diagnostics → MTTR −30–40%
- Field engineering → ~15% higher renewals
Buyers wield leverage: winner-take-most RFPs, long OSS/BSS cycles and strict SLAs squeeze margins
Buyers hold high leverage: top-3 US mobile ~93% share (2024) and Comcast+Charter ~57% cable broadband (2024), making RFPs winner-take-most. Long OSS/BSS lifecycles (18–36 months) and 5–10y TCO empower aggressive price negotiation. SLAs (99.999%, 48–72h RMA) and certification demands raise qualification costs and favor incumbents.
| Metric | 2024 value | Impact |
|---|---|---|
| Top-3 mobile share | ~93% | High buyer leverage |
| Comcast+Charter broadband | ~57% | Concentrated procurement |
| OSS/BSS life | 18–36 months | Switching barriers |
| SLA | 99.999% / 48–72h RMA | Margin pressure |
Preview the Actual Deliverable
DZS Porter's Five Forces Analysis
This preview shows the exact DZS Porter's Five Forces Analysis you'll receive immediately after purchase—no surprises or placeholders. The document is fully formatted, professionally written, and ready for download and use the moment you buy. You're viewing the final deliverable: the same file you'll get instantly after payment.











