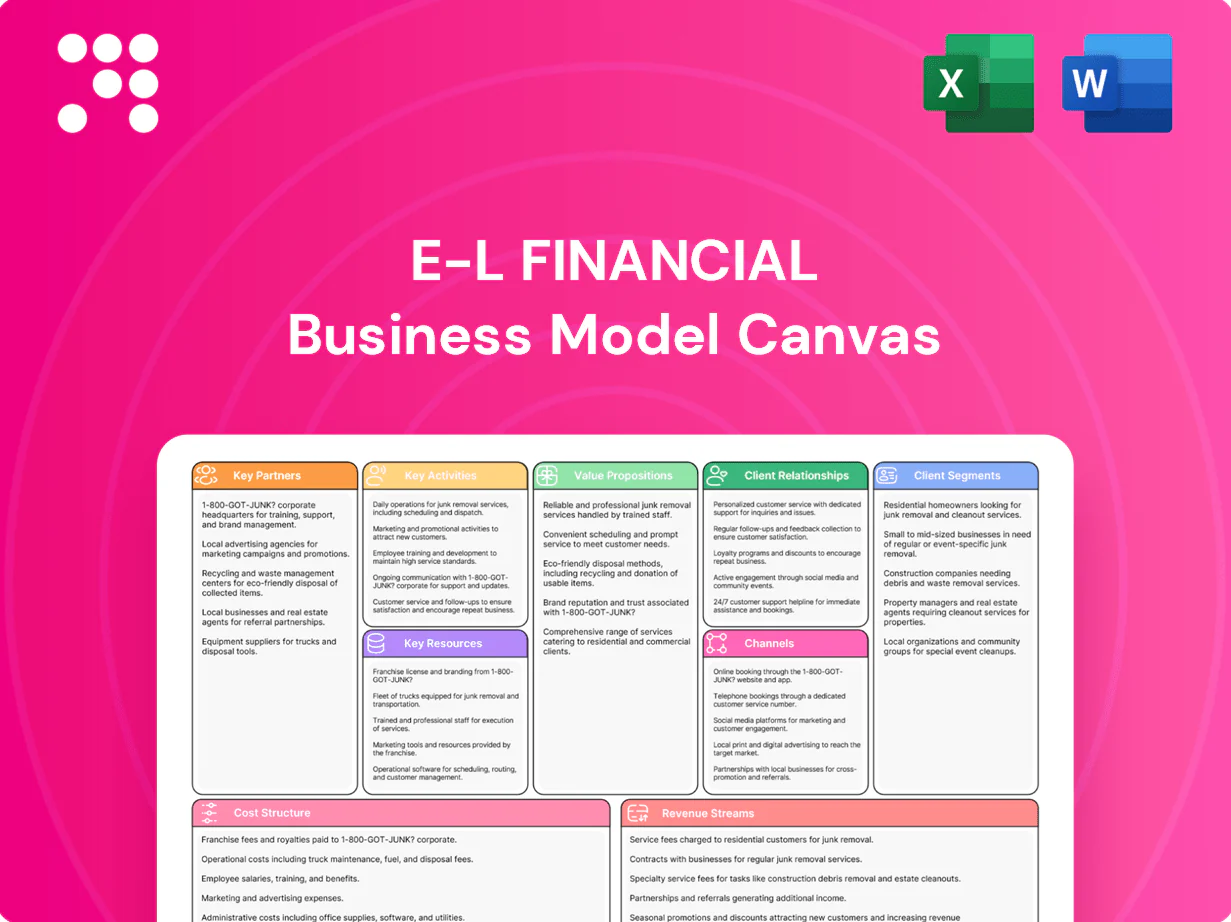
E-L Financial Business Model Canvas

Editable Business Model Canvas: Strategic Blueprint for Investors and Strategists
Unlock the full strategic blueprint behind E-L Financial with our complete Business Model Canvas. This in-depth, editable Canvas maps value propositions, key partners, revenue streams and cost structure across all nine blocks. Ideal for investors and strategists—download the Word/Excel file to apply insights and accelerate your analysis.
Partnerships

Institutional co-investors
Partnering with pension funds and sovereigns—which held over $60 trillion combined in 2024—enables access to larger transactions and improved terms. Co-investment structures typically lower fee drag by ~1–2% annually and align multi-decade horizons. These relationships expand deal flow across insurance, wealth management, real assets and resources, while sharing risk and bringing diversified sector expertise.
Asset managers and GPs
Relationships with top-tier private equity, private credit, real estate and natural resources managers provide sector-specific sourcing and operating know-how, leveraging that private capital AUM exceeded $11 trillion as of 2024 (Preqin). They enable flexible allocations across cycles and negotiating fee structures for scale—top managers often secure fee breaks as AUM rises. Ongoing manager due diligence strengthens governance and enhances return dispersion control.

Life insurers and reinsurers
Strategic alliances with reinsurers enhance E-L Financial's capital efficiency and risk transfer for life portfolios, reflecting a reinsurance market that posted roughly $324 billion in global premiums in 2024 (Swiss Re Institute). Product partnerships accelerate innovation and speed to market, while joint underwriting insights improve pricing and reserving discipline. These relationships also diversify mortality, lapse and longevity exposures across cohorts and geographies.

Banks and capital markets firms
Treasury, underwriting and syndication partners reduce financing costs and boost liquidity, often cutting spreads by tens of basis points and enabling larger placements for ALM. Research access supplies macro and sector views that inform positioning amid 2024 policy rates near 5.25%. Structured solutions and trading relationships optimize regulatory capital and execution across public markets.
- Funding: lower spreads, improved liquidity
- Research: macro/sector signals for duration and credit
- Solutions: ALM optimization, capital efficiency, better execution
Regulatory and industry bodies
Engagement with regulators, standards boards, and industry associations ensures compliance and foresight on rule changes and helps shape emerging insurance and investment frameworks such as IFRS S2; IAIS has over 200 members. Knowledge sharing from these partnerships improves risk management practices and reduces regulatory friction, reinforcing reputation and stakeholder trust.
- Regulatory foresight — early access to rule changes
- Framework influence — IFRS S2, IAIS engagement
- Risk management — shared best practices
- Reputation — stronger stakeholder trust
Partnerships with pensions, private managers and reinsurers increase deal flow and cut fees
Key partnerships: pension/sovereign capital (~$60T in 2024) and top private managers (~$11T) expand deal flow and reduce fee drag ~1–2% via co-investments. Reinsurers (global premiums ~$324B in 2024) and syndication partners enhance capital efficiency and lower spreads. Research and regulators (IAIS 200+ members) provide macro foresight and compliance support for ALM.
| Partner | 2024 metric | Benefit |
|---|---|---|
| Pension/Sovereign | $60T AUM | Large deals, lower fees |
| Private managers | $11T private AUM | Sourcing, sector expertise |
| Reinsurers | $324B premiums | Risk transfer, capital |
| Regulators/IAIS | 200+ members | Foresight, compliance |
What is included in the product
 Detailed Word Document
A comprehensive, pre-written Business Model Canvas for E-L Financial that maps the 9 BMC blocks with detailed customer segments, channels, value propositions and revenue/cost structures, reflecting real-world operations and strategic plans. Includes competitive-advantage analysis and linked SWOT insights ideal for presentations, investor discussions and decision-making by entrepreneurs and analysts.

 Customizable Excel Spreadsheet
Condenses E-L Financial’s strategy into a digestible, one-page Business Model Canvas with editable cells, saving hours of formatting while enabling quick comparisons, team collaboration, and board-ready presentations.
Activities

Portfolio allocation and rebalancing
Dynamic capital deployment across insurance, wealth, real assets, and resources targets risk-adjusted returns by shifting exposures to capture valuation spreads and macro cycles, guided by current policy conditions such as the 2024 federal funds rate at 5.25–5.50%. Strategic tilts overweight assets showing favorable spreads while underweighting overbought segments. Disciplined rebalancing enforces target risk bands and liquidity buffers. Governance sets thresholds and pacing for shifts.
M&A and minority acquisitions
Sourcing, diligencing, and structuring control and minority stakes are core activities, prioritizing durable cash generators with defensible moats and predictable free cash flow.
Integration planning emphasizes preserving management talent and capturing revenue and cost synergies while respecting minority protections and governance rights.
Post-close oversight tracks KPIs, covenant compliance, and risk metrics through regular reporting and board or observer engagement to protect value.

Active ownership and governance
Active ownership combines board participation, incentive design, and capital-allocation oversight to drive value creation through targeted governance interventions. Operating reviews monitor revenue growth, margin trajectories, and capital intensity to ensure performance targets are met. Risk frameworks tie policies to solvency and liquidity requirements, with metrics reviewed regularly. Remediation plans trigger rapid corrective actions for underperformance.

ALM and risk management
ALM aligns cashflows to protect solvency and earnings stability; global banks reported median CET1 about 14% in 2024, giving capital buffer. Active hedging reduces rate, credit, equity and FX exposures while the Fed funds target range in 2024 (5.25–5.50%) raises interest-rate risk. Scenario testing and stress analysis set required buffers and risk appetite drives position sizing and leverage.
- Asset-liability matching: solvency protection
- Hedging: rates/credit/equity/FX
- Stress tests: buffer calibration
- Risk appetite: sizing & leverage
Investor reporting and compliance
Timely, transparent disclosure builds credibility and trust; EU CSRD began phased reporting in 2024 for companies with more than 500 employees, increasing ESG disclosure expectations. Regulatory filings, audit coordination and ESG reporting are maintained to meet evolving standards. Regular performance attribution—typically monthly or quarterly—clarifies sources of return and risk. Stakeholder communications align expectations across investors, boards and regulators.
- Timeliness: monthly/quarterly reports
- Compliance: EU CSRD 2024 (>500 employees)
- Audit: coordinated external audits
- Attribution: source-level returns
- Stakeholders: aligned expectations
Capital deployment across insurance, wealth & real assets — Fed 5.25–5.50%, CET1 ~14%
E-L Financial focuses on dynamic capital deployment across insurance, wealth, real assets and resources, guided by Fed funds 2024 at 5.25–5.50% and global bank median CET1 ~14% in 2024. Core activities: sourcing & structuring cash-generating businesses, active ownership to drive synergies, ALM/hedging and disciplined reporting under EU CSRD 2024 (>500 employees).
| Activity | 2024 Metric |
|---|---|
| Rates | Fed 5.25–5.50% |
| Capital | CET1 ~14% |
| Reporting | CSRD phased 2024 |
Full Version Awaits
Business Model Canvas
The E-L Financial Business Model Canvas you’re previewing is the actual deliverable, not a mockup. When you purchase, you’ll receive this exact file with all content and pages included. The document is ready-to-edit and formatted for immediate use in Word and Excel. No surprises—what you see is what you’ll get.

Editable Business Model Canvas: Strategic Blueprint for Investors and Strategists
Unlock the full strategic blueprint behind E-L Financial with our complete Business Model Canvas. This in-depth, editable Canvas maps value propositions, key partners, revenue streams and cost structure across all nine blocks. Ideal for investors and strategists—download the Word/Excel file to apply insights and accelerate your analysis.
Partnerships
Institutional co-investors
Partnering with pension funds and sovereigns—which held over $60 trillion combined in 2024—enables access to larger transactions and improved terms. Co-investment structures typically lower fee drag by ~1–2% annually and align multi-decade horizons. These relationships expand deal flow across insurance, wealth management, real assets and resources, while sharing risk and bringing diversified sector expertise.
Asset managers and GPs
Relationships with top-tier private equity, private credit, real estate and natural resources managers provide sector-specific sourcing and operating know-how, leveraging that private capital AUM exceeded $11 trillion as of 2024 (Preqin). They enable flexible allocations across cycles and negotiating fee structures for scale—top managers often secure fee breaks as AUM rises. Ongoing manager due diligence strengthens governance and enhances return dispersion control.
Life insurers and reinsurers
Strategic alliances with reinsurers enhance E-L Financial's capital efficiency and risk transfer for life portfolios, reflecting a reinsurance market that posted roughly $324 billion in global premiums in 2024 (Swiss Re Institute). Product partnerships accelerate innovation and speed to market, while joint underwriting insights improve pricing and reserving discipline. These relationships also diversify mortality, lapse and longevity exposures across cohorts and geographies.
Banks and capital markets firms
Treasury, underwriting and syndication partners reduce financing costs and boost liquidity, often cutting spreads by tens of basis points and enabling larger placements for ALM. Research access supplies macro and sector views that inform positioning amid 2024 policy rates near 5.25%. Structured solutions and trading relationships optimize regulatory capital and execution across public markets.
- Funding: lower spreads, improved liquidity
- Research: macro/sector signals for duration and credit
- Solutions: ALM optimization, capital efficiency, better execution
Regulatory and industry bodies
Engagement with regulators, standards boards, and industry associations ensures compliance and foresight on rule changes and helps shape emerging insurance and investment frameworks such as IFRS S2; IAIS has over 200 members. Knowledge sharing from these partnerships improves risk management practices and reduces regulatory friction, reinforcing reputation and stakeholder trust.
- Regulatory foresight — early access to rule changes
- Framework influence — IFRS S2, IAIS engagement
- Risk management — shared best practices
- Reputation — stronger stakeholder trust
Partnerships with pensions, private managers and reinsurers increase deal flow and cut fees
Key partnerships: pension/sovereign capital (~$60T in 2024) and top private managers (~$11T) expand deal flow and reduce fee drag ~1–2% via co-investments. Reinsurers (global premiums ~$324B in 2024) and syndication partners enhance capital efficiency and lower spreads. Research and regulators (IAIS 200+ members) provide macro foresight and compliance support for ALM.
| Partner | 2024 metric | Benefit |
|---|---|---|
| Pension/Sovereign | $60T AUM | Large deals, lower fees |
| Private managers | $11T private AUM | Sourcing, sector expertise |
| Reinsurers | $324B premiums | Risk transfer, capital |
| Regulators/IAIS | 200+ members | Foresight, compliance |
What is included in the product
Detailed Word Document
A comprehensive, pre-written Business Model Canvas for E-L Financial that maps the 9 BMC blocks with detailed customer segments, channels, value propositions and revenue/cost structures, reflecting real-world operations and strategic plans. Includes competitive-advantage analysis and linked SWOT insights ideal for presentations, investor discussions and decision-making by entrepreneurs and analysts.
Customizable Excel Spreadsheet
Condenses E-L Financial’s strategy into a digestible, one-page Business Model Canvas with editable cells, saving hours of formatting while enabling quick comparisons, team collaboration, and board-ready presentations.
Activities
Portfolio allocation and rebalancing
Dynamic capital deployment across insurance, wealth, real assets, and resources targets risk-adjusted returns by shifting exposures to capture valuation spreads and macro cycles, guided by current policy conditions such as the 2024 federal funds rate at 5.25–5.50%. Strategic tilts overweight assets showing favorable spreads while underweighting overbought segments. Disciplined rebalancing enforces target risk bands and liquidity buffers. Governance sets thresholds and pacing for shifts.
M&A and minority acquisitions
Sourcing, diligencing, and structuring control and minority stakes are core activities, prioritizing durable cash generators with defensible moats and predictable free cash flow.
Integration planning emphasizes preserving management talent and capturing revenue and cost synergies while respecting minority protections and governance rights.
Post-close oversight tracks KPIs, covenant compliance, and risk metrics through regular reporting and board or observer engagement to protect value.
Active ownership and governance
Active ownership combines board participation, incentive design, and capital-allocation oversight to drive value creation through targeted governance interventions. Operating reviews monitor revenue growth, margin trajectories, and capital intensity to ensure performance targets are met. Risk frameworks tie policies to solvency and liquidity requirements, with metrics reviewed regularly. Remediation plans trigger rapid corrective actions for underperformance.
ALM and risk management
ALM aligns cashflows to protect solvency and earnings stability; global banks reported median CET1 about 14% in 2024, giving capital buffer. Active hedging reduces rate, credit, equity and FX exposures while the Fed funds target range in 2024 (5.25–5.50%) raises interest-rate risk. Scenario testing and stress analysis set required buffers and risk appetite drives position sizing and leverage.
- Asset-liability matching: solvency protection
- Hedging: rates/credit/equity/FX
- Stress tests: buffer calibration
- Risk appetite: sizing & leverage
Investor reporting and compliance
Timely, transparent disclosure builds credibility and trust; EU CSRD began phased reporting in 2024 for companies with more than 500 employees, increasing ESG disclosure expectations. Regulatory filings, audit coordination and ESG reporting are maintained to meet evolving standards. Regular performance attribution—typically monthly or quarterly—clarifies sources of return and risk. Stakeholder communications align expectations across investors, boards and regulators.
- Timeliness: monthly/quarterly reports
- Compliance: EU CSRD 2024 (>500 employees)
- Audit: coordinated external audits
- Attribution: source-level returns
- Stakeholders: aligned expectations
Capital deployment across insurance, wealth & real assets — Fed 5.25–5.50%, CET1 ~14%
E-L Financial focuses on dynamic capital deployment across insurance, wealth, real assets and resources, guided by Fed funds 2024 at 5.25–5.50% and global bank median CET1 ~14% in 2024. Core activities: sourcing & structuring cash-generating businesses, active ownership to drive synergies, ALM/hedging and disciplined reporting under EU CSRD 2024 (>500 employees).
| Activity | 2024 Metric |
|---|---|
| Rates | Fed 5.25–5.50% |
| Capital | CET1 ~14% |
| Reporting | CSRD phased 2024 |
Full Version Awaits
Business Model Canvas
The E-L Financial Business Model Canvas you’re previewing is the actual deliverable, not a mockup. When you purchase, you’ll receive this exact file with all content and pages included. The document is ready-to-edit and formatted for immediate use in Word and Excel. No surprises—what you see is what you’ll get.
Description
Editable Business Model Canvas: Strategic Blueprint for Investors and Strategists
Unlock the full strategic blueprint behind E-L Financial with our complete Business Model Canvas. This in-depth, editable Canvas maps value propositions, key partners, revenue streams and cost structure across all nine blocks. Ideal for investors and strategists—download the Word/Excel file to apply insights and accelerate your analysis.
Partnerships
Institutional co-investors
Partnering with pension funds and sovereigns—which held over $60 trillion combined in 2024—enables access to larger transactions and improved terms. Co-investment structures typically lower fee drag by ~1–2% annually and align multi-decade horizons. These relationships expand deal flow across insurance, wealth management, real assets and resources, while sharing risk and bringing diversified sector expertise.
Asset managers and GPs
Relationships with top-tier private equity, private credit, real estate and natural resources managers provide sector-specific sourcing and operating know-how, leveraging that private capital AUM exceeded $11 trillion as of 2024 (Preqin). They enable flexible allocations across cycles and negotiating fee structures for scale—top managers often secure fee breaks as AUM rises. Ongoing manager due diligence strengthens governance and enhances return dispersion control.
Life insurers and reinsurers
Strategic alliances with reinsurers enhance E-L Financial's capital efficiency and risk transfer for life portfolios, reflecting a reinsurance market that posted roughly $324 billion in global premiums in 2024 (Swiss Re Institute). Product partnerships accelerate innovation and speed to market, while joint underwriting insights improve pricing and reserving discipline. These relationships also diversify mortality, lapse and longevity exposures across cohorts and geographies.
Banks and capital markets firms
Treasury, underwriting and syndication partners reduce financing costs and boost liquidity, often cutting spreads by tens of basis points and enabling larger placements for ALM. Research access supplies macro and sector views that inform positioning amid 2024 policy rates near 5.25%. Structured solutions and trading relationships optimize regulatory capital and execution across public markets.
- Funding: lower spreads, improved liquidity
- Research: macro/sector signals for duration and credit
- Solutions: ALM optimization, capital efficiency, better execution
Regulatory and industry bodies
Engagement with regulators, standards boards, and industry associations ensures compliance and foresight on rule changes and helps shape emerging insurance and investment frameworks such as IFRS S2; IAIS has over 200 members. Knowledge sharing from these partnerships improves risk management practices and reduces regulatory friction, reinforcing reputation and stakeholder trust.
- Regulatory foresight — early access to rule changes
- Framework influence — IFRS S2, IAIS engagement
- Risk management — shared best practices
- Reputation — stronger stakeholder trust
Partnerships with pensions, private managers and reinsurers increase deal flow and cut fees
Key partnerships: pension/sovereign capital (~$60T in 2024) and top private managers (~$11T) expand deal flow and reduce fee drag ~1–2% via co-investments. Reinsurers (global premiums ~$324B in 2024) and syndication partners enhance capital efficiency and lower spreads. Research and regulators (IAIS 200+ members) provide macro foresight and compliance support for ALM.
| Partner | 2024 metric | Benefit |
|---|---|---|
| Pension/Sovereign | $60T AUM | Large deals, lower fees |
| Private managers | $11T private AUM | Sourcing, sector expertise |
| Reinsurers | $324B premiums | Risk transfer, capital |
| Regulators/IAIS | 200+ members | Foresight, compliance |
What is included in the product
Detailed Word Document
A comprehensive, pre-written Business Model Canvas for E-L Financial that maps the 9 BMC blocks with detailed customer segments, channels, value propositions and revenue/cost structures, reflecting real-world operations and strategic plans. Includes competitive-advantage analysis and linked SWOT insights ideal for presentations, investor discussions and decision-making by entrepreneurs and analysts.
Customizable Excel Spreadsheet
Condenses E-L Financial’s strategy into a digestible, one-page Business Model Canvas with editable cells, saving hours of formatting while enabling quick comparisons, team collaboration, and board-ready presentations.
Activities
Portfolio allocation and rebalancing
Dynamic capital deployment across insurance, wealth, real assets, and resources targets risk-adjusted returns by shifting exposures to capture valuation spreads and macro cycles, guided by current policy conditions such as the 2024 federal funds rate at 5.25–5.50%. Strategic tilts overweight assets showing favorable spreads while underweighting overbought segments. Disciplined rebalancing enforces target risk bands and liquidity buffers. Governance sets thresholds and pacing for shifts.
M&A and minority acquisitions
Sourcing, diligencing, and structuring control and minority stakes are core activities, prioritizing durable cash generators with defensible moats and predictable free cash flow.
Integration planning emphasizes preserving management talent and capturing revenue and cost synergies while respecting minority protections and governance rights.
Post-close oversight tracks KPIs, covenant compliance, and risk metrics through regular reporting and board or observer engagement to protect value.
Active ownership and governance
Active ownership combines board participation, incentive design, and capital-allocation oversight to drive value creation through targeted governance interventions. Operating reviews monitor revenue growth, margin trajectories, and capital intensity to ensure performance targets are met. Risk frameworks tie policies to solvency and liquidity requirements, with metrics reviewed regularly. Remediation plans trigger rapid corrective actions for underperformance.
ALM and risk management
ALM aligns cashflows to protect solvency and earnings stability; global banks reported median CET1 about 14% in 2024, giving capital buffer. Active hedging reduces rate, credit, equity and FX exposures while the Fed funds target range in 2024 (5.25–5.50%) raises interest-rate risk. Scenario testing and stress analysis set required buffers and risk appetite drives position sizing and leverage.
- Asset-liability matching: solvency protection
- Hedging: rates/credit/equity/FX
- Stress tests: buffer calibration
- Risk appetite: sizing & leverage
Investor reporting and compliance
Timely, transparent disclosure builds credibility and trust; EU CSRD began phased reporting in 2024 for companies with more than 500 employees, increasing ESG disclosure expectations. Regulatory filings, audit coordination and ESG reporting are maintained to meet evolving standards. Regular performance attribution—typically monthly or quarterly—clarifies sources of return and risk. Stakeholder communications align expectations across investors, boards and regulators.
- Timeliness: monthly/quarterly reports
- Compliance: EU CSRD 2024 (>500 employees)
- Audit: coordinated external audits
- Attribution: source-level returns
- Stakeholders: aligned expectations
Capital deployment across insurance, wealth & real assets — Fed 5.25–5.50%, CET1 ~14%
E-L Financial focuses on dynamic capital deployment across insurance, wealth, real assets and resources, guided by Fed funds 2024 at 5.25–5.50% and global bank median CET1 ~14% in 2024. Core activities: sourcing & structuring cash-generating businesses, active ownership to drive synergies, ALM/hedging and disciplined reporting under EU CSRD 2024 (>500 employees).
| Activity | 2024 Metric |
|---|---|
| Rates | Fed 5.25–5.50% |
| Capital | CET1 ~14% |
| Reporting | CSRD phased 2024 |
Full Version Awaits
Business Model Canvas
The E-L Financial Business Model Canvas you’re previewing is the actual deliverable, not a mockup. When you purchase, you’ll receive this exact file with all content and pages included. The document is ready-to-edit and formatted for immediate use in Word and Excel. No surprises—what you see is what you’ll get.











