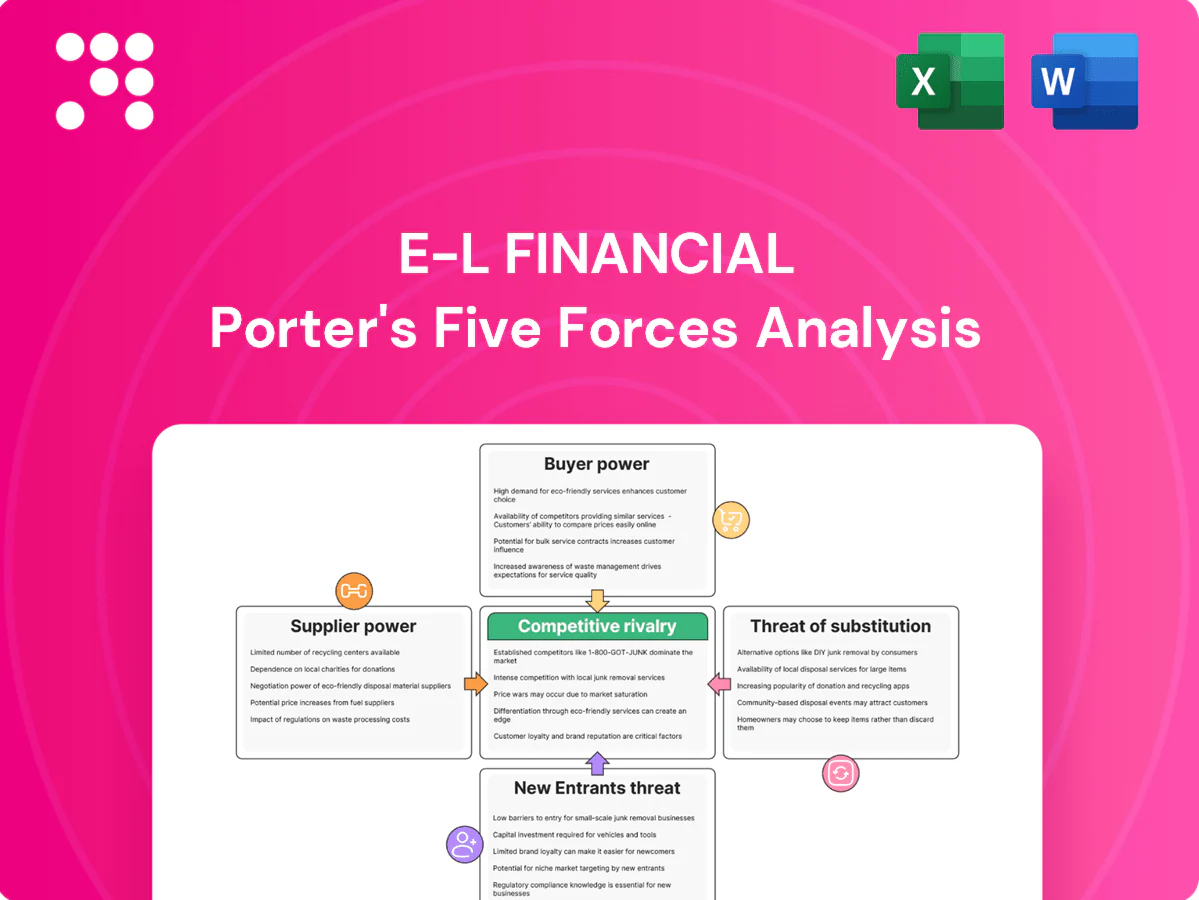
E-L Financial Porter's Five Forces Analysis

From Overview to Strategy Blueprint
E-L Financial’s Porter's Five Forces snapshot highlights its low supplier risk, moderate buyer power, limited threat of substitutes, steady barriers to entry, and rivalry shaped by portfolio diversification and capital allocation strategy. This brief overview hints at strategic nuances and market pressures worth exploring further. Unlock the full Porter’s Five Forces Analysis for detailed ratings, visuals, and actionable investment insights.
Suppliers Bargaining Power

Concentrated reinsurance partners
Life insurers like E-L depend on a narrow set of global reinsurers, which concentrated supply gives reinsurers notable pricing power and the ability to tighten terms; 2024 saw double-digit reinsurance rate increases in many casualty and catastrophe lines as markets hardened. Cyclical catastrophe losses and capital cycles continued to squeeze capacity, increasing counterparty risk. E-L must diversify treaties and monitor capital exposures to mitigate supplier leverage and secure capital relief.
Dependence on distribution intermediaries
Financial advisors, brokers and MGAs control access to end clients, accounting for over 50% of retail distribution in many markets in 2024, allowing top producers to demand higher commissions, marketing support and bespoke product features. Channel conflict and platform placement materially affect sales velocity and shelf space, with strongest intermediaries capturing disproportionate flows. E-L must pursue multi-channel strategies and direct-digital distribution to reduce dependency and protect margins.

Specialized tech and data vendors
Specialized core admin systems, actuarial platforms, cloud providers (AWS ~32% share in 2024) and premium data feeds create high switching costs; insurers report core replacements often run into tens of millions and multi-year timelines. Vendor lock-in and integration complexity raise TCO while pricing escalators and compliance add to opex. Strategic vendor management and modular, API-first architectures help regain bargaining balance.

Talent and advisory expertise
- Scarcity: high demand for actuaries and risk experts
- Cost: 2024 wage inflation ~5–6%
- Consultants: shape practices and timelines
- Mitigation: build pipelines and stronger employer brand
Capital market conditions
- Market rates: US 10y ~4.5% (2024)
- IG spreads: ~100–150bps (2024)
- Bank CET1: ~13% avg (2024)
Reinsurance shock, >50% broker reliance, cloud concentration (~32%) and rising costs
E-L faces concentrated reinsurers (double-digit reinsurance rate increases in 2024), heavy broker/MGA reliance (>50% retail distribution), vendor lock-in (core replacements costly; AWS ~32% share in 2024) and talent wage inflation ~5–6% (2024); funding costs rose (US 10y ~4.5%, IG spreads ~100–150bps), forcing diversification and direct-digital push.
| Metric | 2024 |
|---|---|
| Reinsurance rates | Double-digit |
| Broker share | >50% |
| AWS market share | ~32% |
| Wage inflation | 5–6% |
| US 10y | ~4.5% |
| IG spreads | 100–150bps |
What is included in the product
 Detailed Word Document
Uncovers competitive drivers—buyer and supplier power, threat of new entrants and substitutes, and industry rivalry—tailored to E-L Financial’s asset-light investment model, highlighting regulatory, capital and distribution barriers and strategic levers to protect margins and market share.

 Customizable Excel Spreadsheet
One-sheet Porter's Five Forces tailored to E-L Financial — quickly spot competitive pressures and opportunities. Clean layout, adjustable inputs and a ready-to-use radar chart make it ideal for fast boardroom decisions or investor decks.
Customers Bargaining Power

Informed, rate-sensitive policyholders
Consumers increasingly shop digitally: a 2024 Accenture survey found about 65% compare premiums, returns and riders online, intensifying price transparency. Low switching costs for term life and investment products amplify price pressure, compressing margins. Brand trust still drives purchases of permanent life and annuities, where advisors and reputation matter. Clear, transparent value propositions are essential to retain price-sensitive segments.
Institutional and HNW negotiating leverage
Large institutional and HNW clients routinely extract fee breaks of 10–25% and bespoke terms, forcing E-L Financial to trade margin for scale; mandate portability raises churn risk by ~15–20% for asset-management sleeves. Elevated service-level expectations (dedicated teams, bespoke reporting) push operating costs up roughly 10–20%. Tiered pricing and customized reporting have proven to recover 5–10% in retention and lifetime value, balancing economics and client stickiness.

Channel gatekeepers as proxies
Brokers and advisors act as channel gatekeepers, indirectly amplifying buyer power by steering product selection; in 2024 advisors accounted for roughly 70% of U.S. retail mutual fund flows. Shelf space and recommendations commonly depend on compensation and service levels, making pay and support key leverage points. Negative client experiences can reallocate flows rapidly, while competitive wholesaling and advisor enablement preserve placement and mitigate churn.

Digital-first expectations
Clients demand seamless onboarding, self-service and rapid underwriting; Salesforce 2024 reports 76% of customers expect effortless digital experiences. Poor UX drives abandonment and shopping behavior, letting competitors with slick journeys win on experience over price. Continuous digital improvement measurably reduces defections and acquisition costs.
- Seamless onboarding: priority
- Poor UX = higher abandonment
- Experience can trump price
- Continuous digital upgrades cut churn
Sensitivity to performance and transparency
Wealth clients closely scrutinize net returns, fees and drawdown risk; industry data show global ETF/ETP assets topped roughly 11 trillion USD by 2024, highlighting a large low-cost alternative that accelerates flows after underperformance. Clear, timely reporting and transparent risk communication reduce knee-jerk exits, while outcome-aligned fee models (performance fees, clawbacks) blunt pure price competition and temper buyer power.
- Clients: net returns, fees, drawdowns
- Market signal: >11T USD ETFs/ETPs (2024)
- Mitigant: clear reporting + risk comms
- Fee alignment: performance-linked pricing
Buyers wield pricing power: 65% compare premiums, 70% advisor flows, UX heightens switch risk
Buyers exercise strong leverage: 65% compare premiums online (Accenture 2024), advisors drive ~70% of retail flows, and HNW/institutional clients extract 10–25% fee breaks. Digital UX expectations (76% expect effortless experiences, Salesforce 2024) and >11T USD in ETFs (2024) amplify price sensitivity and switching risk.
| Metric | 2024 Value |
|---|---|
| Online comparison | 65% |
| Advisor-driven flows | 70% |
| Fee breaks (HNW) | 10–25% |
| UX expectation | 76% |
| ETF/ETP AUM | >11T USD |
Same Document Delivered
E-L Financial Porter's Five Forces Analysis
This preview shows the exact E-L Financial Porter's Five Forces Analysis you'll receive immediately after purchase—no placeholders or samples. The file is fully formatted and ready to use, offering clear evaluation of competitive rivalry, supplier and buyer power, threat of substitutes, and barriers to entry. Once bought, you get instant access to this identical, professionally written document.

From Overview to Strategy Blueprint
E-L Financial’s Porter's Five Forces snapshot highlights its low supplier risk, moderate buyer power, limited threat of substitutes, steady barriers to entry, and rivalry shaped by portfolio diversification and capital allocation strategy. This brief overview hints at strategic nuances and market pressures worth exploring further. Unlock the full Porter’s Five Forces Analysis for detailed ratings, visuals, and actionable investment insights.
Suppliers Bargaining Power
Concentrated reinsurance partners
Life insurers like E-L depend on a narrow set of global reinsurers, which concentrated supply gives reinsurers notable pricing power and the ability to tighten terms; 2024 saw double-digit reinsurance rate increases in many casualty and catastrophe lines as markets hardened. Cyclical catastrophe losses and capital cycles continued to squeeze capacity, increasing counterparty risk. E-L must diversify treaties and monitor capital exposures to mitigate supplier leverage and secure capital relief.
Dependence on distribution intermediaries
Financial advisors, brokers and MGAs control access to end clients, accounting for over 50% of retail distribution in many markets in 2024, allowing top producers to demand higher commissions, marketing support and bespoke product features. Channel conflict and platform placement materially affect sales velocity and shelf space, with strongest intermediaries capturing disproportionate flows. E-L must pursue multi-channel strategies and direct-digital distribution to reduce dependency and protect margins.
Specialized tech and data vendors
Specialized core admin systems, actuarial platforms, cloud providers (AWS ~32% share in 2024) and premium data feeds create high switching costs; insurers report core replacements often run into tens of millions and multi-year timelines. Vendor lock-in and integration complexity raise TCO while pricing escalators and compliance add to opex. Strategic vendor management and modular, API-first architectures help regain bargaining balance.
Talent and advisory expertise
- Scarcity: high demand for actuaries and risk experts
- Cost: 2024 wage inflation ~5–6%
- Consultants: shape practices and timelines
- Mitigation: build pipelines and stronger employer brand
Capital market conditions
- Market rates: US 10y ~4.5% (2024)
- IG spreads: ~100–150bps (2024)
- Bank CET1: ~13% avg (2024)
Reinsurance shock, >50% broker reliance, cloud concentration (~32%) and rising costs
E-L faces concentrated reinsurers (double-digit reinsurance rate increases in 2024), heavy broker/MGA reliance (>50% retail distribution), vendor lock-in (core replacements costly; AWS ~32% share in 2024) and talent wage inflation ~5–6% (2024); funding costs rose (US 10y ~4.5%, IG spreads ~100–150bps), forcing diversification and direct-digital push.
| Metric | 2024 |
|---|---|
| Reinsurance rates | Double-digit |
| Broker share | >50% |
| AWS market share | ~32% |
| Wage inflation | 5–6% |
| US 10y | ~4.5% |
| IG spreads | 100–150bps |
What is included in the product
Detailed Word Document
Uncovers competitive drivers—buyer and supplier power, threat of new entrants and substitutes, and industry rivalry—tailored to E-L Financial’s asset-light investment model, highlighting regulatory, capital and distribution barriers and strategic levers to protect margins and market share.
Customizable Excel Spreadsheet
One-sheet Porter's Five Forces tailored to E-L Financial — quickly spot competitive pressures and opportunities. Clean layout, adjustable inputs and a ready-to-use radar chart make it ideal for fast boardroom decisions or investor decks.
Customers Bargaining Power
Informed, rate-sensitive policyholders
Consumers increasingly shop digitally: a 2024 Accenture survey found about 65% compare premiums, returns and riders online, intensifying price transparency. Low switching costs for term life and investment products amplify price pressure, compressing margins. Brand trust still drives purchases of permanent life and annuities, where advisors and reputation matter. Clear, transparent value propositions are essential to retain price-sensitive segments.
Institutional and HNW negotiating leverage
Large institutional and HNW clients routinely extract fee breaks of 10–25% and bespoke terms, forcing E-L Financial to trade margin for scale; mandate portability raises churn risk by ~15–20% for asset-management sleeves. Elevated service-level expectations (dedicated teams, bespoke reporting) push operating costs up roughly 10–20%. Tiered pricing and customized reporting have proven to recover 5–10% in retention and lifetime value, balancing economics and client stickiness.
Channel gatekeepers as proxies
Brokers and advisors act as channel gatekeepers, indirectly amplifying buyer power by steering product selection; in 2024 advisors accounted for roughly 70% of U.S. retail mutual fund flows. Shelf space and recommendations commonly depend on compensation and service levels, making pay and support key leverage points. Negative client experiences can reallocate flows rapidly, while competitive wholesaling and advisor enablement preserve placement and mitigate churn.
Digital-first expectations
Clients demand seamless onboarding, self-service and rapid underwriting; Salesforce 2024 reports 76% of customers expect effortless digital experiences. Poor UX drives abandonment and shopping behavior, letting competitors with slick journeys win on experience over price. Continuous digital improvement measurably reduces defections and acquisition costs.
- Seamless onboarding: priority
- Poor UX = higher abandonment
- Experience can trump price
- Continuous digital upgrades cut churn
Sensitivity to performance and transparency
Wealth clients closely scrutinize net returns, fees and drawdown risk; industry data show global ETF/ETP assets topped roughly 11 trillion USD by 2024, highlighting a large low-cost alternative that accelerates flows after underperformance. Clear, timely reporting and transparent risk communication reduce knee-jerk exits, while outcome-aligned fee models (performance fees, clawbacks) blunt pure price competition and temper buyer power.
- Clients: net returns, fees, drawdowns
- Market signal: >11T USD ETFs/ETPs (2024)
- Mitigant: clear reporting + risk comms
- Fee alignment: performance-linked pricing
Buyers wield pricing power: 65% compare premiums, 70% advisor flows, UX heightens switch risk
Buyers exercise strong leverage: 65% compare premiums online (Accenture 2024), advisors drive ~70% of retail flows, and HNW/institutional clients extract 10–25% fee breaks. Digital UX expectations (76% expect effortless experiences, Salesforce 2024) and >11T USD in ETFs (2024) amplify price sensitivity and switching risk.
| Metric | 2024 Value |
|---|---|
| Online comparison | 65% |
| Advisor-driven flows | 70% |
| Fee breaks (HNW) | 10–25% |
| UX expectation | 76% |
| ETF/ETP AUM | >11T USD |
Same Document Delivered
E-L Financial Porter's Five Forces Analysis
This preview shows the exact E-L Financial Porter's Five Forces Analysis you'll receive immediately after purchase—no placeholders or samples. The file is fully formatted and ready to use, offering clear evaluation of competitive rivalry, supplier and buyer power, threat of substitutes, and barriers to entry. Once bought, you get instant access to this identical, professionally written document.
Original: $10.00
-65%$10.00
$3.50Description
From Overview to Strategy Blueprint
E-L Financial’s Porter's Five Forces snapshot highlights its low supplier risk, moderate buyer power, limited threat of substitutes, steady barriers to entry, and rivalry shaped by portfolio diversification and capital allocation strategy. This brief overview hints at strategic nuances and market pressures worth exploring further. Unlock the full Porter’s Five Forces Analysis for detailed ratings, visuals, and actionable investment insights.
Suppliers Bargaining Power
Concentrated reinsurance partners
Life insurers like E-L depend on a narrow set of global reinsurers, which concentrated supply gives reinsurers notable pricing power and the ability to tighten terms; 2024 saw double-digit reinsurance rate increases in many casualty and catastrophe lines as markets hardened. Cyclical catastrophe losses and capital cycles continued to squeeze capacity, increasing counterparty risk. E-L must diversify treaties and monitor capital exposures to mitigate supplier leverage and secure capital relief.
Dependence on distribution intermediaries
Financial advisors, brokers and MGAs control access to end clients, accounting for over 50% of retail distribution in many markets in 2024, allowing top producers to demand higher commissions, marketing support and bespoke product features. Channel conflict and platform placement materially affect sales velocity and shelf space, with strongest intermediaries capturing disproportionate flows. E-L must pursue multi-channel strategies and direct-digital distribution to reduce dependency and protect margins.
Specialized tech and data vendors
Specialized core admin systems, actuarial platforms, cloud providers (AWS ~32% share in 2024) and premium data feeds create high switching costs; insurers report core replacements often run into tens of millions and multi-year timelines. Vendor lock-in and integration complexity raise TCO while pricing escalators and compliance add to opex. Strategic vendor management and modular, API-first architectures help regain bargaining balance.
Talent and advisory expertise
- Scarcity: high demand for actuaries and risk experts
- Cost: 2024 wage inflation ~5–6%
- Consultants: shape practices and timelines
- Mitigation: build pipelines and stronger employer brand
Capital market conditions
- Market rates: US 10y ~4.5% (2024)
- IG spreads: ~100–150bps (2024)
- Bank CET1: ~13% avg (2024)
Reinsurance shock, >50% broker reliance, cloud concentration (~32%) and rising costs
E-L faces concentrated reinsurers (double-digit reinsurance rate increases in 2024), heavy broker/MGA reliance (>50% retail distribution), vendor lock-in (core replacements costly; AWS ~32% share in 2024) and talent wage inflation ~5–6% (2024); funding costs rose (US 10y ~4.5%, IG spreads ~100–150bps), forcing diversification and direct-digital push.
| Metric | 2024 |
|---|---|
| Reinsurance rates | Double-digit |
| Broker share | >50% |
| AWS market share | ~32% |
| Wage inflation | 5–6% |
| US 10y | ~4.5% |
| IG spreads | 100–150bps |
What is included in the product
Detailed Word Document
Uncovers competitive drivers—buyer and supplier power, threat of new entrants and substitutes, and industry rivalry—tailored to E-L Financial’s asset-light investment model, highlighting regulatory, capital and distribution barriers and strategic levers to protect margins and market share.
Customizable Excel Spreadsheet
One-sheet Porter's Five Forces tailored to E-L Financial — quickly spot competitive pressures and opportunities. Clean layout, adjustable inputs and a ready-to-use radar chart make it ideal for fast boardroom decisions or investor decks.
Customers Bargaining Power
Informed, rate-sensitive policyholders
Consumers increasingly shop digitally: a 2024 Accenture survey found about 65% compare premiums, returns and riders online, intensifying price transparency. Low switching costs for term life and investment products amplify price pressure, compressing margins. Brand trust still drives purchases of permanent life and annuities, where advisors and reputation matter. Clear, transparent value propositions are essential to retain price-sensitive segments.
Institutional and HNW negotiating leverage
Large institutional and HNW clients routinely extract fee breaks of 10–25% and bespoke terms, forcing E-L Financial to trade margin for scale; mandate portability raises churn risk by ~15–20% for asset-management sleeves. Elevated service-level expectations (dedicated teams, bespoke reporting) push operating costs up roughly 10–20%. Tiered pricing and customized reporting have proven to recover 5–10% in retention and lifetime value, balancing economics and client stickiness.
Channel gatekeepers as proxies
Brokers and advisors act as channel gatekeepers, indirectly amplifying buyer power by steering product selection; in 2024 advisors accounted for roughly 70% of U.S. retail mutual fund flows. Shelf space and recommendations commonly depend on compensation and service levels, making pay and support key leverage points. Negative client experiences can reallocate flows rapidly, while competitive wholesaling and advisor enablement preserve placement and mitigate churn.
Digital-first expectations
Clients demand seamless onboarding, self-service and rapid underwriting; Salesforce 2024 reports 76% of customers expect effortless digital experiences. Poor UX drives abandonment and shopping behavior, letting competitors with slick journeys win on experience over price. Continuous digital improvement measurably reduces defections and acquisition costs.
- Seamless onboarding: priority
- Poor UX = higher abandonment
- Experience can trump price
- Continuous digital upgrades cut churn
Sensitivity to performance and transparency
Wealth clients closely scrutinize net returns, fees and drawdown risk; industry data show global ETF/ETP assets topped roughly 11 trillion USD by 2024, highlighting a large low-cost alternative that accelerates flows after underperformance. Clear, timely reporting and transparent risk communication reduce knee-jerk exits, while outcome-aligned fee models (performance fees, clawbacks) blunt pure price competition and temper buyer power.
- Clients: net returns, fees, drawdowns
- Market signal: >11T USD ETFs/ETPs (2024)
- Mitigant: clear reporting + risk comms
- Fee alignment: performance-linked pricing
Buyers wield pricing power: 65% compare premiums, 70% advisor flows, UX heightens switch risk
Buyers exercise strong leverage: 65% compare premiums online (Accenture 2024), advisors drive ~70% of retail flows, and HNW/institutional clients extract 10–25% fee breaks. Digital UX expectations (76% expect effortless experiences, Salesforce 2024) and >11T USD in ETFs (2024) amplify price sensitivity and switching risk.
| Metric | 2024 Value |
|---|---|
| Online comparison | 65% |
| Advisor-driven flows | 70% |
| Fee breaks (HNW) | 10–25% |
| UX expectation | 76% |
| ETF/ETP AUM | >11T USD |
Same Document Delivered
E-L Financial Porter's Five Forces Analysis
This preview shows the exact E-L Financial Porter's Five Forces Analysis you'll receive immediately after purchase—no placeholders or samples. The file is fully formatted and ready to use, offering clear evaluation of competitive rivalry, supplier and buyer power, threat of substitutes, and barriers to entry. Once bought, you get instant access to this identical, professionally written document.











