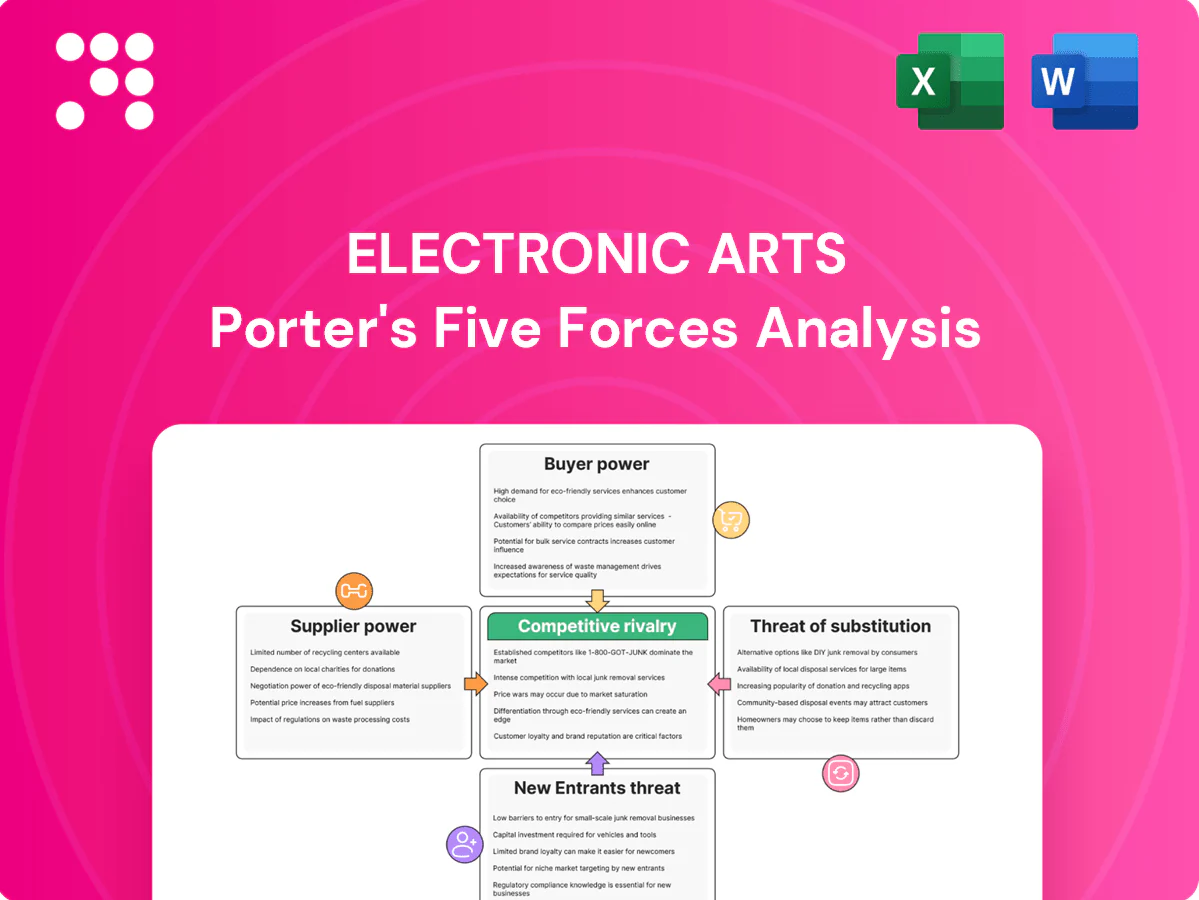
Electronic Arts Porter's Five Forces Analysis

Go Beyond the Preview—Access the Full Strategic Report
Electronic Arts faces intense competitive rivalry and pressure from free-to-play substitutes, while strong IP, scale, and platform relationships limit new entrants; buyer power rises with digital distribution and live-service expectations, and supplier leverage is moderate. This brief snapshot only scratches the surface. Unlock the full Porter's Five Forces Analysis to explore EA’s competitive dynamics and strategic risks in detail.
Suppliers Bargaining Power

Platform gatekeepers (Sony, Microsoft, Nintendo, Apple, Google)
Access to consoles, mobile app stores and PC storefronts gives platform gatekeepers leverage via fees, promotion slots and certification timelines; 30% remains the industry norm while Apple/Google and console owners offer 15%–30% tiering or negotiated cuts for large partners. These revenue shares materially compress margins on full games and live services and platform policy or feature changes (certification, cross‑play rules, SDK access) can force roadmap and monetization shifts. Platform concentration (Sony, Microsoft, Nintendo, Apple, Google) keeps supplier power high despite EA’s scale.
Licensing partners and sports leagues (NFL, NHL, UFC, players’ unions)
Exclusive and semi-exclusive licenses underpin EA’s flagship sports franchises and drive a material share of revenue, with EA reporting roughly $7.5 billion in FY2024, much of it from live services and major sports titles. Rights holders can raise fees, mandate content standards, or restrict data and likeness use, squeezing margins and product scope. Contract renewals create step-up risks and brand transitions, as seen when EA lost the FIFA license in 2022–23 and launched EA Sports FC. Scarcity of unique IP gives these suppliers above-average bargaining power.

Technology and cloud providers (engine tech, online services, CDNs)
EA uses Frostbite but still depends on cloud, backend, anti-cheat, voice and analytics vendors; outages or pricing shifts from hyperscalers (AWS ~32%, Azure ~22%, Google Cloud ~11% global share in 2024) can squeeze live-service margins and player experience. Bespoke integrations increase vendor lock-in as services scale. EA’s scale and 500M+ players boost negotiating leverage, but supplier power remains material.

Talent and external development studios
Senior engineering, design and live-ops talent are scarce and globally contested; in 2024 US senior game-engineer median base pay ~150,000 USD, driving wage inflation, remote mobility and higher outsourcing rates (co-dev $40–150/hr). Staffing-linked delays can jeopardize seasonal sports cycles and DLC cadences; specialized co-dev and art studios can command premiums up to 50%.
- Talent scarcity: global competition, higher pay
- Cost impact: median senior pay ~150k USD (2024)
- Outsourcing: co-dev $40–150/hr; premiums up to 50%
- Operational risk: staffing delays hurt seasonal/DLC timing
Hardware, tools, and compliance vendors
Hardware dev kits, testing and anti-fraud tools, payment gateways and age-rating bodies materially shape EA release timing and costs; Apple and Google platform fees remain at 30% for many transactions (2024), affecting margins and monetization design.
Compliance for online safety, data privacy and regional rules increases reliance on niche providers and raises coordination costs across territories; payment processors and chargeback exposure (card fees ~1–3%) influence net take-rates.
- Dev kits: high upfront costs, platform-dependent
- Platform fee: 30% (App Store/Play, 2024)
- Card fees: ~1–3%
- Fragmentation: higher coordination and compliance spend
Platform fees (30%), cloud concentration and exclusive rights squeeze margins
Platform gatekeepers retain strong leverage (App Store/Play 30% typical, tiering 15–30% for big partners, 2024), compressing EA margins and forcing monetization changes. Exclusive sports rights drive revenue concentration (EA ~7.5 billion USD FY2024) and renewal risk. Hyperscaler outages/pricing (AWS ~32%, Azure ~22%, GCP ~11% 2024) plus scarce senior talent (median senior game-engineer pay ~150,000 USD 2024) keep supplier power high.
| Metric | Value (2024) |
|---|---|
| Platform fee | 30% |
| EA revenue | ~7.5 bn USD |
| Cloud share (AWS/Azure/GCP) | 32% / 22% / 11% |
| Senior game-engineer pay | ~150,000 USD |
| Card fees | ~1–3% |
What is included in the product
 Detailed Word Document
Tailored Porter’s Five Forces analysis for Electronic Arts revealing competitive intensity from major publishers and indie studios, buyer/supplier bargaining power, threat of substitutes and digital disruption, and entry barriers shaping profitability.

 Customizable Excel Spreadsheet
A concise one-sheet Porter's Five Forces analysis for Electronic Arts—ideal for quick strategic decisions; customize force levels, swap in your own data, and visualize competitive pressure with a ready-to-use spider chart for decks or Excel dashboards.
Customers Bargaining Power

Low switching costs for gamers across genres and platforms
Low switching costs let players move quickly to rival or free-to-play titles, and free-to-play models drove roughly 75% of global games revenue in 2023–24, increasing alternatives. Discoverability via storefronts and influencers amplifies churn if quality dips, while price promotions and seasonal events (used widely across live-service titles) are essential to retention. These dynamics keep buyer power moderate to high despite brand loyalty for EA.
Sensitivity to monetization practices and live-service value
Consumers punish perceived pay-to-win or aggressive loot systems, as seen after the 2017 Star Wars Battlefront II backlash; transparent progression, fair cosmetics, and regular content drops reduce churn and negative sentiment. Social sentiment can swiftly dent sales and DAU, and EA reported FY2024 net revenue of about $6.9 billion driven largely by live services. EA must balance ARPU with community trust to limit buyer leverage.

Subscription bundling (EA Play, Game Pass, PS Plus)
Platform bundles like EA Play inside Game Pass (~30M subs in 2024) and PS Plus (~60M in 2024) give players low marginal access to large catalogs, anchoring lower price expectations; platform aggregators gain bargaining leverage as inclusion trades higher upfront fees for longer engagement tails, while buyer optionality compresses willingness to pay for premium standalone titles.

Regional price expectations and alternative entertainment
Emerging-market pricing, frequent promos and free-to-play norms (mobile >50% of industry revenue in 2024, top-grossing mobile largely F2P) raise price elasticity for EA titles; competing time sinks like streaming, social and UGC let players opt out of paid ecosystems. Local payment methods and clear refund policies materially affect conversion rates, while broad buyer choice strengthens customer negotiating power.
- Emerging-market price sensitivity
- F2P/promos increase elasticity
- Streaming/UGC as alternative time sinks
- Payments/refunds drive conversion
Community influence via creators and esports
Streamers and competitive players rapidly shape meta and sentiment for EA titles, with top broadcasts reaching millions and spikes on Twitch/YouTube often correlating with in-game engagement; negative creator sentiment has precipitated visible drops in concurrency and spend for live-service games. Positive alignment with creators boosts adoption efficiently, while community amplification turns individual preferences into collective bargaining power.
- Creator reach: millions per stream
- Sentiment → concurrency/spend impact
- Positive creator alignment = faster adoption
- Collective amplification increases buyer power
F2P ≈75% dominance and platform bundles boost buyer leverage; mobile >50%
Low switching costs and F2P dominance (≈75% of global games revenue 2023–24) raise buyer leverage; EA FY2024 revenue ≈$6.9B driven by live services. Platform bundles (Game Pass ~30M, PS Plus ~60M in 2024) compress price expectations. Creator reach and refunds/payment options amplify customer power, increasing elasticity, especially in mobile (>50% industry revenue 2024).
| Metric | Value |
|---|---|
| F2P share | ≈75% (2023–24) |
| EA FY2024 rev | ≈$6.9B |
| Game Pass subs | ~30M (2024) |
| PS Plus | ~60M (2024) |
| Mobile revenue | >50% (2024) |
Preview the Actual Deliverable
Electronic Arts Porter's Five Forces Analysis
This preview shows the exact Porter's Five Forces analysis of Electronic Arts you'll receive—no surprises or placeholders. The assessment covers competitive rivalry, supplier and buyer power, and the threats of new entrants and substitutes, with clear strategic implications. Upon purchase you'll get this same professionally formatted file instantly, ready for download and use.

Go Beyond the Preview—Access the Full Strategic Report
Electronic Arts faces intense competitive rivalry and pressure from free-to-play substitutes, while strong IP, scale, and platform relationships limit new entrants; buyer power rises with digital distribution and live-service expectations, and supplier leverage is moderate. This brief snapshot only scratches the surface. Unlock the full Porter's Five Forces Analysis to explore EA’s competitive dynamics and strategic risks in detail.
Suppliers Bargaining Power
Platform gatekeepers (Sony, Microsoft, Nintendo, Apple, Google)
Access to consoles, mobile app stores and PC storefronts gives platform gatekeepers leverage via fees, promotion slots and certification timelines; 30% remains the industry norm while Apple/Google and console owners offer 15%–30% tiering or negotiated cuts for large partners. These revenue shares materially compress margins on full games and live services and platform policy or feature changes (certification, cross‑play rules, SDK access) can force roadmap and monetization shifts. Platform concentration (Sony, Microsoft, Nintendo, Apple, Google) keeps supplier power high despite EA’s scale.
Licensing partners and sports leagues (NFL, NHL, UFC, players’ unions)
Exclusive and semi-exclusive licenses underpin EA’s flagship sports franchises and drive a material share of revenue, with EA reporting roughly $7.5 billion in FY2024, much of it from live services and major sports titles. Rights holders can raise fees, mandate content standards, or restrict data and likeness use, squeezing margins and product scope. Contract renewals create step-up risks and brand transitions, as seen when EA lost the FIFA license in 2022–23 and launched EA Sports FC. Scarcity of unique IP gives these suppliers above-average bargaining power.
Technology and cloud providers (engine tech, online services, CDNs)
EA uses Frostbite but still depends on cloud, backend, anti-cheat, voice and analytics vendors; outages or pricing shifts from hyperscalers (AWS ~32%, Azure ~22%, Google Cloud ~11% global share in 2024) can squeeze live-service margins and player experience. Bespoke integrations increase vendor lock-in as services scale. EA’s scale and 500M+ players boost negotiating leverage, but supplier power remains material.
Talent and external development studios
Senior engineering, design and live-ops talent are scarce and globally contested; in 2024 US senior game-engineer median base pay ~150,000 USD, driving wage inflation, remote mobility and higher outsourcing rates (co-dev $40–150/hr). Staffing-linked delays can jeopardize seasonal sports cycles and DLC cadences; specialized co-dev and art studios can command premiums up to 50%.
- Talent scarcity: global competition, higher pay
- Cost impact: median senior pay ~150k USD (2024)
- Outsourcing: co-dev $40–150/hr; premiums up to 50%
- Operational risk: staffing delays hurt seasonal/DLC timing
Hardware, tools, and compliance vendors
Hardware dev kits, testing and anti-fraud tools, payment gateways and age-rating bodies materially shape EA release timing and costs; Apple and Google platform fees remain at 30% for many transactions (2024), affecting margins and monetization design.
Compliance for online safety, data privacy and regional rules increases reliance on niche providers and raises coordination costs across territories; payment processors and chargeback exposure (card fees ~1–3%) influence net take-rates.
- Dev kits: high upfront costs, platform-dependent
- Platform fee: 30% (App Store/Play, 2024)
- Card fees: ~1–3%
- Fragmentation: higher coordination and compliance spend
Platform fees (30%), cloud concentration and exclusive rights squeeze margins
Platform gatekeepers retain strong leverage (App Store/Play 30% typical, tiering 15–30% for big partners, 2024), compressing EA margins and forcing monetization changes. Exclusive sports rights drive revenue concentration (EA ~7.5 billion USD FY2024) and renewal risk. Hyperscaler outages/pricing (AWS ~32%, Azure ~22%, GCP ~11% 2024) plus scarce senior talent (median senior game-engineer pay ~150,000 USD 2024) keep supplier power high.
| Metric | Value (2024) |
|---|---|
| Platform fee | 30% |
| EA revenue | ~7.5 bn USD |
| Cloud share (AWS/Azure/GCP) | 32% / 22% / 11% |
| Senior game-engineer pay | ~150,000 USD |
| Card fees | ~1–3% |
What is included in the product
Detailed Word Document
Tailored Porter’s Five Forces analysis for Electronic Arts revealing competitive intensity from major publishers and indie studios, buyer/supplier bargaining power, threat of substitutes and digital disruption, and entry barriers shaping profitability.
Customizable Excel Spreadsheet
A concise one-sheet Porter's Five Forces analysis for Electronic Arts—ideal for quick strategic decisions; customize force levels, swap in your own data, and visualize competitive pressure with a ready-to-use spider chart for decks or Excel dashboards.
Customers Bargaining Power
Low switching costs for gamers across genres and platforms
Low switching costs let players move quickly to rival or free-to-play titles, and free-to-play models drove roughly 75% of global games revenue in 2023–24, increasing alternatives. Discoverability via storefronts and influencers amplifies churn if quality dips, while price promotions and seasonal events (used widely across live-service titles) are essential to retention. These dynamics keep buyer power moderate to high despite brand loyalty for EA.
Sensitivity to monetization practices and live-service value
Consumers punish perceived pay-to-win or aggressive loot systems, as seen after the 2017 Star Wars Battlefront II backlash; transparent progression, fair cosmetics, and regular content drops reduce churn and negative sentiment. Social sentiment can swiftly dent sales and DAU, and EA reported FY2024 net revenue of about $6.9 billion driven largely by live services. EA must balance ARPU with community trust to limit buyer leverage.
Subscription bundling (EA Play, Game Pass, PS Plus)
Platform bundles like EA Play inside Game Pass (~30M subs in 2024) and PS Plus (~60M in 2024) give players low marginal access to large catalogs, anchoring lower price expectations; platform aggregators gain bargaining leverage as inclusion trades higher upfront fees for longer engagement tails, while buyer optionality compresses willingness to pay for premium standalone titles.
Regional price expectations and alternative entertainment
Emerging-market pricing, frequent promos and free-to-play norms (mobile >50% of industry revenue in 2024, top-grossing mobile largely F2P) raise price elasticity for EA titles; competing time sinks like streaming, social and UGC let players opt out of paid ecosystems. Local payment methods and clear refund policies materially affect conversion rates, while broad buyer choice strengthens customer negotiating power.
- Emerging-market price sensitivity
- F2P/promos increase elasticity
- Streaming/UGC as alternative time sinks
- Payments/refunds drive conversion
Community influence via creators and esports
Streamers and competitive players rapidly shape meta and sentiment for EA titles, with top broadcasts reaching millions and spikes on Twitch/YouTube often correlating with in-game engagement; negative creator sentiment has precipitated visible drops in concurrency and spend for live-service games. Positive alignment with creators boosts adoption efficiently, while community amplification turns individual preferences into collective bargaining power.
- Creator reach: millions per stream
- Sentiment → concurrency/spend impact
- Positive creator alignment = faster adoption
- Collective amplification increases buyer power
F2P ≈75% dominance and platform bundles boost buyer leverage; mobile >50%
Low switching costs and F2P dominance (≈75% of global games revenue 2023–24) raise buyer leverage; EA FY2024 revenue ≈$6.9B driven by live services. Platform bundles (Game Pass ~30M, PS Plus ~60M in 2024) compress price expectations. Creator reach and refunds/payment options amplify customer power, increasing elasticity, especially in mobile (>50% industry revenue 2024).
| Metric | Value |
|---|---|
| F2P share | ≈75% (2023–24) |
| EA FY2024 rev | ≈$6.9B |
| Game Pass subs | ~30M (2024) |
| PS Plus | ~60M (2024) |
| Mobile revenue | >50% (2024) |
Preview the Actual Deliverable
Electronic Arts Porter's Five Forces Analysis
This preview shows the exact Porter's Five Forces analysis of Electronic Arts you'll receive—no surprises or placeholders. The assessment covers competitive rivalry, supplier and buyer power, and the threats of new entrants and substitutes, with clear strategic implications. Upon purchase you'll get this same professionally formatted file instantly, ready for download and use.
Original: $10.00
-65%$10.00
$3.50Description
Go Beyond the Preview—Access the Full Strategic Report
Electronic Arts faces intense competitive rivalry and pressure from free-to-play substitutes, while strong IP, scale, and platform relationships limit new entrants; buyer power rises with digital distribution and live-service expectations, and supplier leverage is moderate. This brief snapshot only scratches the surface. Unlock the full Porter's Five Forces Analysis to explore EA’s competitive dynamics and strategic risks in detail.
Suppliers Bargaining Power
Platform gatekeepers (Sony, Microsoft, Nintendo, Apple, Google)
Access to consoles, mobile app stores and PC storefronts gives platform gatekeepers leverage via fees, promotion slots and certification timelines; 30% remains the industry norm while Apple/Google and console owners offer 15%–30% tiering or negotiated cuts for large partners. These revenue shares materially compress margins on full games and live services and platform policy or feature changes (certification, cross‑play rules, SDK access) can force roadmap and monetization shifts. Platform concentration (Sony, Microsoft, Nintendo, Apple, Google) keeps supplier power high despite EA’s scale.
Licensing partners and sports leagues (NFL, NHL, UFC, players’ unions)
Exclusive and semi-exclusive licenses underpin EA’s flagship sports franchises and drive a material share of revenue, with EA reporting roughly $7.5 billion in FY2024, much of it from live services and major sports titles. Rights holders can raise fees, mandate content standards, or restrict data and likeness use, squeezing margins and product scope. Contract renewals create step-up risks and brand transitions, as seen when EA lost the FIFA license in 2022–23 and launched EA Sports FC. Scarcity of unique IP gives these suppliers above-average bargaining power.
Technology and cloud providers (engine tech, online services, CDNs)
EA uses Frostbite but still depends on cloud, backend, anti-cheat, voice and analytics vendors; outages or pricing shifts from hyperscalers (AWS ~32%, Azure ~22%, Google Cloud ~11% global share in 2024) can squeeze live-service margins and player experience. Bespoke integrations increase vendor lock-in as services scale. EA’s scale and 500M+ players boost negotiating leverage, but supplier power remains material.
Talent and external development studios
Senior engineering, design and live-ops talent are scarce and globally contested; in 2024 US senior game-engineer median base pay ~150,000 USD, driving wage inflation, remote mobility and higher outsourcing rates (co-dev $40–150/hr). Staffing-linked delays can jeopardize seasonal sports cycles and DLC cadences; specialized co-dev and art studios can command premiums up to 50%.
- Talent scarcity: global competition, higher pay
- Cost impact: median senior pay ~150k USD (2024)
- Outsourcing: co-dev $40–150/hr; premiums up to 50%
- Operational risk: staffing delays hurt seasonal/DLC timing
Hardware, tools, and compliance vendors
Hardware dev kits, testing and anti-fraud tools, payment gateways and age-rating bodies materially shape EA release timing and costs; Apple and Google platform fees remain at 30% for many transactions (2024), affecting margins and monetization design.
Compliance for online safety, data privacy and regional rules increases reliance on niche providers and raises coordination costs across territories; payment processors and chargeback exposure (card fees ~1–3%) influence net take-rates.
- Dev kits: high upfront costs, platform-dependent
- Platform fee: 30% (App Store/Play, 2024)
- Card fees: ~1–3%
- Fragmentation: higher coordination and compliance spend
Platform fees (30%), cloud concentration and exclusive rights squeeze margins
Platform gatekeepers retain strong leverage (App Store/Play 30% typical, tiering 15–30% for big partners, 2024), compressing EA margins and forcing monetization changes. Exclusive sports rights drive revenue concentration (EA ~7.5 billion USD FY2024) and renewal risk. Hyperscaler outages/pricing (AWS ~32%, Azure ~22%, GCP ~11% 2024) plus scarce senior talent (median senior game-engineer pay ~150,000 USD 2024) keep supplier power high.
| Metric | Value (2024) |
|---|---|
| Platform fee | 30% |
| EA revenue | ~7.5 bn USD |
| Cloud share (AWS/Azure/GCP) | 32% / 22% / 11% |
| Senior game-engineer pay | ~150,000 USD |
| Card fees | ~1–3% |
What is included in the product
Detailed Word Document
Tailored Porter’s Five Forces analysis for Electronic Arts revealing competitive intensity from major publishers and indie studios, buyer/supplier bargaining power, threat of substitutes and digital disruption, and entry barriers shaping profitability.
Customizable Excel Spreadsheet
A concise one-sheet Porter's Five Forces analysis for Electronic Arts—ideal for quick strategic decisions; customize force levels, swap in your own data, and visualize competitive pressure with a ready-to-use spider chart for decks or Excel dashboards.
Customers Bargaining Power
Low switching costs for gamers across genres and platforms
Low switching costs let players move quickly to rival or free-to-play titles, and free-to-play models drove roughly 75% of global games revenue in 2023–24, increasing alternatives. Discoverability via storefronts and influencers amplifies churn if quality dips, while price promotions and seasonal events (used widely across live-service titles) are essential to retention. These dynamics keep buyer power moderate to high despite brand loyalty for EA.
Sensitivity to monetization practices and live-service value
Consumers punish perceived pay-to-win or aggressive loot systems, as seen after the 2017 Star Wars Battlefront II backlash; transparent progression, fair cosmetics, and regular content drops reduce churn and negative sentiment. Social sentiment can swiftly dent sales and DAU, and EA reported FY2024 net revenue of about $6.9 billion driven largely by live services. EA must balance ARPU with community trust to limit buyer leverage.
Subscription bundling (EA Play, Game Pass, PS Plus)
Platform bundles like EA Play inside Game Pass (~30M subs in 2024) and PS Plus (~60M in 2024) give players low marginal access to large catalogs, anchoring lower price expectations; platform aggregators gain bargaining leverage as inclusion trades higher upfront fees for longer engagement tails, while buyer optionality compresses willingness to pay for premium standalone titles.
Regional price expectations and alternative entertainment
Emerging-market pricing, frequent promos and free-to-play norms (mobile >50% of industry revenue in 2024, top-grossing mobile largely F2P) raise price elasticity for EA titles; competing time sinks like streaming, social and UGC let players opt out of paid ecosystems. Local payment methods and clear refund policies materially affect conversion rates, while broad buyer choice strengthens customer negotiating power.
- Emerging-market price sensitivity
- F2P/promos increase elasticity
- Streaming/UGC as alternative time sinks
- Payments/refunds drive conversion
Community influence via creators and esports
Streamers and competitive players rapidly shape meta and sentiment for EA titles, with top broadcasts reaching millions and spikes on Twitch/YouTube often correlating with in-game engagement; negative creator sentiment has precipitated visible drops in concurrency and spend for live-service games. Positive alignment with creators boosts adoption efficiently, while community amplification turns individual preferences into collective bargaining power.
- Creator reach: millions per stream
- Sentiment → concurrency/spend impact
- Positive creator alignment = faster adoption
- Collective amplification increases buyer power
F2P ≈75% dominance and platform bundles boost buyer leverage; mobile >50%
Low switching costs and F2P dominance (≈75% of global games revenue 2023–24) raise buyer leverage; EA FY2024 revenue ≈$6.9B driven by live services. Platform bundles (Game Pass ~30M, PS Plus ~60M in 2024) compress price expectations. Creator reach and refunds/payment options amplify customer power, increasing elasticity, especially in mobile (>50% industry revenue 2024).
| Metric | Value |
|---|---|
| F2P share | ≈75% (2023–24) |
| EA FY2024 rev | ≈$6.9B |
| Game Pass subs | ~30M (2024) |
| PS Plus | ~60M (2024) |
| Mobile revenue | >50% (2024) |
Preview the Actual Deliverable
Electronic Arts Porter's Five Forces Analysis
This preview shows the exact Porter's Five Forces analysis of Electronic Arts you'll receive—no surprises or placeholders. The assessment covers competitive rivalry, supplier and buyer power, and the threats of new entrants and substitutes, with clear strategic implications. Upon purchase you'll get this same professionally formatted file instantly, ready for download and use.











