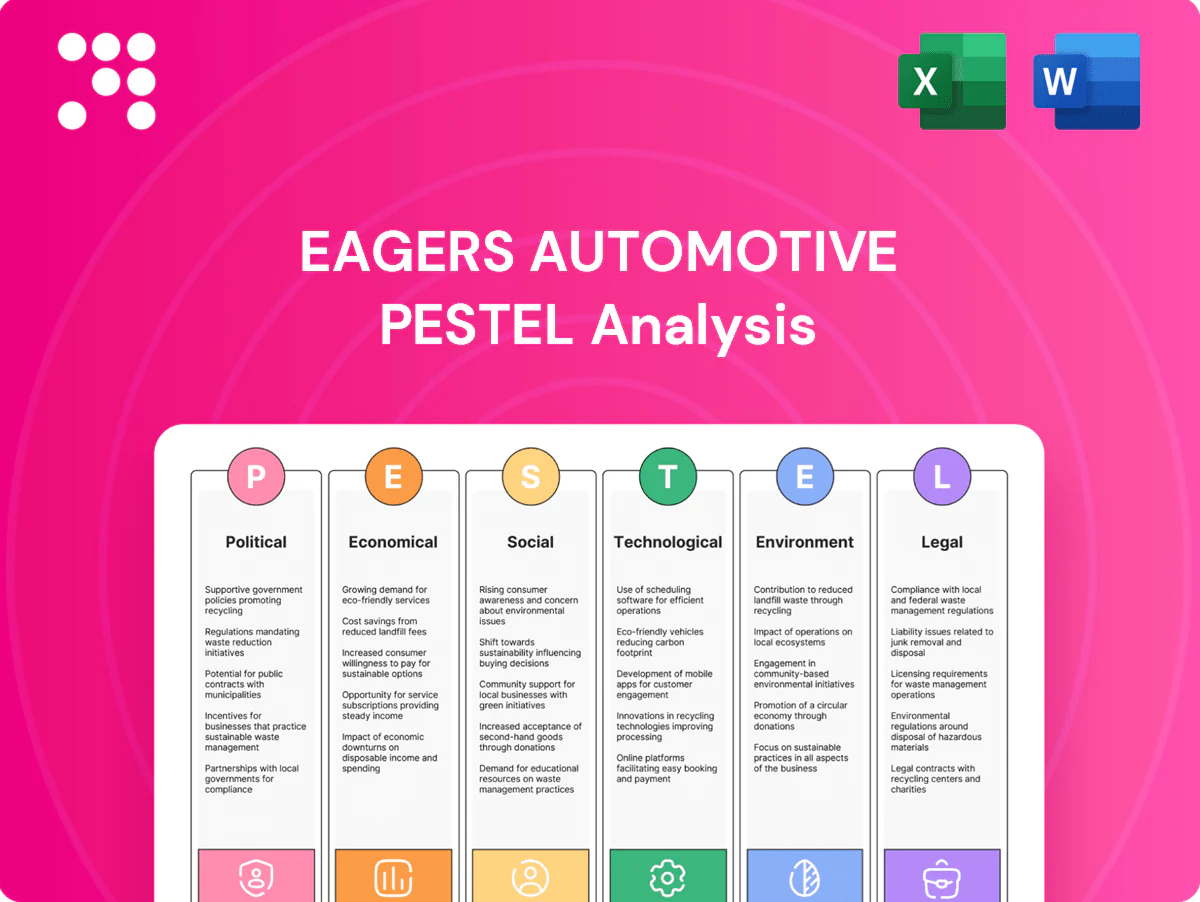
Eagers Automotive PESTLE Analysis

Skip the Research. Get the Strategy.
Discover how political shifts, economic cycles, social trends, technology adoption, environmental pressures, and regulatory changes converge to shape Eagers Automotive's strategy and valuation; our concise PESTLE highlights key risks and opportunities and guides tactical decisions. Purchase the full, ready-to-use PESTLE for a deep, actionable breakdown you can download immediately.
Political factors

EV incentives and standards
Australia’s New Vehicle Efficiency Standard phases in from 2025, forcing OEMs to shift mix, pricing and marketing toward lower‑emission models. Federal and state EV incentives—local rebates up to A$3,000—continue to steer consumer uptake and dealer allocations. New Zealand removed its Clean Car Discount in 2023, altering cross‑Tasman demand. Eagers must rebalance inventory and messaging accordingly.
State regulatory fragmentation
State road-user charges, stamp duties and registration policies in Australia vary materially by jurisdiction, altering total cost of ownership and affecting demand at Eagers Automotive’s ~170 dealerships; stamp duty differences can add several thousand dollars to purchase cost between states. ZEV targets and charging grant programs differ across states and territories, shaping local EV uptake and incentive availability. Dealership-level compliance, pricing and sales strategies must be localized, and network planning needs to incorporate divergent policy signals when siting chargers and forecasting volumes.

Infrastructure and transport policy
Public investment in charging corridors and urban transport—supporting roughly 6,000 public fast chargers nationally by mid‑2025—shifts vehicle mix and showroom traffic toward EVs and hybrids. Policies prioritising light commercial vehicles for infrastructure and industry projects, with LCVs ~25% of new-vehicle sales in 2024, boost ute and van demand. Urban congestion and parking rules force compact city dealership formats, and Eagers can tailor fleet offerings to funded projects and charging networks.

Trade policy and import settings
Tariffs, biosecurity rules and port logistics materially affect delivery timing and costs for imported vehicles and parts, increasing working capital and margin risk; shifts in Australia–Japan, Australia–EU or NZ trade settings can change brand price competitiveness; changes to the 33% luxury car tax or fringe benefits tax alter corporate lease and fleet demand; proactive pricing and pipeline visibility are therefore crucial.
- 33% LCT rate impacts pricing
- Australia–Japan EPA in force since 2015
- Australia–EU FTA negotiations ongoing in 2024
- NZ CER arrangements date to 1983
Political cycles and stability
Election cycles in Australia (federal election 21 May 2022) and New Zealand (general election 14 Oct 2023) can pivot automotive policy, incentives and consumer sentiment, affecting quarterly sales; fiscal settings and rising borrowing costs squeeze household budgets—Australia household debt to income ~185% in 2024—directly reducing vehicle affordability. Stable governance supports long-term network investments; scenario planning cushions policy whiplash risk.
- Election timing: policy swings risk
- Household debt ~185% (2024)
- Interest/fiscal settings affect affordability
- Stable governance enables CAPEX
- Scenario planning mitigates whiplash
Policy, EV rebates and 6,000 chargers reshape stocking; 33% LCT pressures margins
Policy shifts—Australia’s New Vehicle Efficiency Standard (phased from 2025) and state EV incentives (rebates up to A$3,000)—are driving stocking, pricing and marketing toward low‑emission models. Jurisdictional stamp duties and registration fees materially change TCO and demand across Eagers’ ~170 dealerships. Public charging rollout (~6,000 fast chargers national mid‑2025) and trade/tariff rules (33% LCT) affect supply, margins and fleet sales.
| Metric | Value |
|---|---|
| Dealerships | ~170 |
| Public fast chargers (mid‑2025) | ~6,000 |
| Household debt to income (2024) | ~185% |
| Luxury Car Tax rate | 33% |
What is included in the product
 Detailed Word Document
Explores how Political, Economic, Social, Technological, Environmental and Legal forces uniquely affect Eagers Automotive, with data-backed trends and region-specific insights to identify strategic risks and opportunities for executives, investors and advisors; formatted for easy insertion into plans and including forward-looking implications for scenario planning.

 Customizable Excel Spreadsheet
A concise, visually segmented PESTLE summary for Eagers Automotive that can be dropped into presentations, annotated with region- or business-specific notes, and easily shared across teams to streamline strategic planning and external risk discussions.
Economic factors

Interest rates and credit
Elevated policy rates (RBA cash rate ~4.35% mid‑2024) and retail auto loan rates averaging near 7% have reduced affordability for new and used cars, extending purchase decision cycles. Finance penetration and captive-style offers (dealer finance now underwriting ~40–50% of vehicle sales) are key levers to preserve volume. Potential refinancing waves and eventual rate cuts could unlock pent-up demand, while tighter underwriting has compressed approval rates and reduced marginal buyers.
Consumer confidence and incomes
Cost-of-living pressures (CPI ~3.4% in 2024) and subdued Westpac consumer confidence (~82 June 2025) weigh on discretionary buys and option upsell, while wage growth (~4.0% AWE 2024) and unemployment near 4.1% (mid-2025) drive showroom conversion. Promotions, GFV offers and subscription models reduce sticker shock and improve turnover. Regional income dispersion—median weekly household incomes ~$2,200 in Sydney vs ~$1,300 in some regional areas (ABS)—shapes site performance.

FX and import costs
AUD and NZD moves versus USD, EUR and JPY directly alter landed vehicle and parts costs—AUD/USD ~0.67 and NZD/USD ~0.59 in mid-2025, raising import bills when local currency weakens. Hedging and OEM price lists lag spot, driving margin volatility and quarterly swings seen across 2024–25. Replacement-cost shifts feed used-car valuations, compressing or inflating margins. Transparent pricing and nimble inventory rebalancing protect gross margins.

Supply normalization and residuals
Post-pandemic supply easing by mid-2024 normalized delivery times and pushed OEMs toward discounting, compressing margins on new vehicles; used-vehicle markets saw values retreat from 2021–22 peaks through 2024, reducing trade-in equity and F&I attach rates as fleet renewal cycles resumed with backlog unwind.
- Stock turn discipline critical — tighter days’ supply limits exposure
- Appraisal accuracy vital to protect margins on trade-ins
- Fleet replenishment driving volume recovery in 2024
Commercial and fleet demand
Construction, mining and logistics activity underpin LCV and SUV volumes, with mining investment in Australia at A$250bn+ in 2024 supporting fleet renewals and last-mile logistics growth.
Government and corporate tenders drive quarterly cadence—fleet contracts can shift monthly allocations and represented ~25% of Eagers fleet sales in 2024.
Total cost of ownership analysis favours hybrids and efficient ICE in high-mileage duty cycles; Eagers tailors fleet bundles and service SLAs to reduce TCO and improve retention.
- construction: A$250bn+ mining investment 2024
- tenders: ~25% quarterly fleet volume
- TCO: hybrids/efficient ICE preferred for high mileage
- Eagers: customised bundles + SLAs
Policy, EV rebates and 6,000 chargers reshape stocking; 33% LCT pressures margins
Higher policy rates (RBA ~4.35%) and retail loans (~7%) dampen affordability and extend purchase cycles; captive dealer finance (40–50% penetration) preserves volume. CPI ~3.4%, AWE wage growth ~4.0% and unemployment ~4.1% curb discretionary upsell. AUD ~0.67 and NZD ~0.59 vs USD raise import costs; mining spend A$250bn supports LCV demand and ~25% fleet tender share.
| Metric | Value |
|---|---|
| RBA cash rate | 4.35% |
| Retail loan rate | ~7% |
| CPI | 3.4% |
| AUD/USD | 0.67 |
Same Document Delivered
Eagers Automotive PESTLE Analysis
The preview shown here is the exact Eagers Automotive PESTLE Analysis you’ll receive after purchase—fully formatted, complete and ready to use. This is the real, final file with the same content, layout and structure visible now. No placeholders or surprises; you’ll download this exact document immediately after checkout.

Skip the Research. Get the Strategy.
Discover how political shifts, economic cycles, social trends, technology adoption, environmental pressures, and regulatory changes converge to shape Eagers Automotive's strategy and valuation; our concise PESTLE highlights key risks and opportunities and guides tactical decisions. Purchase the full, ready-to-use PESTLE for a deep, actionable breakdown you can download immediately.
Political factors
EV incentives and standards
Australia’s New Vehicle Efficiency Standard phases in from 2025, forcing OEMs to shift mix, pricing and marketing toward lower‑emission models. Federal and state EV incentives—local rebates up to A$3,000—continue to steer consumer uptake and dealer allocations. New Zealand removed its Clean Car Discount in 2023, altering cross‑Tasman demand. Eagers must rebalance inventory and messaging accordingly.
State regulatory fragmentation
State road-user charges, stamp duties and registration policies in Australia vary materially by jurisdiction, altering total cost of ownership and affecting demand at Eagers Automotive’s ~170 dealerships; stamp duty differences can add several thousand dollars to purchase cost between states. ZEV targets and charging grant programs differ across states and territories, shaping local EV uptake and incentive availability. Dealership-level compliance, pricing and sales strategies must be localized, and network planning needs to incorporate divergent policy signals when siting chargers and forecasting volumes.
Infrastructure and transport policy
Public investment in charging corridors and urban transport—supporting roughly 6,000 public fast chargers nationally by mid‑2025—shifts vehicle mix and showroom traffic toward EVs and hybrids. Policies prioritising light commercial vehicles for infrastructure and industry projects, with LCVs ~25% of new-vehicle sales in 2024, boost ute and van demand. Urban congestion and parking rules force compact city dealership formats, and Eagers can tailor fleet offerings to funded projects and charging networks.
Trade policy and import settings
Tariffs, biosecurity rules and port logistics materially affect delivery timing and costs for imported vehicles and parts, increasing working capital and margin risk; shifts in Australia–Japan, Australia–EU or NZ trade settings can change brand price competitiveness; changes to the 33% luxury car tax or fringe benefits tax alter corporate lease and fleet demand; proactive pricing and pipeline visibility are therefore crucial.
- 33% LCT rate impacts pricing
- Australia–Japan EPA in force since 2015
- Australia–EU FTA negotiations ongoing in 2024
- NZ CER arrangements date to 1983
Political cycles and stability
Election cycles in Australia (federal election 21 May 2022) and New Zealand (general election 14 Oct 2023) can pivot automotive policy, incentives and consumer sentiment, affecting quarterly sales; fiscal settings and rising borrowing costs squeeze household budgets—Australia household debt to income ~185% in 2024—directly reducing vehicle affordability. Stable governance supports long-term network investments; scenario planning cushions policy whiplash risk.
- Election timing: policy swings risk
- Household debt ~185% (2024)
- Interest/fiscal settings affect affordability
- Stable governance enables CAPEX
- Scenario planning mitigates whiplash
Policy, EV rebates and 6,000 chargers reshape stocking; 33% LCT pressures margins
Policy shifts—Australia’s New Vehicle Efficiency Standard (phased from 2025) and state EV incentives (rebates up to A$3,000)—are driving stocking, pricing and marketing toward low‑emission models. Jurisdictional stamp duties and registration fees materially change TCO and demand across Eagers’ ~170 dealerships. Public charging rollout (~6,000 fast chargers national mid‑2025) and trade/tariff rules (33% LCT) affect supply, margins and fleet sales.
| Metric | Value |
|---|---|
| Dealerships | ~170 |
| Public fast chargers (mid‑2025) | ~6,000 |
| Household debt to income (2024) | ~185% |
| Luxury Car Tax rate | 33% |
What is included in the product
Detailed Word Document
Explores how Political, Economic, Social, Technological, Environmental and Legal forces uniquely affect Eagers Automotive, with data-backed trends and region-specific insights to identify strategic risks and opportunities for executives, investors and advisors; formatted for easy insertion into plans and including forward-looking implications for scenario planning.
Customizable Excel Spreadsheet
A concise, visually segmented PESTLE summary for Eagers Automotive that can be dropped into presentations, annotated with region- or business-specific notes, and easily shared across teams to streamline strategic planning and external risk discussions.
Economic factors
Interest rates and credit
Elevated policy rates (RBA cash rate ~4.35% mid‑2024) and retail auto loan rates averaging near 7% have reduced affordability for new and used cars, extending purchase decision cycles. Finance penetration and captive-style offers (dealer finance now underwriting ~40–50% of vehicle sales) are key levers to preserve volume. Potential refinancing waves and eventual rate cuts could unlock pent-up demand, while tighter underwriting has compressed approval rates and reduced marginal buyers.
Consumer confidence and incomes
Cost-of-living pressures (CPI ~3.4% in 2024) and subdued Westpac consumer confidence (~82 June 2025) weigh on discretionary buys and option upsell, while wage growth (~4.0% AWE 2024) and unemployment near 4.1% (mid-2025) drive showroom conversion. Promotions, GFV offers and subscription models reduce sticker shock and improve turnover. Regional income dispersion—median weekly household incomes ~$2,200 in Sydney vs ~$1,300 in some regional areas (ABS)—shapes site performance.
FX and import costs
AUD and NZD moves versus USD, EUR and JPY directly alter landed vehicle and parts costs—AUD/USD ~0.67 and NZD/USD ~0.59 in mid-2025, raising import bills when local currency weakens. Hedging and OEM price lists lag spot, driving margin volatility and quarterly swings seen across 2024–25. Replacement-cost shifts feed used-car valuations, compressing or inflating margins. Transparent pricing and nimble inventory rebalancing protect gross margins.
Supply normalization and residuals
Post-pandemic supply easing by mid-2024 normalized delivery times and pushed OEMs toward discounting, compressing margins on new vehicles; used-vehicle markets saw values retreat from 2021–22 peaks through 2024, reducing trade-in equity and F&I attach rates as fleet renewal cycles resumed with backlog unwind.
- Stock turn discipline critical — tighter days’ supply limits exposure
- Appraisal accuracy vital to protect margins on trade-ins
- Fleet replenishment driving volume recovery in 2024
Commercial and fleet demand
Construction, mining and logistics activity underpin LCV and SUV volumes, with mining investment in Australia at A$250bn+ in 2024 supporting fleet renewals and last-mile logistics growth.
Government and corporate tenders drive quarterly cadence—fleet contracts can shift monthly allocations and represented ~25% of Eagers fleet sales in 2024.
Total cost of ownership analysis favours hybrids and efficient ICE in high-mileage duty cycles; Eagers tailors fleet bundles and service SLAs to reduce TCO and improve retention.
- construction: A$250bn+ mining investment 2024
- tenders: ~25% quarterly fleet volume
- TCO: hybrids/efficient ICE preferred for high mileage
- Eagers: customised bundles + SLAs
Policy, EV rebates and 6,000 chargers reshape stocking; 33% LCT pressures margins
Higher policy rates (RBA ~4.35%) and retail loans (~7%) dampen affordability and extend purchase cycles; captive dealer finance (40–50% penetration) preserves volume. CPI ~3.4%, AWE wage growth ~4.0% and unemployment ~4.1% curb discretionary upsell. AUD ~0.67 and NZD ~0.59 vs USD raise import costs; mining spend A$250bn supports LCV demand and ~25% fleet tender share.
| Metric | Value |
|---|---|
| RBA cash rate | 4.35% |
| Retail loan rate | ~7% |
| CPI | 3.4% |
| AUD/USD | 0.67 |
Same Document Delivered
Eagers Automotive PESTLE Analysis
The preview shown here is the exact Eagers Automotive PESTLE Analysis you’ll receive after purchase—fully formatted, complete and ready to use. This is the real, final file with the same content, layout and structure visible now. No placeholders or surprises; you’ll download this exact document immediately after checkout.
Description
Skip the Research. Get the Strategy.
Discover how political shifts, economic cycles, social trends, technology adoption, environmental pressures, and regulatory changes converge to shape Eagers Automotive's strategy and valuation; our concise PESTLE highlights key risks and opportunities and guides tactical decisions. Purchase the full, ready-to-use PESTLE for a deep, actionable breakdown you can download immediately.
Political factors
EV incentives and standards
Australia’s New Vehicle Efficiency Standard phases in from 2025, forcing OEMs to shift mix, pricing and marketing toward lower‑emission models. Federal and state EV incentives—local rebates up to A$3,000—continue to steer consumer uptake and dealer allocations. New Zealand removed its Clean Car Discount in 2023, altering cross‑Tasman demand. Eagers must rebalance inventory and messaging accordingly.
State regulatory fragmentation
State road-user charges, stamp duties and registration policies in Australia vary materially by jurisdiction, altering total cost of ownership and affecting demand at Eagers Automotive’s ~170 dealerships; stamp duty differences can add several thousand dollars to purchase cost between states. ZEV targets and charging grant programs differ across states and territories, shaping local EV uptake and incentive availability. Dealership-level compliance, pricing and sales strategies must be localized, and network planning needs to incorporate divergent policy signals when siting chargers and forecasting volumes.
Infrastructure and transport policy
Public investment in charging corridors and urban transport—supporting roughly 6,000 public fast chargers nationally by mid‑2025—shifts vehicle mix and showroom traffic toward EVs and hybrids. Policies prioritising light commercial vehicles for infrastructure and industry projects, with LCVs ~25% of new-vehicle sales in 2024, boost ute and van demand. Urban congestion and parking rules force compact city dealership formats, and Eagers can tailor fleet offerings to funded projects and charging networks.
Trade policy and import settings
Tariffs, biosecurity rules and port logistics materially affect delivery timing and costs for imported vehicles and parts, increasing working capital and margin risk; shifts in Australia–Japan, Australia–EU or NZ trade settings can change brand price competitiveness; changes to the 33% luxury car tax or fringe benefits tax alter corporate lease and fleet demand; proactive pricing and pipeline visibility are therefore crucial.
- 33% LCT rate impacts pricing
- Australia–Japan EPA in force since 2015
- Australia–EU FTA negotiations ongoing in 2024
- NZ CER arrangements date to 1983
Political cycles and stability
Election cycles in Australia (federal election 21 May 2022) and New Zealand (general election 14 Oct 2023) can pivot automotive policy, incentives and consumer sentiment, affecting quarterly sales; fiscal settings and rising borrowing costs squeeze household budgets—Australia household debt to income ~185% in 2024—directly reducing vehicle affordability. Stable governance supports long-term network investments; scenario planning cushions policy whiplash risk.
- Election timing: policy swings risk
- Household debt ~185% (2024)
- Interest/fiscal settings affect affordability
- Stable governance enables CAPEX
- Scenario planning mitigates whiplash
Policy, EV rebates and 6,000 chargers reshape stocking; 33% LCT pressures margins
Policy shifts—Australia’s New Vehicle Efficiency Standard (phased from 2025) and state EV incentives (rebates up to A$3,000)—are driving stocking, pricing and marketing toward low‑emission models. Jurisdictional stamp duties and registration fees materially change TCO and demand across Eagers’ ~170 dealerships. Public charging rollout (~6,000 fast chargers national mid‑2025) and trade/tariff rules (33% LCT) affect supply, margins and fleet sales.
| Metric | Value |
|---|---|
| Dealerships | ~170 |
| Public fast chargers (mid‑2025) | ~6,000 |
| Household debt to income (2024) | ~185% |
| Luxury Car Tax rate | 33% |
What is included in the product
Detailed Word Document
Explores how Political, Economic, Social, Technological, Environmental and Legal forces uniquely affect Eagers Automotive, with data-backed trends and region-specific insights to identify strategic risks and opportunities for executives, investors and advisors; formatted for easy insertion into plans and including forward-looking implications for scenario planning.
Customizable Excel Spreadsheet
A concise, visually segmented PESTLE summary for Eagers Automotive that can be dropped into presentations, annotated with region- or business-specific notes, and easily shared across teams to streamline strategic planning and external risk discussions.
Economic factors
Interest rates and credit
Elevated policy rates (RBA cash rate ~4.35% mid‑2024) and retail auto loan rates averaging near 7% have reduced affordability for new and used cars, extending purchase decision cycles. Finance penetration and captive-style offers (dealer finance now underwriting ~40–50% of vehicle sales) are key levers to preserve volume. Potential refinancing waves and eventual rate cuts could unlock pent-up demand, while tighter underwriting has compressed approval rates and reduced marginal buyers.
Consumer confidence and incomes
Cost-of-living pressures (CPI ~3.4% in 2024) and subdued Westpac consumer confidence (~82 June 2025) weigh on discretionary buys and option upsell, while wage growth (~4.0% AWE 2024) and unemployment near 4.1% (mid-2025) drive showroom conversion. Promotions, GFV offers and subscription models reduce sticker shock and improve turnover. Regional income dispersion—median weekly household incomes ~$2,200 in Sydney vs ~$1,300 in some regional areas (ABS)—shapes site performance.
FX and import costs
AUD and NZD moves versus USD, EUR and JPY directly alter landed vehicle and parts costs—AUD/USD ~0.67 and NZD/USD ~0.59 in mid-2025, raising import bills when local currency weakens. Hedging and OEM price lists lag spot, driving margin volatility and quarterly swings seen across 2024–25. Replacement-cost shifts feed used-car valuations, compressing or inflating margins. Transparent pricing and nimble inventory rebalancing protect gross margins.
Supply normalization and residuals
Post-pandemic supply easing by mid-2024 normalized delivery times and pushed OEMs toward discounting, compressing margins on new vehicles; used-vehicle markets saw values retreat from 2021–22 peaks through 2024, reducing trade-in equity and F&I attach rates as fleet renewal cycles resumed with backlog unwind.
- Stock turn discipline critical — tighter days’ supply limits exposure
- Appraisal accuracy vital to protect margins on trade-ins
- Fleet replenishment driving volume recovery in 2024
Commercial and fleet demand
Construction, mining and logistics activity underpin LCV and SUV volumes, with mining investment in Australia at A$250bn+ in 2024 supporting fleet renewals and last-mile logistics growth.
Government and corporate tenders drive quarterly cadence—fleet contracts can shift monthly allocations and represented ~25% of Eagers fleet sales in 2024.
Total cost of ownership analysis favours hybrids and efficient ICE in high-mileage duty cycles; Eagers tailors fleet bundles and service SLAs to reduce TCO and improve retention.
- construction: A$250bn+ mining investment 2024
- tenders: ~25% quarterly fleet volume
- TCO: hybrids/efficient ICE preferred for high mileage
- Eagers: customised bundles + SLAs
Policy, EV rebates and 6,000 chargers reshape stocking; 33% LCT pressures margins
Higher policy rates (RBA ~4.35%) and retail loans (~7%) dampen affordability and extend purchase cycles; captive dealer finance (40–50% penetration) preserves volume. CPI ~3.4%, AWE wage growth ~4.0% and unemployment ~4.1% curb discretionary upsell. AUD ~0.67 and NZD ~0.59 vs USD raise import costs; mining spend A$250bn supports LCV demand and ~25% fleet tender share.
| Metric | Value |
|---|---|
| RBA cash rate | 4.35% |
| Retail loan rate | ~7% |
| CPI | 3.4% |
| AUD/USD | 0.67 |
Same Document Delivered
Eagers Automotive PESTLE Analysis
The preview shown here is the exact Eagers Automotive PESTLE Analysis you’ll receive after purchase—fully formatted, complete and ready to use. This is the real, final file with the same content, layout and structure visible now. No placeholders or surprises; you’ll download this exact document immediately after checkout.











