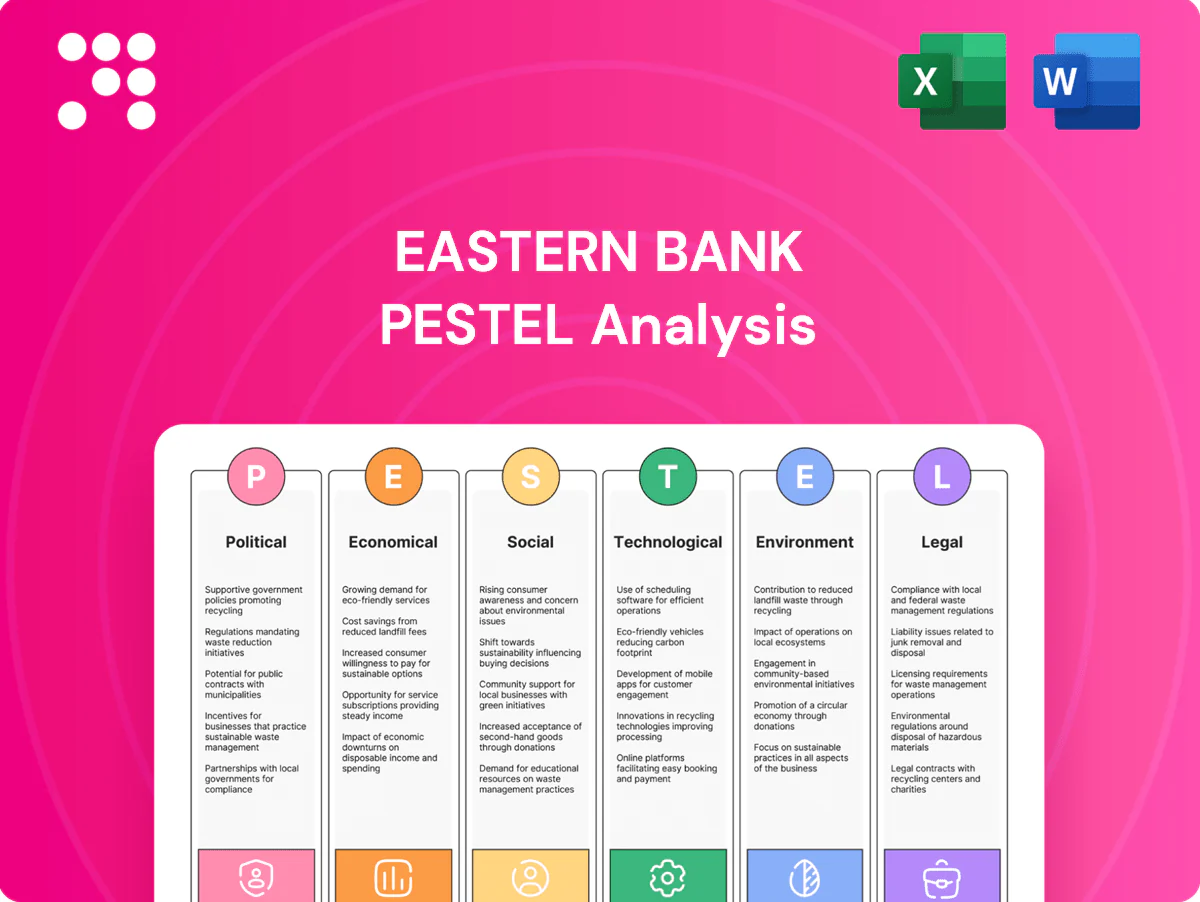
Eastern Bank PESTLE Analysis

Plan Smarter. Present Sharper. Compete Stronger.
Unlock strategic insights with our tailored PESTLE analysis of Eastern Bank—clarifying how political, economic, social, technological, legal, and environmental forces shape its outlook. Ideal for investors, advisors, and planners seeking actionable intelligence. Purchase the full report to access detailed, ready-to-use findings and recommendations.
Political factors

Regulatory policy stability
Banking is highly shaped by federal and state policy direction, affecting capital, liquidity, and consumer rules; U.S. banks reported an aggregate CET1 ratio near 12.8% in 2024, so shifts in capital rules materially affect Eastern Bank’s capital planning. Stability lowers compliance uncertainty and planning costs, while post-election policy swings can reset supervision intensity and stress-testing focus. Monitoring federal rulemaking calendars (federalregister.gov) helps time product launches and adjust risk appetite.
Government lending programs
Public programs like SBA lending, which guarantees up to 85% of 7(a) loans and caps at $5 million per loan, drive small-business credit demand and influence underwriting standards.
Eastern Bank can expand originations by aligning product eligibility, documentation and pricing with SBA 7(a)/504 guarantees and CRA-focused community lending goals.
Changes in program funding or terms can quickly shift volumes and risk mix, so active advocacy helps ensure program design meets local community needs.

Fiscal spending and infrastructure
Federal infrastructure outlays from the 2021 Infrastructure Investment and Jobs Act (IIJA) — $550 billion in new spending — plus ongoing state and local capital plans drive deposits, payments flow and commercial loan demand for banks like Eastern. Infrastructure spending raises contractor financing and corporate treasury needs while supporting municipal bond issuance in the roughly $4 trillion US muni market. Delays or cuts in projects can soften construction pipelines and reduce fee and lending opportunities; Eastern benefits from regional visibility into municipal budgets to underwrite and time lending.

Geopolitical tensions and sanctions
Geopolitical tensions and sanctions amplify screening burdens and correspondent-banking risk; the US SDN list exceeds 6,000 entries as of 2024, forcing continuous OFAC rule updates. Even domestically focused banks face wire-transfer and trade-finance exposure, requiring rapid KYC/OFAC control changes and stronger vendor governance to limit list-management breaches.
- Heightened screening: SDN list >6,000 (2024)
- Exposure: wire transfers & trade finance
- Operational need: rapid KYC/OFAC updates
- Mitigation: robust vendor & list-management governance
Community reinvestment expectations
Political emphasis on financial inclusion drives CRA evaluations and influences Eastern Bank’s branch and lending strategies; the bank reported $40.3 billion in assets in 2024 and highlights community lending as a growth channel. Proposed OCC and CFPB rule changes could shift data collection and assessment criteria, so proactive outreach helps align regulatory outcomes with growth and approval risk.
- CRA focus shapes branch siting and product mix
- Community lending tied to reputational capital and approvals
- Rule changes may broaden data/assessment areas
- Proactive outreach reduces approval risk, supports growth
Regulatory, KYC and SDN risks shape capital planning; CET1 ~12.8%
Federal capital, consumer and OFAC rules—CET1 ~12.8% (2024); SDN list >6,000 (2024)—drive Eastern Bank’s capital planning, KYC and correspondent risk. SBA 7(a) guarantees (up to 85%, $5M) and IIJA $550B suite boost SME and municipal demand; Eastern reported $40.3B assets (2024). Proactive advocacy and rapid compliance updates preserve growth and approval prospects.
| Metric | Value (2024) |
|---|---|
| CET1 | ~12.8% |
| Assets (Eastern) | $40.3B |
| SDN list | >6,000 |
| IIJA new spending | $550B |
| SBA 7(a) guarantee | Up to 85%, $5M cap |
What is included in the product
 Detailed Word Document
Examines how Political, Economic, Social, Technological, Environmental, and Legal forces uniquely shape Eastern Bank’s strategic risks and growth opportunities, with each dimension grounded in current data and regional market dynamics. Designed for executives and advisors, it offers forward-looking insights to inform scenario planning, compliance and competitive strategy.

 Customizable Excel Spreadsheet
A concise, visually segmented PESTLE summary for Eastern Bank that can be dropped into presentations, edited for local context or business lines, and easily shared across teams to streamline risk discussions and strategic planning.
Economic factors

Interest rate cycle and margin
Eastern Banks net interest margin is highly sensitive to Fed policy and deposit betas; with the federal funds rate around 5.25–5.50% in 2024–25, rapid hikes lifted asset yields but pushed funding costs and deposit competition higher. Deposit betas climbed toward 40–60% during the tightening, compressing NIMs when easing began, which in turn supported credit quality and origination volumes. Active balance-sheet hedging has reduced quarter-to-quarter margin volatility.
Credit cycle and unemployment
Consumer and SME delinquencies closely track labor market health; U.S. unemployment stood at 4.0% in June 2025 (BLS), lifting default risk across retail cards, auto loans and small-business portfolios.
Rising unemployment typically forces higher provisions and credit costs for Eastern Bank, particularly in unsecured and auto segments.
Prudent underwriting, sector diversification and early-warning analytics accelerate workout actions and help contain charge-offs.

Housing market dynamics
Mortgage demand, refi activity and HELOC use track home prices and borrowing costs: S&P CoreLogic Case-Shiller 20-city index rose about 4% year-over-year in 2024 while 30-year fixed rates averaged near 7%, keeping refi share low but primed to jump if rates fall. Tight inventory (roughly 2 months supply nationally in 2024) and high prices have depressed purchase volumes but support collateral values and LTVs. Rate declines historically spur refinancing waves and fee income — refi origination spikes can boost noninterest income by double-digit percentages in months after cuts. Eastern Bank must flex pipeline staffing and recalibrate secondary-market hedging and MSR strategies to capture volatile origination and preserve net interest margins.

Yield curve and liquidity
An inverted yield curve through 2024 compressed spreads and marked-to-market losses in securities portfolios, increasing pressure on net interest margin as the federal funds rate averaged about 5.3% in 2024. Deposit migration into higher-yield alternatives—money market assets near 7 trillion dollars in 2024—strained bank liquidity, making strong ALM, contingency funding plans and granular core deposits critical. Securities duration positioning and unrealized OCI swings materially affect regulatory capital ratios.
- Yield curve: inverted in 2024 — tighter spreads
- Fed funds: ~5.3% (2024)
- MMF assets: ~7T (2024)
- Key mitigants: ALM, contingency funding, granular deposits
- Risk: securities duration & OCI impact on capital
SMB health and regional GDP
Local business formation and consumer spending drive Eastern Bank’s commercial loans and payments volume, supported by its >$50bn asset base (2024). Sector mix—hospitality, healthcare, tech—creates concentration patterns that shape underwriting and loss provisioning. Targeted advisory and treasury services deepen client ties across cycles, while New England’s GDP outperformance versus the US (BEA, 2023) underpins stable deposits and fee income.
- Commercial loans growth tied to local firm formation
- Hospitality/healthcare/tech = sector risk concentration
- Treasury/advisory = stronger client retention
- Regional GDP outperformance supports deposits/fees
Regulatory, KYC and SDN risks shape capital planning; CET1 ~12.8%
Economic backdrop: Fed funds ~5.25–5.50% (2024–25) and inverted curve in 2024 compressed spreads; money‑market assets ≈$7T (2024) raised deposit competition. U.S. unemployment 4.0% (June 2025) pressures retail/SME delinquencies; housing: Case‑Shiller +4% (2024), 30‑yr ~7% kept refi low. Eastern Bank (> $50bn assets, 2024) needs active ALM, hedging and provisioning.
| Metric | Value | Relevance |
|---|---|---|
| Fed funds | 5.25–5.50% | NIM/loan yields |
| Unemployment | 4.0% (Jun 2025) | Credit risk |
| MMF assets | $7T (2024) | Deposit competition |
| Case‑Shiller | +4% (2024) | Collateral values |
| Bank assets | >$50bn (2024) | Scale/exposure |
Preview Before You Purchase
Eastern Bank PESTLE Analysis
The preview shown here is the exact Eastern Bank PESTLE Analysis you’ll receive after purchase—fully formatted and ready to use. The layout, content, and structure visible are identical to the downloadable file. No placeholders or teasers—this is the real, finished document. After payment you’ll instantly get this exact file.

Plan Smarter. Present Sharper. Compete Stronger.
Unlock strategic insights with our tailored PESTLE analysis of Eastern Bank—clarifying how political, economic, social, technological, legal, and environmental forces shape its outlook. Ideal for investors, advisors, and planners seeking actionable intelligence. Purchase the full report to access detailed, ready-to-use findings and recommendations.
Political factors
Regulatory policy stability
Banking is highly shaped by federal and state policy direction, affecting capital, liquidity, and consumer rules; U.S. banks reported an aggregate CET1 ratio near 12.8% in 2024, so shifts in capital rules materially affect Eastern Bank’s capital planning. Stability lowers compliance uncertainty and planning costs, while post-election policy swings can reset supervision intensity and stress-testing focus. Monitoring federal rulemaking calendars (federalregister.gov) helps time product launches and adjust risk appetite.
Government lending programs
Public programs like SBA lending, which guarantees up to 85% of 7(a) loans and caps at $5 million per loan, drive small-business credit demand and influence underwriting standards.
Eastern Bank can expand originations by aligning product eligibility, documentation and pricing with SBA 7(a)/504 guarantees and CRA-focused community lending goals.
Changes in program funding or terms can quickly shift volumes and risk mix, so active advocacy helps ensure program design meets local community needs.
Fiscal spending and infrastructure
Federal infrastructure outlays from the 2021 Infrastructure Investment and Jobs Act (IIJA) — $550 billion in new spending — plus ongoing state and local capital plans drive deposits, payments flow and commercial loan demand for banks like Eastern. Infrastructure spending raises contractor financing and corporate treasury needs while supporting municipal bond issuance in the roughly $4 trillion US muni market. Delays or cuts in projects can soften construction pipelines and reduce fee and lending opportunities; Eastern benefits from regional visibility into municipal budgets to underwrite and time lending.
Geopolitical tensions and sanctions
Geopolitical tensions and sanctions amplify screening burdens and correspondent-banking risk; the US SDN list exceeds 6,000 entries as of 2024, forcing continuous OFAC rule updates. Even domestically focused banks face wire-transfer and trade-finance exposure, requiring rapid KYC/OFAC control changes and stronger vendor governance to limit list-management breaches.
- Heightened screening: SDN list >6,000 (2024)
- Exposure: wire transfers & trade finance
- Operational need: rapid KYC/OFAC updates
- Mitigation: robust vendor & list-management governance
Community reinvestment expectations
Political emphasis on financial inclusion drives CRA evaluations and influences Eastern Bank’s branch and lending strategies; the bank reported $40.3 billion in assets in 2024 and highlights community lending as a growth channel. Proposed OCC and CFPB rule changes could shift data collection and assessment criteria, so proactive outreach helps align regulatory outcomes with growth and approval risk.
- CRA focus shapes branch siting and product mix
- Community lending tied to reputational capital and approvals
- Rule changes may broaden data/assessment areas
- Proactive outreach reduces approval risk, supports growth
Regulatory, KYC and SDN risks shape capital planning; CET1 ~12.8%
Federal capital, consumer and OFAC rules—CET1 ~12.8% (2024); SDN list >6,000 (2024)—drive Eastern Bank’s capital planning, KYC and correspondent risk. SBA 7(a) guarantees (up to 85%, $5M) and IIJA $550B suite boost SME and municipal demand; Eastern reported $40.3B assets (2024). Proactive advocacy and rapid compliance updates preserve growth and approval prospects.
| Metric | Value (2024) |
|---|---|
| CET1 | ~12.8% |
| Assets (Eastern) | $40.3B |
| SDN list | >6,000 |
| IIJA new spending | $550B |
| SBA 7(a) guarantee | Up to 85%, $5M cap |
What is included in the product
Detailed Word Document
Examines how Political, Economic, Social, Technological, Environmental, and Legal forces uniquely shape Eastern Bank’s strategic risks and growth opportunities, with each dimension grounded in current data and regional market dynamics. Designed for executives and advisors, it offers forward-looking insights to inform scenario planning, compliance and competitive strategy.
Customizable Excel Spreadsheet
A concise, visually segmented PESTLE summary for Eastern Bank that can be dropped into presentations, edited for local context or business lines, and easily shared across teams to streamline risk discussions and strategic planning.
Economic factors
Interest rate cycle and margin
Eastern Banks net interest margin is highly sensitive to Fed policy and deposit betas; with the federal funds rate around 5.25–5.50% in 2024–25, rapid hikes lifted asset yields but pushed funding costs and deposit competition higher. Deposit betas climbed toward 40–60% during the tightening, compressing NIMs when easing began, which in turn supported credit quality and origination volumes. Active balance-sheet hedging has reduced quarter-to-quarter margin volatility.
Credit cycle and unemployment
Consumer and SME delinquencies closely track labor market health; U.S. unemployment stood at 4.0% in June 2025 (BLS), lifting default risk across retail cards, auto loans and small-business portfolios.
Rising unemployment typically forces higher provisions and credit costs for Eastern Bank, particularly in unsecured and auto segments.
Prudent underwriting, sector diversification and early-warning analytics accelerate workout actions and help contain charge-offs.
Housing market dynamics
Mortgage demand, refi activity and HELOC use track home prices and borrowing costs: S&P CoreLogic Case-Shiller 20-city index rose about 4% year-over-year in 2024 while 30-year fixed rates averaged near 7%, keeping refi share low but primed to jump if rates fall. Tight inventory (roughly 2 months supply nationally in 2024) and high prices have depressed purchase volumes but support collateral values and LTVs. Rate declines historically spur refinancing waves and fee income — refi origination spikes can boost noninterest income by double-digit percentages in months after cuts. Eastern Bank must flex pipeline staffing and recalibrate secondary-market hedging and MSR strategies to capture volatile origination and preserve net interest margins.
Yield curve and liquidity
An inverted yield curve through 2024 compressed spreads and marked-to-market losses in securities portfolios, increasing pressure on net interest margin as the federal funds rate averaged about 5.3% in 2024. Deposit migration into higher-yield alternatives—money market assets near 7 trillion dollars in 2024—strained bank liquidity, making strong ALM, contingency funding plans and granular core deposits critical. Securities duration positioning and unrealized OCI swings materially affect regulatory capital ratios.
- Yield curve: inverted in 2024 — tighter spreads
- Fed funds: ~5.3% (2024)
- MMF assets: ~7T (2024)
- Key mitigants: ALM, contingency funding, granular deposits
- Risk: securities duration & OCI impact on capital
SMB health and regional GDP
Local business formation and consumer spending drive Eastern Bank’s commercial loans and payments volume, supported by its >$50bn asset base (2024). Sector mix—hospitality, healthcare, tech—creates concentration patterns that shape underwriting and loss provisioning. Targeted advisory and treasury services deepen client ties across cycles, while New England’s GDP outperformance versus the US (BEA, 2023) underpins stable deposits and fee income.
- Commercial loans growth tied to local firm formation
- Hospitality/healthcare/tech = sector risk concentration
- Treasury/advisory = stronger client retention
- Regional GDP outperformance supports deposits/fees
Regulatory, KYC and SDN risks shape capital planning; CET1 ~12.8%
Economic backdrop: Fed funds ~5.25–5.50% (2024–25) and inverted curve in 2024 compressed spreads; money‑market assets ≈$7T (2024) raised deposit competition. U.S. unemployment 4.0% (June 2025) pressures retail/SME delinquencies; housing: Case‑Shiller +4% (2024), 30‑yr ~7% kept refi low. Eastern Bank (> $50bn assets, 2024) needs active ALM, hedging and provisioning.
| Metric | Value | Relevance |
|---|---|---|
| Fed funds | 5.25–5.50% | NIM/loan yields |
| Unemployment | 4.0% (Jun 2025) | Credit risk |
| MMF assets | $7T (2024) | Deposit competition |
| Case‑Shiller | +4% (2024) | Collateral values |
| Bank assets | >$50bn (2024) | Scale/exposure |
Preview Before You Purchase
Eastern Bank PESTLE Analysis
The preview shown here is the exact Eastern Bank PESTLE Analysis you’ll receive after purchase—fully formatted and ready to use. The layout, content, and structure visible are identical to the downloadable file. No placeholders or teasers—this is the real, finished document. After payment you’ll instantly get this exact file.
Description
Plan Smarter. Present Sharper. Compete Stronger.
Unlock strategic insights with our tailored PESTLE analysis of Eastern Bank—clarifying how political, economic, social, technological, legal, and environmental forces shape its outlook. Ideal for investors, advisors, and planners seeking actionable intelligence. Purchase the full report to access detailed, ready-to-use findings and recommendations.
Political factors
Regulatory policy stability
Banking is highly shaped by federal and state policy direction, affecting capital, liquidity, and consumer rules; U.S. banks reported an aggregate CET1 ratio near 12.8% in 2024, so shifts in capital rules materially affect Eastern Bank’s capital planning. Stability lowers compliance uncertainty and planning costs, while post-election policy swings can reset supervision intensity and stress-testing focus. Monitoring federal rulemaking calendars (federalregister.gov) helps time product launches and adjust risk appetite.
Government lending programs
Public programs like SBA lending, which guarantees up to 85% of 7(a) loans and caps at $5 million per loan, drive small-business credit demand and influence underwriting standards.
Eastern Bank can expand originations by aligning product eligibility, documentation and pricing with SBA 7(a)/504 guarantees and CRA-focused community lending goals.
Changes in program funding or terms can quickly shift volumes and risk mix, so active advocacy helps ensure program design meets local community needs.
Fiscal spending and infrastructure
Federal infrastructure outlays from the 2021 Infrastructure Investment and Jobs Act (IIJA) — $550 billion in new spending — plus ongoing state and local capital plans drive deposits, payments flow and commercial loan demand for banks like Eastern. Infrastructure spending raises contractor financing and corporate treasury needs while supporting municipal bond issuance in the roughly $4 trillion US muni market. Delays or cuts in projects can soften construction pipelines and reduce fee and lending opportunities; Eastern benefits from regional visibility into municipal budgets to underwrite and time lending.
Geopolitical tensions and sanctions
Geopolitical tensions and sanctions amplify screening burdens and correspondent-banking risk; the US SDN list exceeds 6,000 entries as of 2024, forcing continuous OFAC rule updates. Even domestically focused banks face wire-transfer and trade-finance exposure, requiring rapid KYC/OFAC control changes and stronger vendor governance to limit list-management breaches.
- Heightened screening: SDN list >6,000 (2024)
- Exposure: wire transfers & trade finance
- Operational need: rapid KYC/OFAC updates
- Mitigation: robust vendor & list-management governance
Community reinvestment expectations
Political emphasis on financial inclusion drives CRA evaluations and influences Eastern Bank’s branch and lending strategies; the bank reported $40.3 billion in assets in 2024 and highlights community lending as a growth channel. Proposed OCC and CFPB rule changes could shift data collection and assessment criteria, so proactive outreach helps align regulatory outcomes with growth and approval risk.
- CRA focus shapes branch siting and product mix
- Community lending tied to reputational capital and approvals
- Rule changes may broaden data/assessment areas
- Proactive outreach reduces approval risk, supports growth
Regulatory, KYC and SDN risks shape capital planning; CET1 ~12.8%
Federal capital, consumer and OFAC rules—CET1 ~12.8% (2024); SDN list >6,000 (2024)—drive Eastern Bank’s capital planning, KYC and correspondent risk. SBA 7(a) guarantees (up to 85%, $5M) and IIJA $550B suite boost SME and municipal demand; Eastern reported $40.3B assets (2024). Proactive advocacy and rapid compliance updates preserve growth and approval prospects.
| Metric | Value (2024) |
|---|---|
| CET1 | ~12.8% |
| Assets (Eastern) | $40.3B |
| SDN list | >6,000 |
| IIJA new spending | $550B |
| SBA 7(a) guarantee | Up to 85%, $5M cap |
What is included in the product
Detailed Word Document
Examines how Political, Economic, Social, Technological, Environmental, and Legal forces uniquely shape Eastern Bank’s strategic risks and growth opportunities, with each dimension grounded in current data and regional market dynamics. Designed for executives and advisors, it offers forward-looking insights to inform scenario planning, compliance and competitive strategy.
Customizable Excel Spreadsheet
A concise, visually segmented PESTLE summary for Eastern Bank that can be dropped into presentations, edited for local context or business lines, and easily shared across teams to streamline risk discussions and strategic planning.
Economic factors
Interest rate cycle and margin
Eastern Banks net interest margin is highly sensitive to Fed policy and deposit betas; with the federal funds rate around 5.25–5.50% in 2024–25, rapid hikes lifted asset yields but pushed funding costs and deposit competition higher. Deposit betas climbed toward 40–60% during the tightening, compressing NIMs when easing began, which in turn supported credit quality and origination volumes. Active balance-sheet hedging has reduced quarter-to-quarter margin volatility.
Credit cycle and unemployment
Consumer and SME delinquencies closely track labor market health; U.S. unemployment stood at 4.0% in June 2025 (BLS), lifting default risk across retail cards, auto loans and small-business portfolios.
Rising unemployment typically forces higher provisions and credit costs for Eastern Bank, particularly in unsecured and auto segments.
Prudent underwriting, sector diversification and early-warning analytics accelerate workout actions and help contain charge-offs.
Housing market dynamics
Mortgage demand, refi activity and HELOC use track home prices and borrowing costs: S&P CoreLogic Case-Shiller 20-city index rose about 4% year-over-year in 2024 while 30-year fixed rates averaged near 7%, keeping refi share low but primed to jump if rates fall. Tight inventory (roughly 2 months supply nationally in 2024) and high prices have depressed purchase volumes but support collateral values and LTVs. Rate declines historically spur refinancing waves and fee income — refi origination spikes can boost noninterest income by double-digit percentages in months after cuts. Eastern Bank must flex pipeline staffing and recalibrate secondary-market hedging and MSR strategies to capture volatile origination and preserve net interest margins.
Yield curve and liquidity
An inverted yield curve through 2024 compressed spreads and marked-to-market losses in securities portfolios, increasing pressure on net interest margin as the federal funds rate averaged about 5.3% in 2024. Deposit migration into higher-yield alternatives—money market assets near 7 trillion dollars in 2024—strained bank liquidity, making strong ALM, contingency funding plans and granular core deposits critical. Securities duration positioning and unrealized OCI swings materially affect regulatory capital ratios.
- Yield curve: inverted in 2024 — tighter spreads
- Fed funds: ~5.3% (2024)
- MMF assets: ~7T (2024)
- Key mitigants: ALM, contingency funding, granular deposits
- Risk: securities duration & OCI impact on capital
SMB health and regional GDP
Local business formation and consumer spending drive Eastern Bank’s commercial loans and payments volume, supported by its >$50bn asset base (2024). Sector mix—hospitality, healthcare, tech—creates concentration patterns that shape underwriting and loss provisioning. Targeted advisory and treasury services deepen client ties across cycles, while New England’s GDP outperformance versus the US (BEA, 2023) underpins stable deposits and fee income.
- Commercial loans growth tied to local firm formation
- Hospitality/healthcare/tech = sector risk concentration
- Treasury/advisory = stronger client retention
- Regional GDP outperformance supports deposits/fees
Regulatory, KYC and SDN risks shape capital planning; CET1 ~12.8%
Economic backdrop: Fed funds ~5.25–5.50% (2024–25) and inverted curve in 2024 compressed spreads; money‑market assets ≈$7T (2024) raised deposit competition. U.S. unemployment 4.0% (June 2025) pressures retail/SME delinquencies; housing: Case‑Shiller +4% (2024), 30‑yr ~7% kept refi low. Eastern Bank (> $50bn assets, 2024) needs active ALM, hedging and provisioning.
| Metric | Value | Relevance |
|---|---|---|
| Fed funds | 5.25–5.50% | NIM/loan yields |
| Unemployment | 4.0% (Jun 2025) | Credit risk |
| MMF assets | $7T (2024) | Deposit competition |
| Case‑Shiller | +4% (2024) | Collateral values |
| Bank assets | >$50bn (2024) | Scale/exposure |
Preview Before You Purchase
Eastern Bank PESTLE Analysis
The preview shown here is the exact Eastern Bank PESTLE Analysis you’ll receive after purchase—fully formatted and ready to use. The layout, content, and structure visible are identical to the downloadable file. No placeholders or teasers—this is the real, finished document. After payment you’ll instantly get this exact file.











