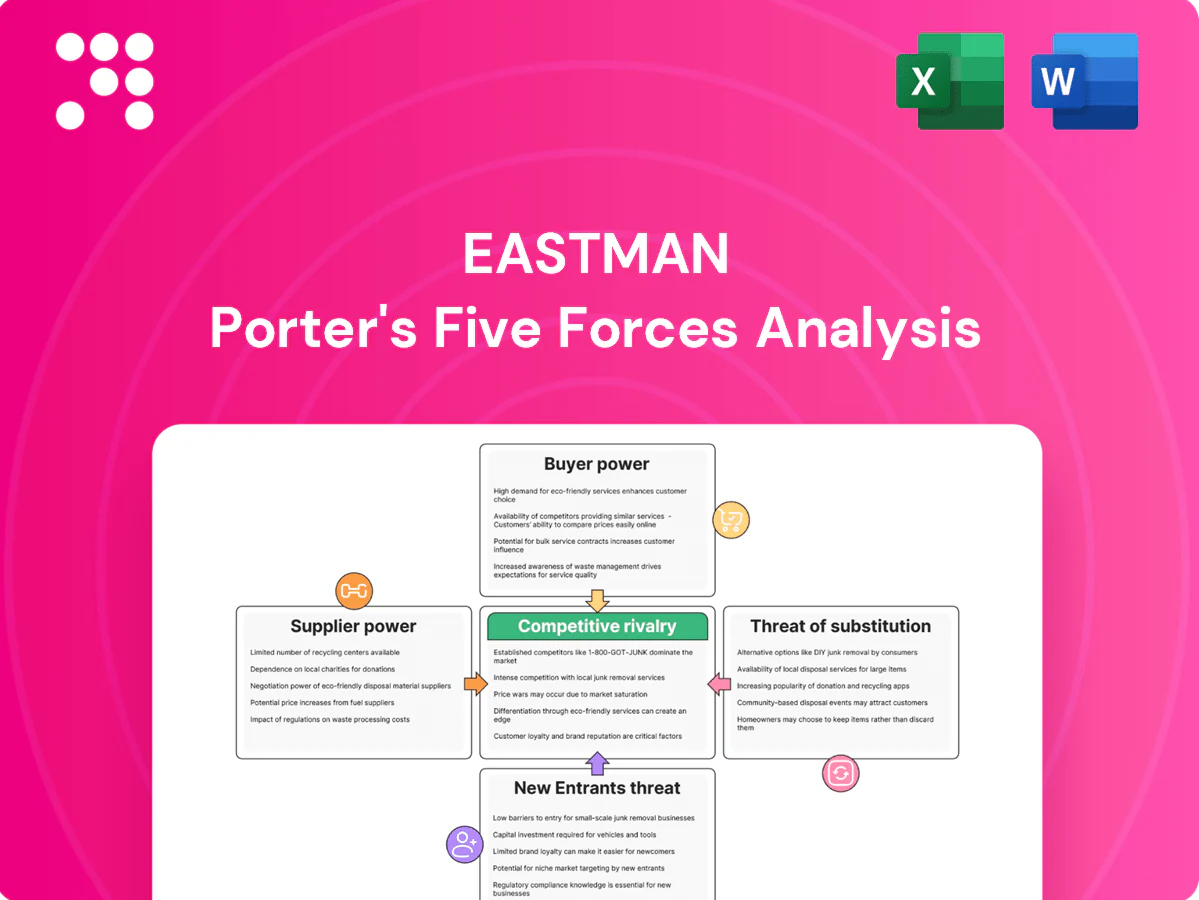
Eastman Porter's Five Forces Analysis

Elevate Your Analysis with the Complete Porter's Five Forces Analysis
Eastman's industry faces moderate supplier power, evolving buyer demands, steady threat of substitutes from advanced materials, and intense rivalry driven by innovation and scale. Regulatory shifts and capital intensity raise barriers to new entrants while sustainability trends reshape competitive advantages. This brief snapshot only scratches the surface — unlock the full Porter's Five Forces Analysis to explore Eastman’s competitive dynamics, market pressures, and strategic advantages in detail.
Suppliers Bargaining Power

Diverse feedstock base tempers leverage
Eastman sources petrochemical, bio-based and specialty inputs, diluting any single supplier’s leverage while operating roughly 47 manufacturing and technical sites across 17 countries (2024). Multiple qualified vendors for many commodities enable dual-sourcing and spot purchases, supported by long-term contracts and hedging to temper price and availability risk. However, critical catalysts and specialty intermediates remain potential pinch points for specific product lines despite this diversification.
Commodity price volatility passes through unevenly
Commodity price volatility passes through unevenly: oil (Brent averaged ~$85/bbl in 2024), gas (US Henry Hub near $3–4/MMBtu in 2024) and NGL linkages give upstream suppliers episodic leverage. Eastman uses surcharges and formula pricing, but pass-through lags can compress EBITDA margins by hundreds of basis points. Backward integration in acetyls and recycling feedstocks reduces exposure, while energy and logistics cost spikes amplify shocks in tight markets.

Switching costs and specs constrain substitution
For catalysts, additives and high-purity intermediates supplier qualification is stringent: in 2024 industry timelines commonly ran 6–18 months and validation/plant trials often incur millions of dollars in costs, raising effective switching costs. Changing vendors requires validation work, plant trials and potential re-certifications, granting approved suppliers measurable bargaining power. Eastman mitigates this by cultivating multi-year partnerships and maintaining qualified second sources to reduce supply risk.

Critical infrastructure and utilities dependencies
Sustainability and compliance elevate supplier influence
Sustainability reporting and traceability requirements, reinforced by the 2024 EU CSRD rollout covering ~50,000 companies, shrink the pool of eligible suppliers for certified bio-based and recycled feedstocks, concentrating leverage in fewer vendors. Eastman’s circular and low-carbon initiatives thus depend on reliable partners, while co-development contracts provide reciprocal commitments to rebalance supplier power.
- Traceability: tighter CSRD rules (2024) reduce supplier options
- Certified inputs: limited vendor base increases supplier clout
- Dependence: Eastman needs consistent partners for circular goals
- Mitigation: co-development contracts share risks and commitments
Moderate supplier power: 47 sites, 6–18m quals
Eastman’s supplier power is moderate: 47 sites across 17 countries and multiple vendors reduce single-supplier leverage, but specialty catalysts, 6–18 month qualification timelines and certified bio/recycled feedstock constraints concentrate power. Commodity shocks (Brent ~85/bbl, HH ~$3–4/MMBtu in 2024) and energy costs (US industrial ~8.5¢/kWh) can compress margins. CSRD rollout (≈50,000 firms in 2024) narrows eligible supplier pools, raising clout for certified vendors.
| Metric | 2024 value | Impact |
|---|---|---|
| Sites/scope | 47 sites, 17 countries | Lower single-supplier risk |
| Brent | ~85/bbl | Input cost volatility |
| Qualification | 6–18 months | High switching cost |
| CSRD | ≈50,000 firms | Fewer certified suppliers |
What is included in the product
 Detailed Word Document
Tailored exclusively for Eastman, this Porter’s Five Forces analysis uncovers competitive intensity, supplier and buyer power, threat of new entrants and substitutes, and highlights disruptive trends and strategic levers to protect market share and profitability.

 Customizable Excel Spreadsheet
One-sheet Eastman Porter’s Five Forces analysis that instantly visualizes and adjusts competitive pressure levels—relieving decision paralysis by turning complex industry dynamics into slide-ready insights for quick strategic action.
Customers Bargaining Power

Large OEMs wield scale-based leverage
Automotive, electronics and packaging majors negotiate aggressively on price and terms, with top OEMs producing about 78 million vehicles in 2024 and the global packaging market at roughly $1.2 trillion, concentrating volume and heightening switching threats and annual bid pressure. Eastman offsets this with differentiated performance, security of supply and service; longer agreements and performance guarantees (multi-year contracts) materially reduce churn.
Customization raises switching costs
Tailored formulations and on-site application support embed Eastman in customer processes, and in 2024 the company highlighted growing long-term specialty partnerships that increase operational interdependence. Requalification, regulatory filings and tooling changes typically add 6–24 months to a supplier switch, making transitions slow and costly. This dynamic reduces buyer power in specialties versus commodities and has boosted uptake of value-in-use pricing where performance can be quantified.

Portfolio breadth enables cross-selling
Serving multiple applications and sites raises share-of-wallet as clients consolidate purchases; in 2024 Eastman leveraged its broad portfolio to deepen account penetration. Bundled solutions help offset unit-price pressure on individual SKUs by locking in volume and margin. Cross-business synergies strengthen bargaining position at renewal, though large buyers can unbundle to restore leverage.

End-market cyclicality sharpens price focus
End-market cyclicality sharpens buyer price focus: downturns in building, consumer durables, or autos raise price sensitivity, with buyers pushing rebates, shorter payment terms, and index-linked pricing; OEMs and distributors have sought discounts often in the mid-single-digit to low-double-digit percent range in recent weak cycles (2023–2024). Inventory destocking during downturns amplifies discount demands, while upcycles shift leverage toward suppliers as service reliability and allocation reduce buyer power.
- Rebates: mid-single to low-double-digit %
- Terms: shorter payment cycles, more index-linking
- Inventory effect: destocking increases discount pressure
- Upcycle: reliability/allocation cuts buyer leverage
Compliance and sustainability requirements
Buyers increasingly require lower-carbon, non-toxic, and recyclable materials; in 2024 demand for certified circular polymers rose industry-wide, reducing buyer power where Eastman uniquely meets specs and raising it where multiple suppliers offer similar certifications. Lifecycle data and take-back programs (Eastman expanded such solutions in 2024) create switching costs and lock in customers. Where alternatives exist, bidding intensity increases and margins compress.
Specialty chemistries and multiyear contracts blunt buyer leverage across autos & packaging
Automotive, electronics and packaging buyers (78M vehicles 2024; $1.2T packaging) exert strong price/term pressure, but Eastman offsets via differentiated specialties, multi‑year contracts and service.
Requalification and regulatory delays (6–24 months) and on‑site support raise switching costs, reducing buyer power in specialties.
Downcycles drive mid‑single to low‑double‑digit rebates; certified circular materials and take‑back programs (expanded 2024) both lock customers and create pockets of commodity competition.
| Metric | 2024 value | Impact on buyer power |
|---|---|---|
| OEM output | 78M vehicles | High concentration, strong leverage |
| Packaging market | $1.2T | Volume bargaining |
| Rebates | Mid‑single to low‑double % | Margin pressure |
| Switch time | 6–24 months | Raises switching costs |
Full Version Awaits
Eastman Porter's Five Forces Analysis
The Eastman Porter's Five Forces Analysis evaluates industry rivalry, supplier power, buyer power, threat of substitution, and barriers to entry for Eastman, offering actionable insights for strategic and investment decisions. This preview shows the exact document you'll receive immediately after purchase—no surprises, no placeholders. The report is professionally formatted and ready for immediate download and use.

Elevate Your Analysis with the Complete Porter's Five Forces Analysis
Eastman's industry faces moderate supplier power, evolving buyer demands, steady threat of substitutes from advanced materials, and intense rivalry driven by innovation and scale. Regulatory shifts and capital intensity raise barriers to new entrants while sustainability trends reshape competitive advantages. This brief snapshot only scratches the surface — unlock the full Porter's Five Forces Analysis to explore Eastman’s competitive dynamics, market pressures, and strategic advantages in detail.
Suppliers Bargaining Power
Diverse feedstock base tempers leverage
Eastman sources petrochemical, bio-based and specialty inputs, diluting any single supplier’s leverage while operating roughly 47 manufacturing and technical sites across 17 countries (2024). Multiple qualified vendors for many commodities enable dual-sourcing and spot purchases, supported by long-term contracts and hedging to temper price and availability risk. However, critical catalysts and specialty intermediates remain potential pinch points for specific product lines despite this diversification.
Commodity price volatility passes through unevenly
Commodity price volatility passes through unevenly: oil (Brent averaged ~$85/bbl in 2024), gas (US Henry Hub near $3–4/MMBtu in 2024) and NGL linkages give upstream suppliers episodic leverage. Eastman uses surcharges and formula pricing, but pass-through lags can compress EBITDA margins by hundreds of basis points. Backward integration in acetyls and recycling feedstocks reduces exposure, while energy and logistics cost spikes amplify shocks in tight markets.
Switching costs and specs constrain substitution
For catalysts, additives and high-purity intermediates supplier qualification is stringent: in 2024 industry timelines commonly ran 6–18 months and validation/plant trials often incur millions of dollars in costs, raising effective switching costs. Changing vendors requires validation work, plant trials and potential re-certifications, granting approved suppliers measurable bargaining power. Eastman mitigates this by cultivating multi-year partnerships and maintaining qualified second sources to reduce supply risk.
Critical infrastructure and utilities dependencies
Sustainability and compliance elevate supplier influence
Sustainability reporting and traceability requirements, reinforced by the 2024 EU CSRD rollout covering ~50,000 companies, shrink the pool of eligible suppliers for certified bio-based and recycled feedstocks, concentrating leverage in fewer vendors. Eastman’s circular and low-carbon initiatives thus depend on reliable partners, while co-development contracts provide reciprocal commitments to rebalance supplier power.
- Traceability: tighter CSRD rules (2024) reduce supplier options
- Certified inputs: limited vendor base increases supplier clout
- Dependence: Eastman needs consistent partners for circular goals
- Mitigation: co-development contracts share risks and commitments
Moderate supplier power: 47 sites, 6–18m quals
Eastman’s supplier power is moderate: 47 sites across 17 countries and multiple vendors reduce single-supplier leverage, but specialty catalysts, 6–18 month qualification timelines and certified bio/recycled feedstock constraints concentrate power. Commodity shocks (Brent ~85/bbl, HH ~$3–4/MMBtu in 2024) and energy costs (US industrial ~8.5¢/kWh) can compress margins. CSRD rollout (≈50,000 firms in 2024) narrows eligible supplier pools, raising clout for certified vendors.
| Metric | 2024 value | Impact |
|---|---|---|
| Sites/scope | 47 sites, 17 countries | Lower single-supplier risk |
| Brent | ~85/bbl | Input cost volatility |
| Qualification | 6–18 months | High switching cost |
| CSRD | ≈50,000 firms | Fewer certified suppliers |
What is included in the product
Detailed Word Document
Tailored exclusively for Eastman, this Porter’s Five Forces analysis uncovers competitive intensity, supplier and buyer power, threat of new entrants and substitutes, and highlights disruptive trends and strategic levers to protect market share and profitability.
Customizable Excel Spreadsheet
One-sheet Eastman Porter’s Five Forces analysis that instantly visualizes and adjusts competitive pressure levels—relieving decision paralysis by turning complex industry dynamics into slide-ready insights for quick strategic action.
Customers Bargaining Power
Large OEMs wield scale-based leverage
Automotive, electronics and packaging majors negotiate aggressively on price and terms, with top OEMs producing about 78 million vehicles in 2024 and the global packaging market at roughly $1.2 trillion, concentrating volume and heightening switching threats and annual bid pressure. Eastman offsets this with differentiated performance, security of supply and service; longer agreements and performance guarantees (multi-year contracts) materially reduce churn.
Customization raises switching costs
Tailored formulations and on-site application support embed Eastman in customer processes, and in 2024 the company highlighted growing long-term specialty partnerships that increase operational interdependence. Requalification, regulatory filings and tooling changes typically add 6–24 months to a supplier switch, making transitions slow and costly. This dynamic reduces buyer power in specialties versus commodities and has boosted uptake of value-in-use pricing where performance can be quantified.
Portfolio breadth enables cross-selling
Serving multiple applications and sites raises share-of-wallet as clients consolidate purchases; in 2024 Eastman leveraged its broad portfolio to deepen account penetration. Bundled solutions help offset unit-price pressure on individual SKUs by locking in volume and margin. Cross-business synergies strengthen bargaining position at renewal, though large buyers can unbundle to restore leverage.
End-market cyclicality sharpens price focus
End-market cyclicality sharpens buyer price focus: downturns in building, consumer durables, or autos raise price sensitivity, with buyers pushing rebates, shorter payment terms, and index-linked pricing; OEMs and distributors have sought discounts often in the mid-single-digit to low-double-digit percent range in recent weak cycles (2023–2024). Inventory destocking during downturns amplifies discount demands, while upcycles shift leverage toward suppliers as service reliability and allocation reduce buyer power.
- Rebates: mid-single to low-double-digit %
- Terms: shorter payment cycles, more index-linking
- Inventory effect: destocking increases discount pressure
- Upcycle: reliability/allocation cuts buyer leverage
Compliance and sustainability requirements
Buyers increasingly require lower-carbon, non-toxic, and recyclable materials; in 2024 demand for certified circular polymers rose industry-wide, reducing buyer power where Eastman uniquely meets specs and raising it where multiple suppliers offer similar certifications. Lifecycle data and take-back programs (Eastman expanded such solutions in 2024) create switching costs and lock in customers. Where alternatives exist, bidding intensity increases and margins compress.
Specialty chemistries and multiyear contracts blunt buyer leverage across autos & packaging
Automotive, electronics and packaging buyers (78M vehicles 2024; $1.2T packaging) exert strong price/term pressure, but Eastman offsets via differentiated specialties, multi‑year contracts and service.
Requalification and regulatory delays (6–24 months) and on‑site support raise switching costs, reducing buyer power in specialties.
Downcycles drive mid‑single to low‑double‑digit rebates; certified circular materials and take‑back programs (expanded 2024) both lock customers and create pockets of commodity competition.
| Metric | 2024 value | Impact on buyer power |
|---|---|---|
| OEM output | 78M vehicles | High concentration, strong leverage |
| Packaging market | $1.2T | Volume bargaining |
| Rebates | Mid‑single to low‑double % | Margin pressure |
| Switch time | 6–24 months | Raises switching costs |
Full Version Awaits
Eastman Porter's Five Forces Analysis
The Eastman Porter's Five Forces Analysis evaluates industry rivalry, supplier power, buyer power, threat of substitution, and barriers to entry for Eastman, offering actionable insights for strategic and investment decisions. This preview shows the exact document you'll receive immediately after purchase—no surprises, no placeholders. The report is professionally formatted and ready for immediate download and use.
Original: $10.00
-65%$10.00
$3.50Description
Elevate Your Analysis with the Complete Porter's Five Forces Analysis
Eastman's industry faces moderate supplier power, evolving buyer demands, steady threat of substitutes from advanced materials, and intense rivalry driven by innovation and scale. Regulatory shifts and capital intensity raise barriers to new entrants while sustainability trends reshape competitive advantages. This brief snapshot only scratches the surface — unlock the full Porter's Five Forces Analysis to explore Eastman’s competitive dynamics, market pressures, and strategic advantages in detail.
Suppliers Bargaining Power
Diverse feedstock base tempers leverage
Eastman sources petrochemical, bio-based and specialty inputs, diluting any single supplier’s leverage while operating roughly 47 manufacturing and technical sites across 17 countries (2024). Multiple qualified vendors for many commodities enable dual-sourcing and spot purchases, supported by long-term contracts and hedging to temper price and availability risk. However, critical catalysts and specialty intermediates remain potential pinch points for specific product lines despite this diversification.
Commodity price volatility passes through unevenly
Commodity price volatility passes through unevenly: oil (Brent averaged ~$85/bbl in 2024), gas (US Henry Hub near $3–4/MMBtu in 2024) and NGL linkages give upstream suppliers episodic leverage. Eastman uses surcharges and formula pricing, but pass-through lags can compress EBITDA margins by hundreds of basis points. Backward integration in acetyls and recycling feedstocks reduces exposure, while energy and logistics cost spikes amplify shocks in tight markets.
Switching costs and specs constrain substitution
For catalysts, additives and high-purity intermediates supplier qualification is stringent: in 2024 industry timelines commonly ran 6–18 months and validation/plant trials often incur millions of dollars in costs, raising effective switching costs. Changing vendors requires validation work, plant trials and potential re-certifications, granting approved suppliers measurable bargaining power. Eastman mitigates this by cultivating multi-year partnerships and maintaining qualified second sources to reduce supply risk.
Critical infrastructure and utilities dependencies
Sustainability and compliance elevate supplier influence
Sustainability reporting and traceability requirements, reinforced by the 2024 EU CSRD rollout covering ~50,000 companies, shrink the pool of eligible suppliers for certified bio-based and recycled feedstocks, concentrating leverage in fewer vendors. Eastman’s circular and low-carbon initiatives thus depend on reliable partners, while co-development contracts provide reciprocal commitments to rebalance supplier power.
- Traceability: tighter CSRD rules (2024) reduce supplier options
- Certified inputs: limited vendor base increases supplier clout
- Dependence: Eastman needs consistent partners for circular goals
- Mitigation: co-development contracts share risks and commitments
Moderate supplier power: 47 sites, 6–18m quals
Eastman’s supplier power is moderate: 47 sites across 17 countries and multiple vendors reduce single-supplier leverage, but specialty catalysts, 6–18 month qualification timelines and certified bio/recycled feedstock constraints concentrate power. Commodity shocks (Brent ~85/bbl, HH ~$3–4/MMBtu in 2024) and energy costs (US industrial ~8.5¢/kWh) can compress margins. CSRD rollout (≈50,000 firms in 2024) narrows eligible supplier pools, raising clout for certified vendors.
| Metric | 2024 value | Impact |
|---|---|---|
| Sites/scope | 47 sites, 17 countries | Lower single-supplier risk |
| Brent | ~85/bbl | Input cost volatility |
| Qualification | 6–18 months | High switching cost |
| CSRD | ≈50,000 firms | Fewer certified suppliers |
What is included in the product
Detailed Word Document
Tailored exclusively for Eastman, this Porter’s Five Forces analysis uncovers competitive intensity, supplier and buyer power, threat of new entrants and substitutes, and highlights disruptive trends and strategic levers to protect market share and profitability.
Customizable Excel Spreadsheet
One-sheet Eastman Porter’s Five Forces analysis that instantly visualizes and adjusts competitive pressure levels—relieving decision paralysis by turning complex industry dynamics into slide-ready insights for quick strategic action.
Customers Bargaining Power
Large OEMs wield scale-based leverage
Automotive, electronics and packaging majors negotiate aggressively on price and terms, with top OEMs producing about 78 million vehicles in 2024 and the global packaging market at roughly $1.2 trillion, concentrating volume and heightening switching threats and annual bid pressure. Eastman offsets this with differentiated performance, security of supply and service; longer agreements and performance guarantees (multi-year contracts) materially reduce churn.
Customization raises switching costs
Tailored formulations and on-site application support embed Eastman in customer processes, and in 2024 the company highlighted growing long-term specialty partnerships that increase operational interdependence. Requalification, regulatory filings and tooling changes typically add 6–24 months to a supplier switch, making transitions slow and costly. This dynamic reduces buyer power in specialties versus commodities and has boosted uptake of value-in-use pricing where performance can be quantified.
Portfolio breadth enables cross-selling
Serving multiple applications and sites raises share-of-wallet as clients consolidate purchases; in 2024 Eastman leveraged its broad portfolio to deepen account penetration. Bundled solutions help offset unit-price pressure on individual SKUs by locking in volume and margin. Cross-business synergies strengthen bargaining position at renewal, though large buyers can unbundle to restore leverage.
End-market cyclicality sharpens price focus
End-market cyclicality sharpens buyer price focus: downturns in building, consumer durables, or autos raise price sensitivity, with buyers pushing rebates, shorter payment terms, and index-linked pricing; OEMs and distributors have sought discounts often in the mid-single-digit to low-double-digit percent range in recent weak cycles (2023–2024). Inventory destocking during downturns amplifies discount demands, while upcycles shift leverage toward suppliers as service reliability and allocation reduce buyer power.
- Rebates: mid-single to low-double-digit %
- Terms: shorter payment cycles, more index-linking
- Inventory effect: destocking increases discount pressure
- Upcycle: reliability/allocation cuts buyer leverage
Compliance and sustainability requirements
Buyers increasingly require lower-carbon, non-toxic, and recyclable materials; in 2024 demand for certified circular polymers rose industry-wide, reducing buyer power where Eastman uniquely meets specs and raising it where multiple suppliers offer similar certifications. Lifecycle data and take-back programs (Eastman expanded such solutions in 2024) create switching costs and lock in customers. Where alternatives exist, bidding intensity increases and margins compress.
Specialty chemistries and multiyear contracts blunt buyer leverage across autos & packaging
Automotive, electronics and packaging buyers (78M vehicles 2024; $1.2T packaging) exert strong price/term pressure, but Eastman offsets via differentiated specialties, multi‑year contracts and service.
Requalification and regulatory delays (6–24 months) and on‑site support raise switching costs, reducing buyer power in specialties.
Downcycles drive mid‑single to low‑double‑digit rebates; certified circular materials and take‑back programs (expanded 2024) both lock customers and create pockets of commodity competition.
| Metric | 2024 value | Impact on buyer power |
|---|---|---|
| OEM output | 78M vehicles | High concentration, strong leverage |
| Packaging market | $1.2T | Volume bargaining |
| Rebates | Mid‑single to low‑double % | Margin pressure |
| Switch time | 6–24 months | Raises switching costs |
Full Version Awaits
Eastman Porter's Five Forces Analysis
The Eastman Porter's Five Forces Analysis evaluates industry rivalry, supplier power, buyer power, threat of substitution, and barriers to entry for Eastman, offering actionable insights for strategic and investment decisions. This preview shows the exact document you'll receive immediately after purchase—no surprises, no placeholders. The report is professionally formatted and ready for immediate download and use.











