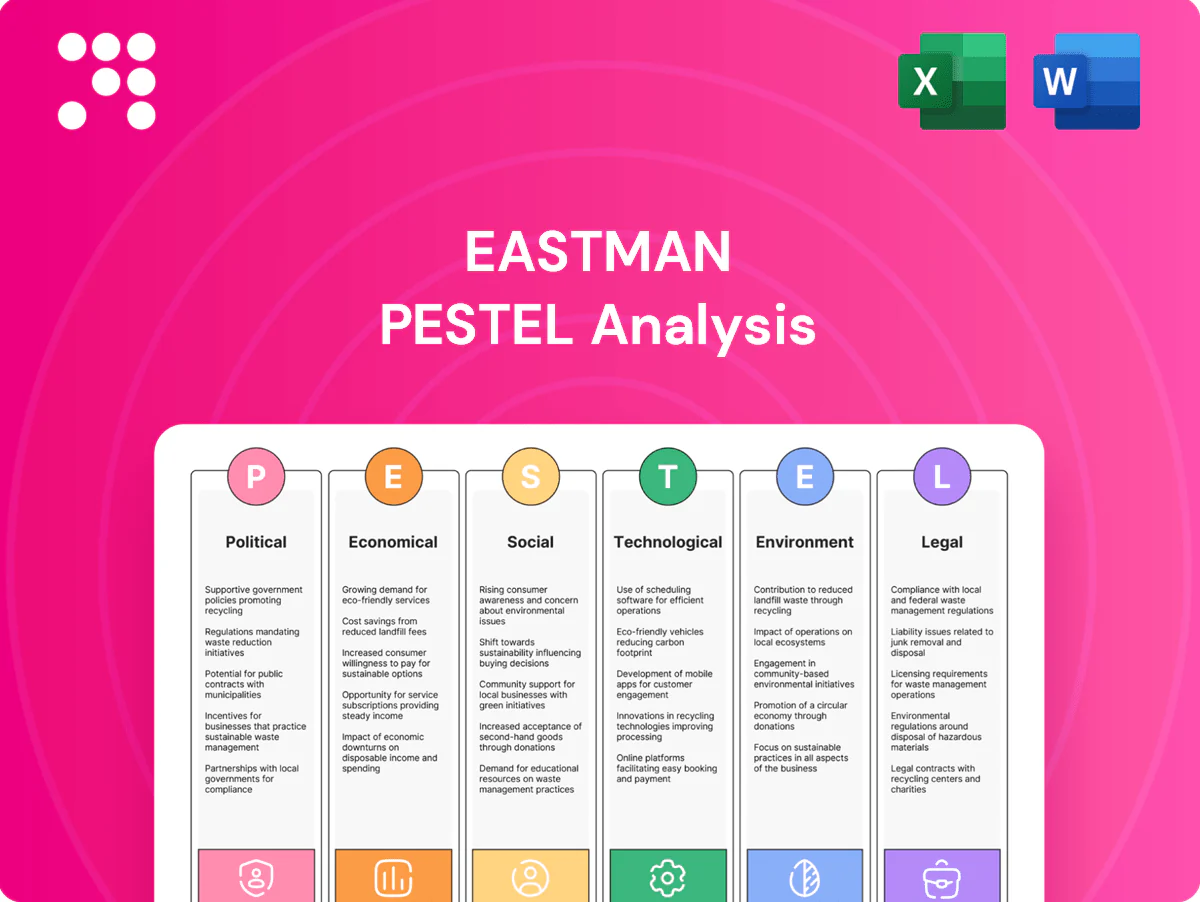
Eastman PESTLE Analysis

Your Competitive Advantage Starts with This Report
Our PESTLE analysis of Eastman reveals how political shifts, economic cycles, regulatory pressures, environmental trends and technological advances converge to reshape its prospects. Actionable, research-backed and investor-ready, it highlights risks and growth levers. Purchase the full report to access the complete breakdown and strategic recommendations.
Political factors

Trade policy volatility
Shifts in tariffs and non-tariff barriers disrupt cross-border flows of specialty chemicals and intermediates, impacting margins and routing. Eastman’s 2024 revenue was about $11.4 billion, and its global footprint exposes pricing, lead-time and logistics to policy shifts. Proactive tariff engineering and localized production reduce shocks, while monitoring WTO disputes and regional agreements remains essential.
Geopolitical tensions
Geopolitical conflicts and sanctions can disrupt energy and feedstock access and key customer industries, threatening Eastman’s supply chains and revenues (Eastman reported $8.28B in revenue and ~13,000 employees in 2023). Export controls on advanced materials can limit end-use markets, so Eastman must diversify suppliers and inventory nodes. Robust scenario planning preserves margins and delivery reliability.

Industrial policy incentives
Government subsidies for decarbonization, recycling and advanced manufacturing—backed by the Inflation Reduction Act’s roughly $369 billion energy and climate investment—can materially lower project costs and improve IRR. Aligning projects with national priorities unlocks grants and tax credits (e.g., production and investment tax credits), and Eastman’s molecular recycling and low‑carbon initiatives map closely to these frameworks. Competitive access hinges on speed and strict eligibility compliance.

Regulatory harmonization gaps
Divergent approval lists (TSCA ~86,000 vs REACH ~22,000 registered substances) and differing labeling rules across 100+ markets complicate formulations and documentation, while REACH registration can take 6+ months to years and cost up to €100k per substance, delaying launches and raising costs for Eastman.
- Modular portfolios
- Adaptable SDS/labels
- Regulatory intelligence reduces rework/non-compliance
Public procurement influence
Government green procurement—public purchasing representing about 14% of EU GDP and roughly $800bn in US federal contracts in FY2023—can shift demand to low-carbon, safe-by-design materials, making verified standards a sales prerequisite. Eastman can capture share by certifying products and product carbon footprints (EPDs, third-party verification) and by engaging early in standard-setting to help shape accessible criteria.
Tariffs, sanctions and climate policy reshape specialty-chemical margins and sourcing
Tariff shifts and trade barriers disrupt specialty-chemical flows and margins; Eastman reported ~$11.4B revenue in 2024, increasing exposure. Geopolitical sanctions risk feedstock and market access, requiring supplier diversification. Climate/subsidy policy (IRA ~$369B) and public procurement (EU ~14% GDP; US federal ~$800B FY2023) create incentives for low‑carbon, certified products.
| Factor | Metric | Impact |
|---|---|---|
| Revenue | $11.4B (2024) | Exposure |
| IRA | $369B | Project subsidy |
What is included in the product
 Detailed Word Document
Explores how external macro-environmental factors uniquely affect Eastman across Political, Economic, Social, Technological, Environmental and Legal dimensions, with data-driven trends, sector-specific examples and forward-looking insights to help executives, investors and strategists identify risks, opportunities and actionable scenarios.

 Customizable Excel Spreadsheet
A concise, visually segmented Eastman PESTLE summary that relieves meeting prep pain by distilling external risks and opportunities into editable, shareable slides or notes for quick team alignment and strategy sessions.
Economic factors

Feedstock price swings
Oil, NGLs and downstream petrochemical derivatives are primary drivers of Eastman’s variable costs; Brent averaged about $88/bbl in H1 2024, feeding through to ethylene/propylene feedstock lines. Volatile feedstock swings compress margins when selling prices lag raw-material moves. Hedging programs and index-linked contracts have reduced earnings volatility for Eastman in recent quarters. A portfolio mix with roughly 60% specialty revenues strengthens pricing power and margin resilience.
End-market cyclicality
End-market cyclicality—transportation, construction and durable goods—drives volume swings for Eastman; global light-vehicle production (~77–79M units in 2024) and US nonresidential construction growth (about 3–4% in 2024) materially affect demand. Eastman’s diversified end-market mix and geographic footprint smooth revenue, while >50% exposure to value-added specialties reduces downside sensitivity. Enhanced S&OP and demand planning improved capacity visibility and inventory turns in 2024.

FX and interest rates
Dollar strength—DXY ~103 at end-2024—erodes Eastman export competitiveness and reduces translated overseas earnings, amplifying FX translation volatility. Elevated policy rates (US fed funds 5.25–5.50% in 2024–25) raise hurdle rates for capex and sustainability projects, tightening NPV for new plants. Financial policy must balance debt maturities and currency exposures, while natural hedges from local sourcing and local‑currency sales mitigate FX risk.

Logistics and supply chain costs
- Ocean rates: ≈ USD 1,200/FEU (2024, Drewry)
- Port/truck variability: raises delivered cost and lead‑time volatility
- Regionalization/nearshoring: +10–15% reliability
- Multi‑sourcing + safety stock: risk mitigation
- Digital ETA/carrier analytics: −15–25% expediting spend
Customer consolidation
Customer consolidation has shifted negotiating power to larger OEMs and converters; in 2024 the top 10 global OEMs accounted for roughly 60% of vehicle production, increasing volume leverage in contracts. Long-term, value-based agreements (3–5+ year terms) can secure share and stabilize margins. Co-development with key customers raises switching costs and embeds Eastman into specs, while superior service and technical support differentiate beyond price.
- Larger OEMs gain bargaining power; top 10 ≈60% vehicle output (2024)
- Long-term value contracts (3–5+ years) secure share
- Co-development increases switching costs
- Service/technical support differentiates beyond price
Tariffs, sanctions and climate policy reshape specialty-chemical margins and sourcing
Feedstock volatility (Brent ≈ $88/bbl H1 2024) drives margins despite hedging; ~60% specialty mix boosts pricing power. Demand tied to cyclical end‑markets (global light‑vehicle ~77–79M 2024); regionalization improved reliability ~10–15%. FX (DXY ≈103 end‑2024) and higher rates (FFR 5.25–5.50%) raise costs and capex hurdles.
| Metric | 2024 Value | Impact |
|---|---|---|
| Brent | $88/bbl | Feedstock cost swing |
| DXY | ≈103 | Translation headwind |
| Ocean rate | $1,200/FEU | Logistics cost |
What You See Is What You Get
Eastman PESTLE Analysis
The Eastman PESTLE Analysis provides a concise review of political, economic, social, technological, legal, and environmental factors affecting Eastman’s strategy and risk profile. The preview shown here is the exact document you’ll receive after purchase—fully formatted and ready to use. Everything displayed is the final file, ready to download immediately after checkout.

Your Competitive Advantage Starts with This Report
Our PESTLE analysis of Eastman reveals how political shifts, economic cycles, regulatory pressures, environmental trends and technological advances converge to reshape its prospects. Actionable, research-backed and investor-ready, it highlights risks and growth levers. Purchase the full report to access the complete breakdown and strategic recommendations.
Political factors
Trade policy volatility
Shifts in tariffs and non-tariff barriers disrupt cross-border flows of specialty chemicals and intermediates, impacting margins and routing. Eastman’s 2024 revenue was about $11.4 billion, and its global footprint exposes pricing, lead-time and logistics to policy shifts. Proactive tariff engineering and localized production reduce shocks, while monitoring WTO disputes and regional agreements remains essential.
Geopolitical tensions
Geopolitical conflicts and sanctions can disrupt energy and feedstock access and key customer industries, threatening Eastman’s supply chains and revenues (Eastman reported $8.28B in revenue and ~13,000 employees in 2023). Export controls on advanced materials can limit end-use markets, so Eastman must diversify suppliers and inventory nodes. Robust scenario planning preserves margins and delivery reliability.
Industrial policy incentives
Government subsidies for decarbonization, recycling and advanced manufacturing—backed by the Inflation Reduction Act’s roughly $369 billion energy and climate investment—can materially lower project costs and improve IRR. Aligning projects with national priorities unlocks grants and tax credits (e.g., production and investment tax credits), and Eastman’s molecular recycling and low‑carbon initiatives map closely to these frameworks. Competitive access hinges on speed and strict eligibility compliance.
Regulatory harmonization gaps
Divergent approval lists (TSCA ~86,000 vs REACH ~22,000 registered substances) and differing labeling rules across 100+ markets complicate formulations and documentation, while REACH registration can take 6+ months to years and cost up to €100k per substance, delaying launches and raising costs for Eastman.
- Modular portfolios
- Adaptable SDS/labels
- Regulatory intelligence reduces rework/non-compliance
Public procurement influence
Government green procurement—public purchasing representing about 14% of EU GDP and roughly $800bn in US federal contracts in FY2023—can shift demand to low-carbon, safe-by-design materials, making verified standards a sales prerequisite. Eastman can capture share by certifying products and product carbon footprints (EPDs, third-party verification) and by engaging early in standard-setting to help shape accessible criteria.
Tariffs, sanctions and climate policy reshape specialty-chemical margins and sourcing
Tariff shifts and trade barriers disrupt specialty-chemical flows and margins; Eastman reported ~$11.4B revenue in 2024, increasing exposure. Geopolitical sanctions risk feedstock and market access, requiring supplier diversification. Climate/subsidy policy (IRA ~$369B) and public procurement (EU ~14% GDP; US federal ~$800B FY2023) create incentives for low‑carbon, certified products.
| Factor | Metric | Impact |
|---|---|---|
| Revenue | $11.4B (2024) | Exposure |
| IRA | $369B | Project subsidy |
What is included in the product
Detailed Word Document
Explores how external macro-environmental factors uniquely affect Eastman across Political, Economic, Social, Technological, Environmental and Legal dimensions, with data-driven trends, sector-specific examples and forward-looking insights to help executives, investors and strategists identify risks, opportunities and actionable scenarios.
Customizable Excel Spreadsheet
A concise, visually segmented Eastman PESTLE summary that relieves meeting prep pain by distilling external risks and opportunities into editable, shareable slides or notes for quick team alignment and strategy sessions.
Economic factors
Feedstock price swings
Oil, NGLs and downstream petrochemical derivatives are primary drivers of Eastman’s variable costs; Brent averaged about $88/bbl in H1 2024, feeding through to ethylene/propylene feedstock lines. Volatile feedstock swings compress margins when selling prices lag raw-material moves. Hedging programs and index-linked contracts have reduced earnings volatility for Eastman in recent quarters. A portfolio mix with roughly 60% specialty revenues strengthens pricing power and margin resilience.
End-market cyclicality
End-market cyclicality—transportation, construction and durable goods—drives volume swings for Eastman; global light-vehicle production (~77–79M units in 2024) and US nonresidential construction growth (about 3–4% in 2024) materially affect demand. Eastman’s diversified end-market mix and geographic footprint smooth revenue, while >50% exposure to value-added specialties reduces downside sensitivity. Enhanced S&OP and demand planning improved capacity visibility and inventory turns in 2024.
FX and interest rates
Dollar strength—DXY ~103 at end-2024—erodes Eastman export competitiveness and reduces translated overseas earnings, amplifying FX translation volatility. Elevated policy rates (US fed funds 5.25–5.50% in 2024–25) raise hurdle rates for capex and sustainability projects, tightening NPV for new plants. Financial policy must balance debt maturities and currency exposures, while natural hedges from local sourcing and local‑currency sales mitigate FX risk.
Logistics and supply chain costs
- Ocean rates: ≈ USD 1,200/FEU (2024, Drewry)
- Port/truck variability: raises delivered cost and lead‑time volatility
- Regionalization/nearshoring: +10–15% reliability
- Multi‑sourcing + safety stock: risk mitigation
- Digital ETA/carrier analytics: −15–25% expediting spend
Customer consolidation
Customer consolidation has shifted negotiating power to larger OEMs and converters; in 2024 the top 10 global OEMs accounted for roughly 60% of vehicle production, increasing volume leverage in contracts. Long-term, value-based agreements (3–5+ year terms) can secure share and stabilize margins. Co-development with key customers raises switching costs and embeds Eastman into specs, while superior service and technical support differentiate beyond price.
- Larger OEMs gain bargaining power; top 10 ≈60% vehicle output (2024)
- Long-term value contracts (3–5+ years) secure share
- Co-development increases switching costs
- Service/technical support differentiates beyond price
Tariffs, sanctions and climate policy reshape specialty-chemical margins and sourcing
Feedstock volatility (Brent ≈ $88/bbl H1 2024) drives margins despite hedging; ~60% specialty mix boosts pricing power. Demand tied to cyclical end‑markets (global light‑vehicle ~77–79M 2024); regionalization improved reliability ~10–15%. FX (DXY ≈103 end‑2024) and higher rates (FFR 5.25–5.50%) raise costs and capex hurdles.
| Metric | 2024 Value | Impact |
|---|---|---|
| Brent | $88/bbl | Feedstock cost swing |
| DXY | ≈103 | Translation headwind |
| Ocean rate | $1,200/FEU | Logistics cost |
What You See Is What You Get
Eastman PESTLE Analysis
The Eastman PESTLE Analysis provides a concise review of political, economic, social, technological, legal, and environmental factors affecting Eastman’s strategy and risk profile. The preview shown here is the exact document you’ll receive after purchase—fully formatted and ready to use. Everything displayed is the final file, ready to download immediately after checkout.
Original: $10.00
-65%$10.00
$3.50Description
Your Competitive Advantage Starts with This Report
Our PESTLE analysis of Eastman reveals how political shifts, economic cycles, regulatory pressures, environmental trends and technological advances converge to reshape its prospects. Actionable, research-backed and investor-ready, it highlights risks and growth levers. Purchase the full report to access the complete breakdown and strategic recommendations.
Political factors
Trade policy volatility
Shifts in tariffs and non-tariff barriers disrupt cross-border flows of specialty chemicals and intermediates, impacting margins and routing. Eastman’s 2024 revenue was about $11.4 billion, and its global footprint exposes pricing, lead-time and logistics to policy shifts. Proactive tariff engineering and localized production reduce shocks, while monitoring WTO disputes and regional agreements remains essential.
Geopolitical tensions
Geopolitical conflicts and sanctions can disrupt energy and feedstock access and key customer industries, threatening Eastman’s supply chains and revenues (Eastman reported $8.28B in revenue and ~13,000 employees in 2023). Export controls on advanced materials can limit end-use markets, so Eastman must diversify suppliers and inventory nodes. Robust scenario planning preserves margins and delivery reliability.
Industrial policy incentives
Government subsidies for decarbonization, recycling and advanced manufacturing—backed by the Inflation Reduction Act’s roughly $369 billion energy and climate investment—can materially lower project costs and improve IRR. Aligning projects with national priorities unlocks grants and tax credits (e.g., production and investment tax credits), and Eastman’s molecular recycling and low‑carbon initiatives map closely to these frameworks. Competitive access hinges on speed and strict eligibility compliance.
Regulatory harmonization gaps
Divergent approval lists (TSCA ~86,000 vs REACH ~22,000 registered substances) and differing labeling rules across 100+ markets complicate formulations and documentation, while REACH registration can take 6+ months to years and cost up to €100k per substance, delaying launches and raising costs for Eastman.
- Modular portfolios
- Adaptable SDS/labels
- Regulatory intelligence reduces rework/non-compliance
Public procurement influence
Government green procurement—public purchasing representing about 14% of EU GDP and roughly $800bn in US federal contracts in FY2023—can shift demand to low-carbon, safe-by-design materials, making verified standards a sales prerequisite. Eastman can capture share by certifying products and product carbon footprints (EPDs, third-party verification) and by engaging early in standard-setting to help shape accessible criteria.
Tariffs, sanctions and climate policy reshape specialty-chemical margins and sourcing
Tariff shifts and trade barriers disrupt specialty-chemical flows and margins; Eastman reported ~$11.4B revenue in 2024, increasing exposure. Geopolitical sanctions risk feedstock and market access, requiring supplier diversification. Climate/subsidy policy (IRA ~$369B) and public procurement (EU ~14% GDP; US federal ~$800B FY2023) create incentives for low‑carbon, certified products.
| Factor | Metric | Impact |
|---|---|---|
| Revenue | $11.4B (2024) | Exposure |
| IRA | $369B | Project subsidy |
What is included in the product
Detailed Word Document
Explores how external macro-environmental factors uniquely affect Eastman across Political, Economic, Social, Technological, Environmental and Legal dimensions, with data-driven trends, sector-specific examples and forward-looking insights to help executives, investors and strategists identify risks, opportunities and actionable scenarios.
Customizable Excel Spreadsheet
A concise, visually segmented Eastman PESTLE summary that relieves meeting prep pain by distilling external risks and opportunities into editable, shareable slides or notes for quick team alignment and strategy sessions.
Economic factors
Feedstock price swings
Oil, NGLs and downstream petrochemical derivatives are primary drivers of Eastman’s variable costs; Brent averaged about $88/bbl in H1 2024, feeding through to ethylene/propylene feedstock lines. Volatile feedstock swings compress margins when selling prices lag raw-material moves. Hedging programs and index-linked contracts have reduced earnings volatility for Eastman in recent quarters. A portfolio mix with roughly 60% specialty revenues strengthens pricing power and margin resilience.
End-market cyclicality
End-market cyclicality—transportation, construction and durable goods—drives volume swings for Eastman; global light-vehicle production (~77–79M units in 2024) and US nonresidential construction growth (about 3–4% in 2024) materially affect demand. Eastman’s diversified end-market mix and geographic footprint smooth revenue, while >50% exposure to value-added specialties reduces downside sensitivity. Enhanced S&OP and demand planning improved capacity visibility and inventory turns in 2024.
FX and interest rates
Dollar strength—DXY ~103 at end-2024—erodes Eastman export competitiveness and reduces translated overseas earnings, amplifying FX translation volatility. Elevated policy rates (US fed funds 5.25–5.50% in 2024–25) raise hurdle rates for capex and sustainability projects, tightening NPV for new plants. Financial policy must balance debt maturities and currency exposures, while natural hedges from local sourcing and local‑currency sales mitigate FX risk.
Logistics and supply chain costs
- Ocean rates: ≈ USD 1,200/FEU (2024, Drewry)
- Port/truck variability: raises delivered cost and lead‑time volatility
- Regionalization/nearshoring: +10–15% reliability
- Multi‑sourcing + safety stock: risk mitigation
- Digital ETA/carrier analytics: −15–25% expediting spend
Customer consolidation
Customer consolidation has shifted negotiating power to larger OEMs and converters; in 2024 the top 10 global OEMs accounted for roughly 60% of vehicle production, increasing volume leverage in contracts. Long-term, value-based agreements (3–5+ year terms) can secure share and stabilize margins. Co-development with key customers raises switching costs and embeds Eastman into specs, while superior service and technical support differentiate beyond price.
- Larger OEMs gain bargaining power; top 10 ≈60% vehicle output (2024)
- Long-term value contracts (3–5+ years) secure share
- Co-development increases switching costs
- Service/technical support differentiates beyond price
Tariffs, sanctions and climate policy reshape specialty-chemical margins and sourcing
Feedstock volatility (Brent ≈ $88/bbl H1 2024) drives margins despite hedging; ~60% specialty mix boosts pricing power. Demand tied to cyclical end‑markets (global light‑vehicle ~77–79M 2024); regionalization improved reliability ~10–15%. FX (DXY ≈103 end‑2024) and higher rates (FFR 5.25–5.50%) raise costs and capex hurdles.
| Metric | 2024 Value | Impact |
|---|---|---|
| Brent | $88/bbl | Feedstock cost swing |
| DXY | ≈103 | Translation headwind |
| Ocean rate | $1,200/FEU | Logistics cost |
What You See Is What You Get
Eastman PESTLE Analysis
The Eastman PESTLE Analysis provides a concise review of political, economic, social, technological, legal, and environmental factors affecting Eastman’s strategy and risk profile. The preview shown here is the exact document you’ll receive after purchase—fully formatted and ready to use. Everything displayed is the final file, ready to download immediately after checkout.











