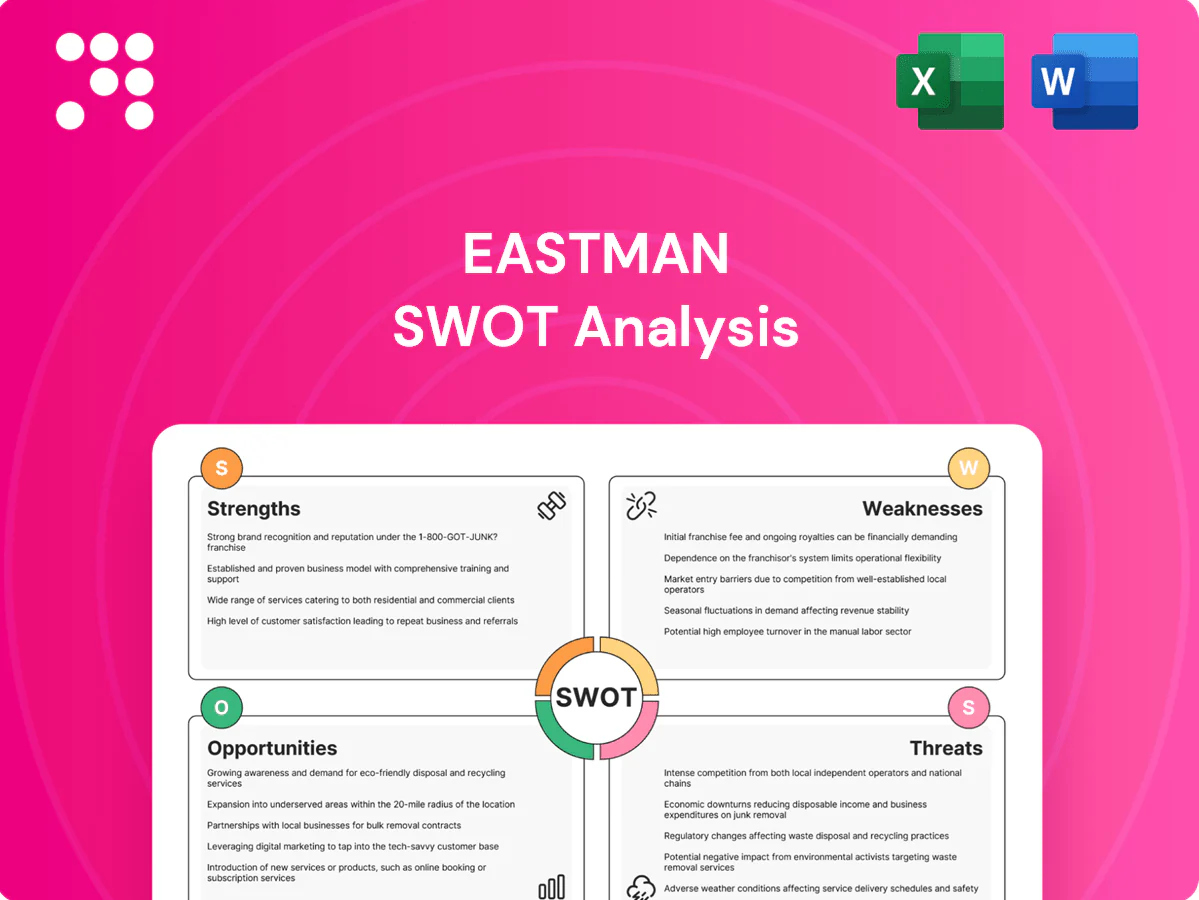
Eastman SWOT Analysis

Elevate Your Analysis with the Complete SWOT Report
Eastman’s strategic position blends specialty materials leadership with exposure to commodity cycles and regulatory risks; our preview highlights key strengths, weaknesses, opportunities, and threats. For actionable insights, financial context, and strategic recommendations, purchase the full SWOT analysis. Receive a professionally formatted Word report plus an editable Excel matrix to plan, pitch, or invest with confidence.
Strengths

Diversified specialty portfolio
Eastman’s diversified specialty portfolio serving transportation, construction, durable goods, health, and agriculture spreads risk and revenue, supporting roughly $10 billion in 2024 net sales. Specialty positioning yields higher margins than commodities, strengthening pricing power. Cross-industry applications drive resilient demand and customer stickiness.
Deep materials science R&D
Deep materials science R&D—Eastman’s molecular and materials expertise drives differentiated performance, underpinning specialty margins and customer-specific formulations. Collaborative application development with major customers accelerates adoption and supported 2024 wins that expanded specialty mix. Strong IP and know-how create tangible switching costs across supply chains. A steady innovation cadence funds premium mix and reinvestment into growth.

Global manufacturing footprint
Eastman’s global manufacturing footprint—over 50 production, blending and R&D sites across about 17 countries, serving customers in more than 100 countries—supports reliable supply, lowers lead times through proximity to customers for tailored service, drives scale-related cost efficiencies and product consistency, and provides direct access to high-growth regions such as APAC and Latin America.

Sustainability-driven solutions
Eastman emphasizes high-performance, lower-footprint materials that support customers meeting ESG and regulatory targets; in 2024 Eastman reported roughly $11.1B in net sales while accelerating circular solutions and molecular recycling initiatives.
- Sustainability-led portfolio drives brand equity
- Enables customers' ESG compliance and product decarbonization
- Aligns with long-term market shift to circularity
Integrated operations and reliability
Vertical and process integration at Eastman tightens cost control and product quality through in-house feedstock conversion and standardized process steps, while operational excellence—rigorous maintenance and process control—supports high uptime and reliable delivery; integration also cushions feedstock and logistics volatility, and demonstrated reliability reinforces long-term customer relationships.
- Cost control via vertical integration
- High uptime from operational excellence
- Reduced feedstock/logistics exposure
- Stronger long-term customer ties
Specialty materials: $11.1B 2024 sales, >50 sites (~17 countries)
Eastman’s diversified specialty portfolio generated $11.1B net sales in 2024, driving higher margins and resilient multisector demand. Deep materials R&D and IP enable customer-specific, higher-value formulations and molecular recycling wins. Global footprint (>50 sites, ~17 countries) and vertical integration secure supply, cost control and ESG-aligned solutions.
| Metric | 2024 |
|---|---|
| Net sales | $11.1B |
| Sites / Countries | >50 / ~17 |
| Customers reach | 100+ countries |
What is included in the product
 Detailed Word Document
Provides a concise strategic overview of Eastman by outlining key strengths, weaknesses, opportunities, and threats, assessing internal capabilities, market position, innovation and sustainability initiatives, supply‑chain and regulatory risks, and competitive pressures shaping future growth.

 Customizable Excel Spreadsheet
Provides a concise, Eastman-specific SWOT matrix for fast, visual strategy alignment, helping teams quickly identify and address core pain points across operations and portfolio decisions.
Weaknesses

Exposure to cyclical end-markets
Exposure to cyclical end-markets such as construction, automotive and durables leaves Eastman vulnerable to macro swings; softening housing and auto production drove revenue sensitivity, with 2024 net sales of about $11.2 billion and adjusted EBITDA margin near 16%, highlighting margin compression in downturns. Volume and adverse mix shifts can cut margins by several hundred basis points during contractions. Planning complexity rises as demand variability forces frequent SKU, workforce and capital adjustments, making inventory and capacity utilization optimization difficult.
Feedstock and energy sensitivity
Eastman’s reliance on hydrocarbon-based feedstocks makes its margins highly sensitive to input-price swings; ethylene and propylene spot markets experienced swings exceeding 30% in 2023–24, frequently outpacing contract repricing. Rapid spikes compress margins because selling-price adjustments lag procurement cost increases, and recovery often trails by quarters. Hedging programs reduce but do not eliminate exposure, leaving residual volatility risk for earnings.

High capital and R&D intensity
Specialty assets and innovation demand sustained spend, with Eastman reporting about $1.07 billion of capital expenditures and roughly $174 million of R&D expense in 2023, driving long-duration investments. New technologies and plants often have multi-year paybacks, compressing near-term cash returns. Capital allocation trade-offs limit balance-sheet flexibility while execution risk rises on large-scale projects.

Regulatory and environmental burden
Compliance in specialty chemicals is complex and costly for Eastman, driving higher operating expenses and capital investment to meet evolving REACH, TSCA and regional standards.
Evolving rules can force reformulation or market exits, raising R&D and commercialization costs and risking lost sales in regulated segments.
Legacy sites create remediation obligations and growing disclosure demands increase overhead and stakeholder scrutiny.
- Regulatory-driven capex and OPEX pressure
- Reformulation and market-exit risk
- Legacy remediation liabilities
- Rising disclosure and compliance overhead
Portfolio complexity
Eastman’s broad SKU base and multi-application portfolio drive operational complexity, with product life-cycle management straining R&D and supply-chain resources; Eastman reported roughly $10.6 billion in 2024 revenue and ~14,300 employees, amplifying coordination challenges. The company faces subscale niche risks that can dilute focus and obscure true profitability by segment, complicating margin analysis and capital allocation.
- High SKU count increases OPEX
- Product life-cycle costs strain resources
- Subscale niches dilute focus
- Segment complexity hides real margins
Cyclical end-markets and hydrocarbon exposure drive volatile margins amid heavy capex
Concentrated exposure to cyclical end-markets and hydrocarbon feedstocks drives earnings volatility; 2024 net sales ~$11.2B and adjusted EBITDA ~16% showed margin sensitivity. Heavy capex/R&D (capex ~$1.07B, R&D ~$174M in 2023) and compliance/remediation obligations strain cash and execution capacity. Broad SKU base and segment complexity increase OPEX and obscure true margins.
| Metric | Value |
|---|---|
| 2024 Net Sales | $11.2B |
| Adj. EBITDA Margin | ~16% |
| 2023 CapEx | $1.07B |
| 2023 R&D | $174M |
| Employees (2024) | ~14,300 |
Preview the Actual Deliverable
Eastman SWOT Analysis
This is the actual Eastman SWOT analysis document you’ll receive upon purchase—no surprises, just professional quality. The preview below is taken directly from the full report and reflects the same structured, editable file. Buy now to unlock the complete, detailed version for immediate download.

Elevate Your Analysis with the Complete SWOT Report
Eastman’s strategic position blends specialty materials leadership with exposure to commodity cycles and regulatory risks; our preview highlights key strengths, weaknesses, opportunities, and threats. For actionable insights, financial context, and strategic recommendations, purchase the full SWOT analysis. Receive a professionally formatted Word report plus an editable Excel matrix to plan, pitch, or invest with confidence.
Strengths
Diversified specialty portfolio
Eastman’s diversified specialty portfolio serving transportation, construction, durable goods, health, and agriculture spreads risk and revenue, supporting roughly $10 billion in 2024 net sales. Specialty positioning yields higher margins than commodities, strengthening pricing power. Cross-industry applications drive resilient demand and customer stickiness.
Deep materials science R&D
Deep materials science R&D—Eastman’s molecular and materials expertise drives differentiated performance, underpinning specialty margins and customer-specific formulations. Collaborative application development with major customers accelerates adoption and supported 2024 wins that expanded specialty mix. Strong IP and know-how create tangible switching costs across supply chains. A steady innovation cadence funds premium mix and reinvestment into growth.
Global manufacturing footprint
Eastman’s global manufacturing footprint—over 50 production, blending and R&D sites across about 17 countries, serving customers in more than 100 countries—supports reliable supply, lowers lead times through proximity to customers for tailored service, drives scale-related cost efficiencies and product consistency, and provides direct access to high-growth regions such as APAC and Latin America.
Sustainability-driven solutions
Eastman emphasizes high-performance, lower-footprint materials that support customers meeting ESG and regulatory targets; in 2024 Eastman reported roughly $11.1B in net sales while accelerating circular solutions and molecular recycling initiatives.
- Sustainability-led portfolio drives brand equity
- Enables customers' ESG compliance and product decarbonization
- Aligns with long-term market shift to circularity
Integrated operations and reliability
Vertical and process integration at Eastman tightens cost control and product quality through in-house feedstock conversion and standardized process steps, while operational excellence—rigorous maintenance and process control—supports high uptime and reliable delivery; integration also cushions feedstock and logistics volatility, and demonstrated reliability reinforces long-term customer relationships.
- Cost control via vertical integration
- High uptime from operational excellence
- Reduced feedstock/logistics exposure
- Stronger long-term customer ties
Specialty materials: $11.1B 2024 sales, >50 sites (~17 countries)
Eastman’s diversified specialty portfolio generated $11.1B net sales in 2024, driving higher margins and resilient multisector demand. Deep materials R&D and IP enable customer-specific, higher-value formulations and molecular recycling wins. Global footprint (>50 sites, ~17 countries) and vertical integration secure supply, cost control and ESG-aligned solutions.
| Metric | 2024 |
|---|---|
| Net sales | $11.1B |
| Sites / Countries | >50 / ~17 |
| Customers reach | 100+ countries |
What is included in the product
Detailed Word Document
Provides a concise strategic overview of Eastman by outlining key strengths, weaknesses, opportunities, and threats, assessing internal capabilities, market position, innovation and sustainability initiatives, supply‑chain and regulatory risks, and competitive pressures shaping future growth.
Customizable Excel Spreadsheet
Provides a concise, Eastman-specific SWOT matrix for fast, visual strategy alignment, helping teams quickly identify and address core pain points across operations and portfolio decisions.
Weaknesses
Exposure to cyclical end-markets
Exposure to cyclical end-markets such as construction, automotive and durables leaves Eastman vulnerable to macro swings; softening housing and auto production drove revenue sensitivity, with 2024 net sales of about $11.2 billion and adjusted EBITDA margin near 16%, highlighting margin compression in downturns. Volume and adverse mix shifts can cut margins by several hundred basis points during contractions. Planning complexity rises as demand variability forces frequent SKU, workforce and capital adjustments, making inventory and capacity utilization optimization difficult.
Feedstock and energy sensitivity
Eastman’s reliance on hydrocarbon-based feedstocks makes its margins highly sensitive to input-price swings; ethylene and propylene spot markets experienced swings exceeding 30% in 2023–24, frequently outpacing contract repricing. Rapid spikes compress margins because selling-price adjustments lag procurement cost increases, and recovery often trails by quarters. Hedging programs reduce but do not eliminate exposure, leaving residual volatility risk for earnings.
High capital and R&D intensity
Specialty assets and innovation demand sustained spend, with Eastman reporting about $1.07 billion of capital expenditures and roughly $174 million of R&D expense in 2023, driving long-duration investments. New technologies and plants often have multi-year paybacks, compressing near-term cash returns. Capital allocation trade-offs limit balance-sheet flexibility while execution risk rises on large-scale projects.
Regulatory and environmental burden
Compliance in specialty chemicals is complex and costly for Eastman, driving higher operating expenses and capital investment to meet evolving REACH, TSCA and regional standards.
Evolving rules can force reformulation or market exits, raising R&D and commercialization costs and risking lost sales in regulated segments.
Legacy sites create remediation obligations and growing disclosure demands increase overhead and stakeholder scrutiny.
- Regulatory-driven capex and OPEX pressure
- Reformulation and market-exit risk
- Legacy remediation liabilities
- Rising disclosure and compliance overhead
Portfolio complexity
Eastman’s broad SKU base and multi-application portfolio drive operational complexity, with product life-cycle management straining R&D and supply-chain resources; Eastman reported roughly $10.6 billion in 2024 revenue and ~14,300 employees, amplifying coordination challenges. The company faces subscale niche risks that can dilute focus and obscure true profitability by segment, complicating margin analysis and capital allocation.
- High SKU count increases OPEX
- Product life-cycle costs strain resources
- Subscale niches dilute focus
- Segment complexity hides real margins
Cyclical end-markets and hydrocarbon exposure drive volatile margins amid heavy capex
Concentrated exposure to cyclical end-markets and hydrocarbon feedstocks drives earnings volatility; 2024 net sales ~$11.2B and adjusted EBITDA ~16% showed margin sensitivity. Heavy capex/R&D (capex ~$1.07B, R&D ~$174M in 2023) and compliance/remediation obligations strain cash and execution capacity. Broad SKU base and segment complexity increase OPEX and obscure true margins.
| Metric | Value |
|---|---|
| 2024 Net Sales | $11.2B |
| Adj. EBITDA Margin | ~16% |
| 2023 CapEx | $1.07B |
| 2023 R&D | $174M |
| Employees (2024) | ~14,300 |
Preview the Actual Deliverable
Eastman SWOT Analysis
This is the actual Eastman SWOT analysis document you’ll receive upon purchase—no surprises, just professional quality. The preview below is taken directly from the full report and reflects the same structured, editable file. Buy now to unlock the complete, detailed version for immediate download.
Original: $10.00
-65%$10.00
$3.50Description
Elevate Your Analysis with the Complete SWOT Report
Eastman’s strategic position blends specialty materials leadership with exposure to commodity cycles and regulatory risks; our preview highlights key strengths, weaknesses, opportunities, and threats. For actionable insights, financial context, and strategic recommendations, purchase the full SWOT analysis. Receive a professionally formatted Word report plus an editable Excel matrix to plan, pitch, or invest with confidence.
Strengths
Diversified specialty portfolio
Eastman’s diversified specialty portfolio serving transportation, construction, durable goods, health, and agriculture spreads risk and revenue, supporting roughly $10 billion in 2024 net sales. Specialty positioning yields higher margins than commodities, strengthening pricing power. Cross-industry applications drive resilient demand and customer stickiness.
Deep materials science R&D
Deep materials science R&D—Eastman’s molecular and materials expertise drives differentiated performance, underpinning specialty margins and customer-specific formulations. Collaborative application development with major customers accelerates adoption and supported 2024 wins that expanded specialty mix. Strong IP and know-how create tangible switching costs across supply chains. A steady innovation cadence funds premium mix and reinvestment into growth.
Global manufacturing footprint
Eastman’s global manufacturing footprint—over 50 production, blending and R&D sites across about 17 countries, serving customers in more than 100 countries—supports reliable supply, lowers lead times through proximity to customers for tailored service, drives scale-related cost efficiencies and product consistency, and provides direct access to high-growth regions such as APAC and Latin America.
Sustainability-driven solutions
Eastman emphasizes high-performance, lower-footprint materials that support customers meeting ESG and regulatory targets; in 2024 Eastman reported roughly $11.1B in net sales while accelerating circular solutions and molecular recycling initiatives.
- Sustainability-led portfolio drives brand equity
- Enables customers' ESG compliance and product decarbonization
- Aligns with long-term market shift to circularity
Integrated operations and reliability
Vertical and process integration at Eastman tightens cost control and product quality through in-house feedstock conversion and standardized process steps, while operational excellence—rigorous maintenance and process control—supports high uptime and reliable delivery; integration also cushions feedstock and logistics volatility, and demonstrated reliability reinforces long-term customer relationships.
- Cost control via vertical integration
- High uptime from operational excellence
- Reduced feedstock/logistics exposure
- Stronger long-term customer ties
Specialty materials: $11.1B 2024 sales, >50 sites (~17 countries)
Eastman’s diversified specialty portfolio generated $11.1B net sales in 2024, driving higher margins and resilient multisector demand. Deep materials R&D and IP enable customer-specific, higher-value formulations and molecular recycling wins. Global footprint (>50 sites, ~17 countries) and vertical integration secure supply, cost control and ESG-aligned solutions.
| Metric | 2024 |
|---|---|
| Net sales | $11.1B |
| Sites / Countries | >50 / ~17 |
| Customers reach | 100+ countries |
What is included in the product
Detailed Word Document
Provides a concise strategic overview of Eastman by outlining key strengths, weaknesses, opportunities, and threats, assessing internal capabilities, market position, innovation and sustainability initiatives, supply‑chain and regulatory risks, and competitive pressures shaping future growth.
Customizable Excel Spreadsheet
Provides a concise, Eastman-specific SWOT matrix for fast, visual strategy alignment, helping teams quickly identify and address core pain points across operations and portfolio decisions.
Weaknesses
Exposure to cyclical end-markets
Exposure to cyclical end-markets such as construction, automotive and durables leaves Eastman vulnerable to macro swings; softening housing and auto production drove revenue sensitivity, with 2024 net sales of about $11.2 billion and adjusted EBITDA margin near 16%, highlighting margin compression in downturns. Volume and adverse mix shifts can cut margins by several hundred basis points during contractions. Planning complexity rises as demand variability forces frequent SKU, workforce and capital adjustments, making inventory and capacity utilization optimization difficult.
Feedstock and energy sensitivity
Eastman’s reliance on hydrocarbon-based feedstocks makes its margins highly sensitive to input-price swings; ethylene and propylene spot markets experienced swings exceeding 30% in 2023–24, frequently outpacing contract repricing. Rapid spikes compress margins because selling-price adjustments lag procurement cost increases, and recovery often trails by quarters. Hedging programs reduce but do not eliminate exposure, leaving residual volatility risk for earnings.
High capital and R&D intensity
Specialty assets and innovation demand sustained spend, with Eastman reporting about $1.07 billion of capital expenditures and roughly $174 million of R&D expense in 2023, driving long-duration investments. New technologies and plants often have multi-year paybacks, compressing near-term cash returns. Capital allocation trade-offs limit balance-sheet flexibility while execution risk rises on large-scale projects.
Regulatory and environmental burden
Compliance in specialty chemicals is complex and costly for Eastman, driving higher operating expenses and capital investment to meet evolving REACH, TSCA and regional standards.
Evolving rules can force reformulation or market exits, raising R&D and commercialization costs and risking lost sales in regulated segments.
Legacy sites create remediation obligations and growing disclosure demands increase overhead and stakeholder scrutiny.
- Regulatory-driven capex and OPEX pressure
- Reformulation and market-exit risk
- Legacy remediation liabilities
- Rising disclosure and compliance overhead
Portfolio complexity
Eastman’s broad SKU base and multi-application portfolio drive operational complexity, with product life-cycle management straining R&D and supply-chain resources; Eastman reported roughly $10.6 billion in 2024 revenue and ~14,300 employees, amplifying coordination challenges. The company faces subscale niche risks that can dilute focus and obscure true profitability by segment, complicating margin analysis and capital allocation.
- High SKU count increases OPEX
- Product life-cycle costs strain resources
- Subscale niches dilute focus
- Segment complexity hides real margins
Cyclical end-markets and hydrocarbon exposure drive volatile margins amid heavy capex
Concentrated exposure to cyclical end-markets and hydrocarbon feedstocks drives earnings volatility; 2024 net sales ~$11.2B and adjusted EBITDA ~16% showed margin sensitivity. Heavy capex/R&D (capex ~$1.07B, R&D ~$174M in 2023) and compliance/remediation obligations strain cash and execution capacity. Broad SKU base and segment complexity increase OPEX and obscure true margins.
| Metric | Value |
|---|---|
| 2024 Net Sales | $11.2B |
| Adj. EBITDA Margin | ~16% |
| 2023 CapEx | $1.07B |
| 2023 R&D | $174M |
| Employees (2024) | ~14,300 |
Preview the Actual Deliverable
Eastman SWOT Analysis
This is the actual Eastman SWOT analysis document you’ll receive upon purchase—no surprises, just professional quality. The preview below is taken directly from the full report and reflects the same structured, editable file. Buy now to unlock the complete, detailed version for immediate download.











