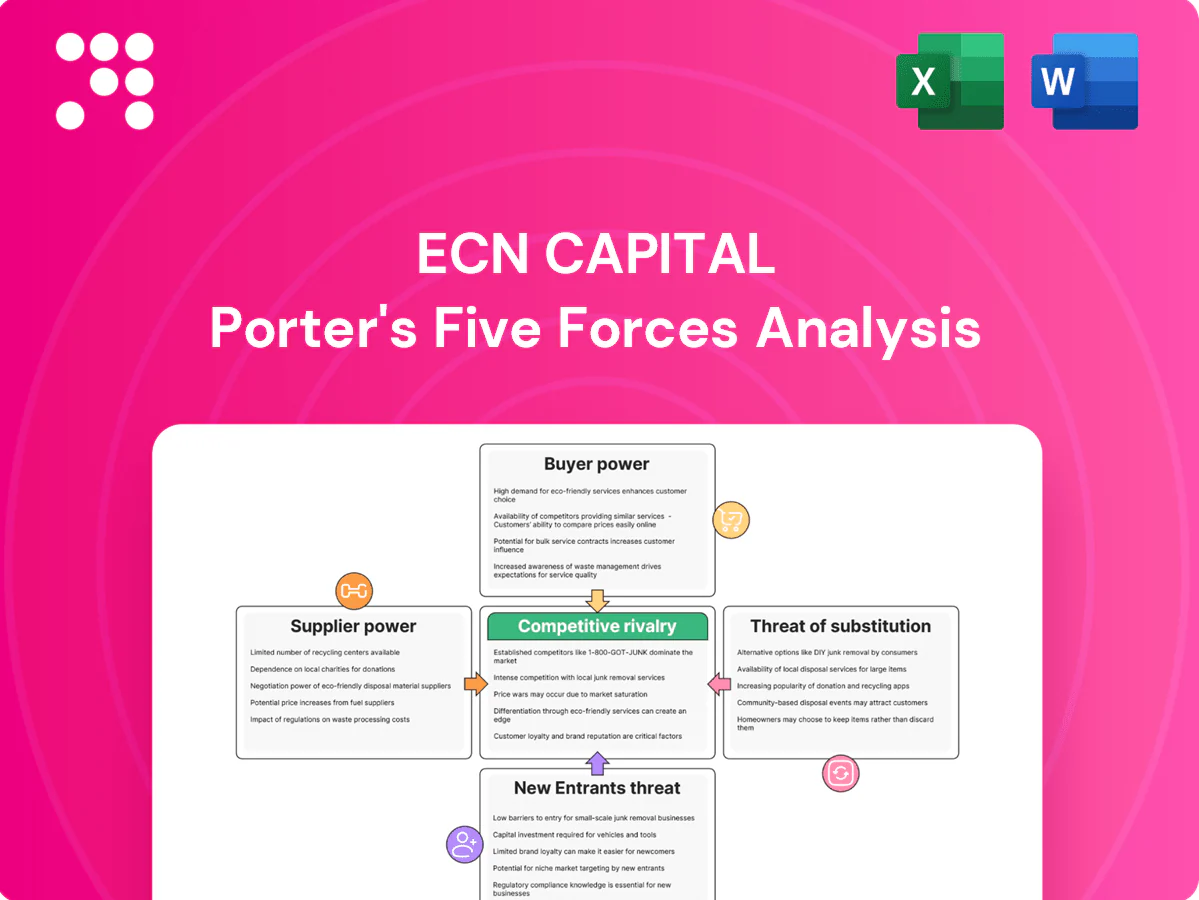
ECN Capital Porter's Five Forces Analysis

A Must-Have Tool for Decision-Makers
This concise Porter's Five Forces snapshot highlights ECN Capital's competitive pressures—buyer/supplier power, substitutes, entrant threats, and rivalry—and what they mean for margins and growth. Want the full force-by-force ratings, visuals, and strategic implications tailored to ECN Capital? Unlock the complete analysis for consultant-grade insights ready for investment and planning.
Suppliers Bargaining Power

Concentrated funding sources
As of 2024 ECN relies heavily on warehouse lines, whole-loan buyers and ABS investors to fund originations and servicing platforms, creating concentrated funding sources. When liquidity tightens those capital providers gain leverage to tighten pricing, add covenants and narrow eligibility criteria. Supplier concentration and renewal risk can compress margins and slow growth pacing. Diversified facilities and staggered tenors mitigate but do not eliminate this supplier power.
Rate environment sensitivity
Suppliers passed through higher base rates and wider spreads in 2024, with market funding rates averaging about 5.0% and spreads widening roughly 150 bps versus 2022, directly raising ECN’s cost of funds. Funding providers repriced faster than many lease yields reset, compressing net economics and strengthening supplier leverage on structure and advance rates. Hedging reduces exposure but cannot fully offset timing mismatches, leaving residual margin risk.

Dealer and contractor pipelines
In Service Finance and Triad, leading contractors and manufactured-home dealers function as quasi-suppliers, with high-producing partners able to demand faster funding turnarounds, better promotional terms, and tighter tech integrations.
Losing a top dealer can materially reduce originations and increase these partners' bargaining leverage; co-marketing agreements and exclusivity deals can rebalance incentives by locking volume and smoothing cash flow.

Data and tech vendors
Data and tech vendors (credit bureaus, score/model providers, servicing platforms) are highly concentrated—US credit reporting is ~95% covered by Equifax, Experian and TransUnion in 2024—creating strong price power. Switching systems incurs high integration cost and operational risk, with migrations often $1–5M and 12–24 month timelines. Robust SLAs and redundancy lower outage risk but regulatory demands (CFPB, GLBA, fair lending) deepen dependency and supplier leverage.
Securitization intermediaries
Underwriters, trustees and rating agencies shaped ECN Capital deal timing, structure and execution in 2024, often demanding tighter credit enhancements and higher fees as volatility rose; underwriter fees increased about 20–30 basis points industry-wide in 2024. These intermediaries therefore held elevated bargaining power versus issuers like ECN, though ECN’s strong collateral performance history helped partially offset demands.
- Intermediaries: dictate timing/structure
- 2024: ~20–30 bps higher fees
- Tighter credit enhancement in volatility
- Strong collateral history = partial counterbalance
2024 funding squeeze: market rate ~5.0%, spreads +150bps
In 2024 ECN faced concentrated funding: warehouse lines, whole-loan buyers and ABS investors tightened terms as market funding averaged ~5.0% with spreads +150bps vs 2022, raising cost of funds and compressing margins. Top dealers and data vendors (Equifax/Experian/TransUnion ~95% coverage) exerted pricing power; intermediaries raised fees ~20–30bps, increasing issuer leverage.
| Metric | 2024 | Impact |
|---|---|---|
| Market funding rate | ~5.0% | Higher cost of funds |
| Spread change vs 2022 | +150bps | Margin compression |
| US credit bureau share | ~95% | Supplier power |
| Intermediary fee rise | ~20–30bps | Tighter deal economics |
What is included in the product
 Detailed Word Document
Uncovers key drivers of competition, customer influence, supplier power, substitution risks and entry barriers tailored exclusively for ECN Capital, identifying disruptive forces and strategic levers to protect market share and profitability.

 Customizable Excel Spreadsheet
A concise one-sheet Porter's Five Forces for ECN Capital that quantifies competitive pressures, lets you tweak assumptions and scenarios, and outputs a radar chart for instant strategic clarity—no macros, easy to copy into decks or integrate with wider reports.
Customers Bargaining Power

Rate-shopping borrowers
Homeowners and manufactured-home buyers increasingly rate-shop, comparing APRs, terms and promo offers; even a 0.25 percentage-point difference often shifts borrower choice. Digital funnels and marketplaces mean over 60% of shoppers in 2024 used online comparison tools, raising price sensitivity and bargaining power. Faster approvals and clear pricing transparency help ECN defend conversion by offsetting small rate gaps.
Institutional loan buyers
Institutional whole-loan buyers and ABS investors run competitive auctions and demand yield for risk, regularly pushing back on collateral mixes, reps and warranties, and servicing fees; in 2024 ECN Capital securitizations and whole‑loan sales exceeded $1.0 billion, reinforcing buyer leverage over pricing. In risk-off periods their pullback can widen required yields and elevate buyer bargaining power, sometimes moving spreads by dozens of basis points. Long-term takeout agreements with institutional buyers help stabilize pricing and contractual terms.

Large enterprise clients
Kessler’s bank and card-issuer clients are sophisticated and concentrated, driving strong negotiating leverage over fees, success-based compensation and exclusivity on portfolio services. Competitive RFP processes allow these clients to set scope and pricing, increasing pressure on ECN to match terms. ECN’s differentiated analytics and measurable outcomes help reduce churn by demonstrating portfolio lift and retention gains.

Dealer gatekeeping
Dealers act as gatekeepers, choosing which ECN Capital finance options customers see and steering volume to lenders with faster funding and better dealer economics; this intermediated flow increases dealer leverage over fees and service standards. Embedded digital tools and co-branded support in 2024 further lock dealer preference and raise switching costs. Industry surveys in 2024 show dealers remain the primary originator channel.
- Dealer influence on offerings
- Steering to faster-funding lenders
- Higher bargaining on fees
- Embedded tools create lock-in
Switching costs are moderate
End borrowers can pre-fund with limited friction, keeping pricing and covenant pressure on ECN Capital; 2024 industry surveys continued to show moderate switching costs in equipment and specialty finance markets. Institutional clients routinely rotate mandates after multi-year contracts, sustaining bargaining leverage. Migration costs exist but are manageable, though deep integrations and long-standing servicing relationships raise exit frictions.
- Moderate switching costs sustain buyer leverage (2024 industry signal)
- End-borrower pre-funding mobility pressures terms
- Institutional mandate rotation post-contract increases bargaining
- Deeper integrations raise exit frictions
Buyers price-sensitive: >60% use comparisons; 0.25 ppt APR swings; ECN >$1.0bn sales
Buyers show high price sensitivity: >60% used online comparison tools in 2024; small APR gaps (0.25 ppt) shift choice. Institutional whole‑loan/ABS buyers pushed ECN to >$1.0bn in 2024 sales, keeping yield demands high. Dealers remain primary originators in 2024, steering volume and raising fee leverage. Moderate switching costs exist but deep integrations raise exit frictions.
| Metric | 2024 | Impact |
|---|---|---|
| Online comparison usage | >60% | Higher price sensitivity |
| ECN sales (whole‑loan/ABS) | >$1.0bn | Institutional leverage |
| APR sensitivity | 0.25 ppt | Conversion swings |
| Dealer channel | Primary originator | Steering power |
What You See Is What You Get
ECN Capital Porter's Five Forces Analysis
This preview shows the exact ECN Capital Porter’s Five Forces analysis you'll receive after purchase—no placeholders or mockups. It is the full, professionally formatted document, ready for immediate download and use the moment you complete payment.

A Must-Have Tool for Decision-Makers
This concise Porter's Five Forces snapshot highlights ECN Capital's competitive pressures—buyer/supplier power, substitutes, entrant threats, and rivalry—and what they mean for margins and growth. Want the full force-by-force ratings, visuals, and strategic implications tailored to ECN Capital? Unlock the complete analysis for consultant-grade insights ready for investment and planning.
Suppliers Bargaining Power
Concentrated funding sources
As of 2024 ECN relies heavily on warehouse lines, whole-loan buyers and ABS investors to fund originations and servicing platforms, creating concentrated funding sources. When liquidity tightens those capital providers gain leverage to tighten pricing, add covenants and narrow eligibility criteria. Supplier concentration and renewal risk can compress margins and slow growth pacing. Diversified facilities and staggered tenors mitigate but do not eliminate this supplier power.
Rate environment sensitivity
Suppliers passed through higher base rates and wider spreads in 2024, with market funding rates averaging about 5.0% and spreads widening roughly 150 bps versus 2022, directly raising ECN’s cost of funds. Funding providers repriced faster than many lease yields reset, compressing net economics and strengthening supplier leverage on structure and advance rates. Hedging reduces exposure but cannot fully offset timing mismatches, leaving residual margin risk.
Dealer and contractor pipelines
In Service Finance and Triad, leading contractors and manufactured-home dealers function as quasi-suppliers, with high-producing partners able to demand faster funding turnarounds, better promotional terms, and tighter tech integrations.
Losing a top dealer can materially reduce originations and increase these partners' bargaining leverage; co-marketing agreements and exclusivity deals can rebalance incentives by locking volume and smoothing cash flow.
Data and tech vendors
Data and tech vendors (credit bureaus, score/model providers, servicing platforms) are highly concentrated—US credit reporting is ~95% covered by Equifax, Experian and TransUnion in 2024—creating strong price power. Switching systems incurs high integration cost and operational risk, with migrations often $1–5M and 12–24 month timelines. Robust SLAs and redundancy lower outage risk but regulatory demands (CFPB, GLBA, fair lending) deepen dependency and supplier leverage.
Securitization intermediaries
Underwriters, trustees and rating agencies shaped ECN Capital deal timing, structure and execution in 2024, often demanding tighter credit enhancements and higher fees as volatility rose; underwriter fees increased about 20–30 basis points industry-wide in 2024. These intermediaries therefore held elevated bargaining power versus issuers like ECN, though ECN’s strong collateral performance history helped partially offset demands.
- Intermediaries: dictate timing/structure
- 2024: ~20–30 bps higher fees
- Tighter credit enhancement in volatility
- Strong collateral history = partial counterbalance
2024 funding squeeze: market rate ~5.0%, spreads +150bps
In 2024 ECN faced concentrated funding: warehouse lines, whole-loan buyers and ABS investors tightened terms as market funding averaged ~5.0% with spreads +150bps vs 2022, raising cost of funds and compressing margins. Top dealers and data vendors (Equifax/Experian/TransUnion ~95% coverage) exerted pricing power; intermediaries raised fees ~20–30bps, increasing issuer leverage.
| Metric | 2024 | Impact |
|---|---|---|
| Market funding rate | ~5.0% | Higher cost of funds |
| Spread change vs 2022 | +150bps | Margin compression |
| US credit bureau share | ~95% | Supplier power |
| Intermediary fee rise | ~20–30bps | Tighter deal economics |
What is included in the product
Detailed Word Document
Uncovers key drivers of competition, customer influence, supplier power, substitution risks and entry barriers tailored exclusively for ECN Capital, identifying disruptive forces and strategic levers to protect market share and profitability.
Customizable Excel Spreadsheet
A concise one-sheet Porter's Five Forces for ECN Capital that quantifies competitive pressures, lets you tweak assumptions and scenarios, and outputs a radar chart for instant strategic clarity—no macros, easy to copy into decks or integrate with wider reports.
Customers Bargaining Power
Rate-shopping borrowers
Homeowners and manufactured-home buyers increasingly rate-shop, comparing APRs, terms and promo offers; even a 0.25 percentage-point difference often shifts borrower choice. Digital funnels and marketplaces mean over 60% of shoppers in 2024 used online comparison tools, raising price sensitivity and bargaining power. Faster approvals and clear pricing transparency help ECN defend conversion by offsetting small rate gaps.
Institutional loan buyers
Institutional whole-loan buyers and ABS investors run competitive auctions and demand yield for risk, regularly pushing back on collateral mixes, reps and warranties, and servicing fees; in 2024 ECN Capital securitizations and whole‑loan sales exceeded $1.0 billion, reinforcing buyer leverage over pricing. In risk-off periods their pullback can widen required yields and elevate buyer bargaining power, sometimes moving spreads by dozens of basis points. Long-term takeout agreements with institutional buyers help stabilize pricing and contractual terms.
Large enterprise clients
Kessler’s bank and card-issuer clients are sophisticated and concentrated, driving strong negotiating leverage over fees, success-based compensation and exclusivity on portfolio services. Competitive RFP processes allow these clients to set scope and pricing, increasing pressure on ECN to match terms. ECN’s differentiated analytics and measurable outcomes help reduce churn by demonstrating portfolio lift and retention gains.
Dealer gatekeeping
Dealers act as gatekeepers, choosing which ECN Capital finance options customers see and steering volume to lenders with faster funding and better dealer economics; this intermediated flow increases dealer leverage over fees and service standards. Embedded digital tools and co-branded support in 2024 further lock dealer preference and raise switching costs. Industry surveys in 2024 show dealers remain the primary originator channel.
- Dealer influence on offerings
- Steering to faster-funding lenders
- Higher bargaining on fees
- Embedded tools create lock-in
Switching costs are moderate
End borrowers can pre-fund with limited friction, keeping pricing and covenant pressure on ECN Capital; 2024 industry surveys continued to show moderate switching costs in equipment and specialty finance markets. Institutional clients routinely rotate mandates after multi-year contracts, sustaining bargaining leverage. Migration costs exist but are manageable, though deep integrations and long-standing servicing relationships raise exit frictions.
- Moderate switching costs sustain buyer leverage (2024 industry signal)
- End-borrower pre-funding mobility pressures terms
- Institutional mandate rotation post-contract increases bargaining
- Deeper integrations raise exit frictions
Buyers price-sensitive: >60% use comparisons; 0.25 ppt APR swings; ECN >$1.0bn sales
Buyers show high price sensitivity: >60% used online comparison tools in 2024; small APR gaps (0.25 ppt) shift choice. Institutional whole‑loan/ABS buyers pushed ECN to >$1.0bn in 2024 sales, keeping yield demands high. Dealers remain primary originators in 2024, steering volume and raising fee leverage. Moderate switching costs exist but deep integrations raise exit frictions.
| Metric | 2024 | Impact |
|---|---|---|
| Online comparison usage | >60% | Higher price sensitivity |
| ECN sales (whole‑loan/ABS) | >$1.0bn | Institutional leverage |
| APR sensitivity | 0.25 ppt | Conversion swings |
| Dealer channel | Primary originator | Steering power |
What You See Is What You Get
ECN Capital Porter's Five Forces Analysis
This preview shows the exact ECN Capital Porter’s Five Forces analysis you'll receive after purchase—no placeholders or mockups. It is the full, professionally formatted document, ready for immediate download and use the moment you complete payment.
Description
A Must-Have Tool for Decision-Makers
This concise Porter's Five Forces snapshot highlights ECN Capital's competitive pressures—buyer/supplier power, substitutes, entrant threats, and rivalry—and what they mean for margins and growth. Want the full force-by-force ratings, visuals, and strategic implications tailored to ECN Capital? Unlock the complete analysis for consultant-grade insights ready for investment and planning.
Suppliers Bargaining Power
Concentrated funding sources
As of 2024 ECN relies heavily on warehouse lines, whole-loan buyers and ABS investors to fund originations and servicing platforms, creating concentrated funding sources. When liquidity tightens those capital providers gain leverage to tighten pricing, add covenants and narrow eligibility criteria. Supplier concentration and renewal risk can compress margins and slow growth pacing. Diversified facilities and staggered tenors mitigate but do not eliminate this supplier power.
Rate environment sensitivity
Suppliers passed through higher base rates and wider spreads in 2024, with market funding rates averaging about 5.0% and spreads widening roughly 150 bps versus 2022, directly raising ECN’s cost of funds. Funding providers repriced faster than many lease yields reset, compressing net economics and strengthening supplier leverage on structure and advance rates. Hedging reduces exposure but cannot fully offset timing mismatches, leaving residual margin risk.
Dealer and contractor pipelines
In Service Finance and Triad, leading contractors and manufactured-home dealers function as quasi-suppliers, with high-producing partners able to demand faster funding turnarounds, better promotional terms, and tighter tech integrations.
Losing a top dealer can materially reduce originations and increase these partners' bargaining leverage; co-marketing agreements and exclusivity deals can rebalance incentives by locking volume and smoothing cash flow.
Data and tech vendors
Data and tech vendors (credit bureaus, score/model providers, servicing platforms) are highly concentrated—US credit reporting is ~95% covered by Equifax, Experian and TransUnion in 2024—creating strong price power. Switching systems incurs high integration cost and operational risk, with migrations often $1–5M and 12–24 month timelines. Robust SLAs and redundancy lower outage risk but regulatory demands (CFPB, GLBA, fair lending) deepen dependency and supplier leverage.
Securitization intermediaries
Underwriters, trustees and rating agencies shaped ECN Capital deal timing, structure and execution in 2024, often demanding tighter credit enhancements and higher fees as volatility rose; underwriter fees increased about 20–30 basis points industry-wide in 2024. These intermediaries therefore held elevated bargaining power versus issuers like ECN, though ECN’s strong collateral performance history helped partially offset demands.
- Intermediaries: dictate timing/structure
- 2024: ~20–30 bps higher fees
- Tighter credit enhancement in volatility
- Strong collateral history = partial counterbalance
2024 funding squeeze: market rate ~5.0%, spreads +150bps
In 2024 ECN faced concentrated funding: warehouse lines, whole-loan buyers and ABS investors tightened terms as market funding averaged ~5.0% with spreads +150bps vs 2022, raising cost of funds and compressing margins. Top dealers and data vendors (Equifax/Experian/TransUnion ~95% coverage) exerted pricing power; intermediaries raised fees ~20–30bps, increasing issuer leverage.
| Metric | 2024 | Impact |
|---|---|---|
| Market funding rate | ~5.0% | Higher cost of funds |
| Spread change vs 2022 | +150bps | Margin compression |
| US credit bureau share | ~95% | Supplier power |
| Intermediary fee rise | ~20–30bps | Tighter deal economics |
What is included in the product
Detailed Word Document
Uncovers key drivers of competition, customer influence, supplier power, substitution risks and entry barriers tailored exclusively for ECN Capital, identifying disruptive forces and strategic levers to protect market share and profitability.
Customizable Excel Spreadsheet
A concise one-sheet Porter's Five Forces for ECN Capital that quantifies competitive pressures, lets you tweak assumptions and scenarios, and outputs a radar chart for instant strategic clarity—no macros, easy to copy into decks or integrate with wider reports.
Customers Bargaining Power
Rate-shopping borrowers
Homeowners and manufactured-home buyers increasingly rate-shop, comparing APRs, terms and promo offers; even a 0.25 percentage-point difference often shifts borrower choice. Digital funnels and marketplaces mean over 60% of shoppers in 2024 used online comparison tools, raising price sensitivity and bargaining power. Faster approvals and clear pricing transparency help ECN defend conversion by offsetting small rate gaps.
Institutional loan buyers
Institutional whole-loan buyers and ABS investors run competitive auctions and demand yield for risk, regularly pushing back on collateral mixes, reps and warranties, and servicing fees; in 2024 ECN Capital securitizations and whole‑loan sales exceeded $1.0 billion, reinforcing buyer leverage over pricing. In risk-off periods their pullback can widen required yields and elevate buyer bargaining power, sometimes moving spreads by dozens of basis points. Long-term takeout agreements with institutional buyers help stabilize pricing and contractual terms.
Large enterprise clients
Kessler’s bank and card-issuer clients are sophisticated and concentrated, driving strong negotiating leverage over fees, success-based compensation and exclusivity on portfolio services. Competitive RFP processes allow these clients to set scope and pricing, increasing pressure on ECN to match terms. ECN’s differentiated analytics and measurable outcomes help reduce churn by demonstrating portfolio lift and retention gains.
Dealer gatekeeping
Dealers act as gatekeepers, choosing which ECN Capital finance options customers see and steering volume to lenders with faster funding and better dealer economics; this intermediated flow increases dealer leverage over fees and service standards. Embedded digital tools and co-branded support in 2024 further lock dealer preference and raise switching costs. Industry surveys in 2024 show dealers remain the primary originator channel.
- Dealer influence on offerings
- Steering to faster-funding lenders
- Higher bargaining on fees
- Embedded tools create lock-in
Switching costs are moderate
End borrowers can pre-fund with limited friction, keeping pricing and covenant pressure on ECN Capital; 2024 industry surveys continued to show moderate switching costs in equipment and specialty finance markets. Institutional clients routinely rotate mandates after multi-year contracts, sustaining bargaining leverage. Migration costs exist but are manageable, though deep integrations and long-standing servicing relationships raise exit frictions.
- Moderate switching costs sustain buyer leverage (2024 industry signal)
- End-borrower pre-funding mobility pressures terms
- Institutional mandate rotation post-contract increases bargaining
- Deeper integrations raise exit frictions
Buyers price-sensitive: >60% use comparisons; 0.25 ppt APR swings; ECN >$1.0bn sales
Buyers show high price sensitivity: >60% used online comparison tools in 2024; small APR gaps (0.25 ppt) shift choice. Institutional whole‑loan/ABS buyers pushed ECN to >$1.0bn in 2024 sales, keeping yield demands high. Dealers remain primary originators in 2024, steering volume and raising fee leverage. Moderate switching costs exist but deep integrations raise exit frictions.
| Metric | 2024 | Impact |
|---|---|---|
| Online comparison usage | >60% | Higher price sensitivity |
| ECN sales (whole‑loan/ABS) | >$1.0bn | Institutional leverage |
| APR sensitivity | 0.25 ppt | Conversion swings |
| Dealer channel | Primary originator | Steering power |
What You See Is What You Get
ECN Capital Porter's Five Forces Analysis
This preview shows the exact ECN Capital Porter’s Five Forces analysis you'll receive after purchase—no placeholders or mockups. It is the full, professionally formatted document, ready for immediate download and use the moment you complete payment.











