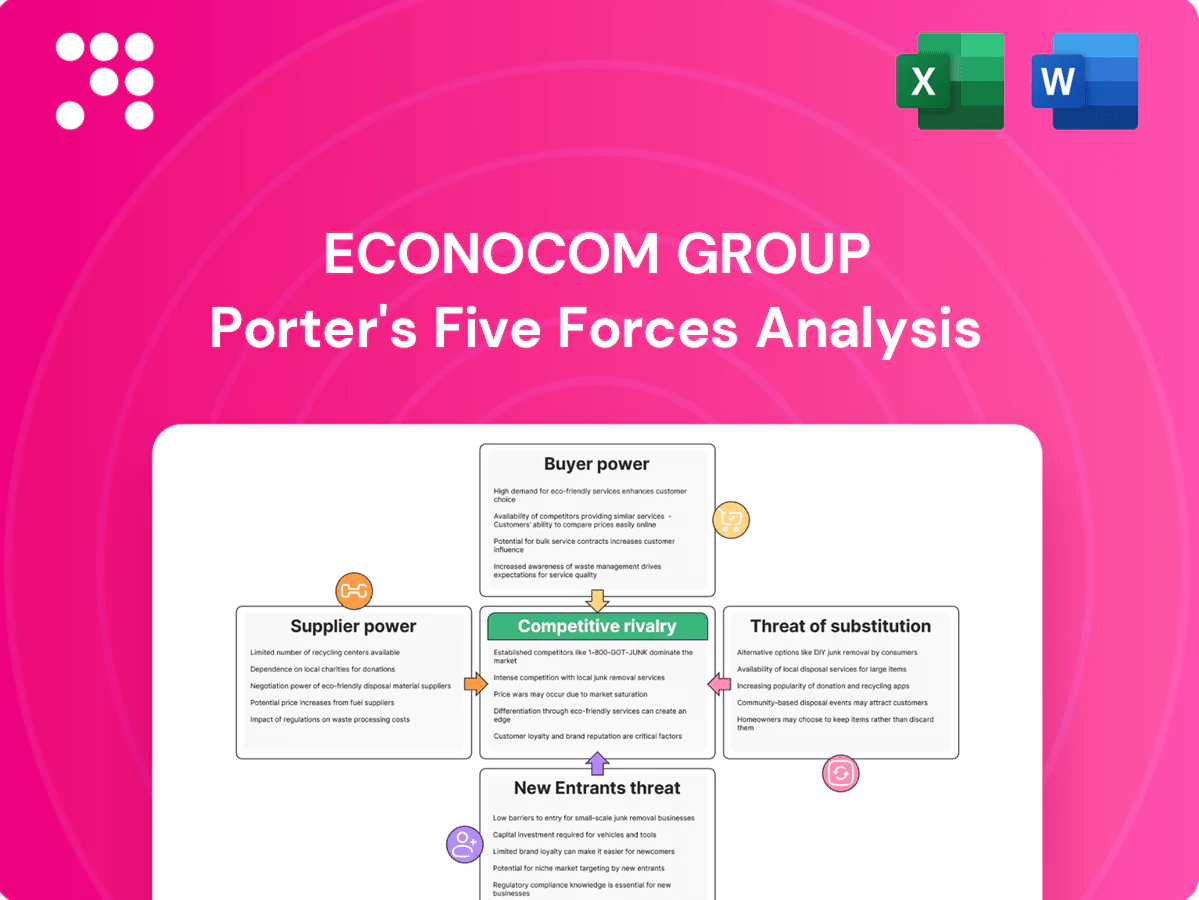
Econocom Group Porter's Five Forces Analysis

Don't Miss the Bigger Picture
Econocom Group faces moderate buyer power, evolving supplier relationships, and rising competitive pressure from digital services and leasing specialists; substitutes and new entrants present measured threats while industry rivalry intensifies around pricing and service bundling. This brief snapshot only scratches the surface. Unlock the full Porter's Five Forces Analysis to explore Econocom Group’s competitive dynamics, market pressures, and strategic advantages in detail.
Suppliers Bargaining Power

Concentrated OEM and Hyperscaler Dependence
Hardware, software and cloud capacity come from a concentrated set of global vendors, with AWS, Microsoft Azure and Google Cloud Platform holding roughly 66% of the cloud market in 2024 (AWS ~32%, Azure ~23%, GCP ~11%), giving suppliers leverage on pricing, certifications and deal registration. Econocom mitigates this via multi-vendor sourcing and volume commitments to reduce supplier pricing power. Preferred-partner tiers enable margin recovery through rebates and market development funds (MDF).
Specialist Talent Scarcity
Digital transformation spikes demand for cloud, cybersecurity and hybrid infra skills, with ISC2 reporting a ~3.5 million global cybersecurity workforce gap in 2024, strengthening supplier power; Hays 2024 shows tech contractor rates and salaries rising mid‑single to double digits in many markets. Econocom mitigates via internal academies and nearshore centers, while automation and AI delivery platforms gradually reduce reliance on niche experts.

Proprietary Ecosystems and Lock-ins
Suppliers embed proprietary APIs, licensing and consumption models that raise switching frictions and compliance risks for integrators, increasing supplier leverage over pricing and roadmap decisions. Framework agreements and multi-cloud architectures dilute single-vendor lock-in, with 2024 industry surveys showing over 90% of enterprises adopting multi-cloud strategies. Adoption of open standards and containerization (Kubernetes-based deployments) further rebalances bargaining dynamics by enabling portability and faster migration.

Supply Chain Volatility
Component shortages and logistics constraints tighten supplier control over lead times, with priority allocations typically favoring larger partners and prepaid orders; Econocom’s financing arm can pre-procure and buffer inventory to secure deliveries, while strong forecast accuracy and S&OP discipline reduce exposure.
- Priority allocations favor scale
- Prepayment improves access
- Financing enables pre-procurement
- Accurate S&OP lowers risk
Financing Terms from Vendors
Vendor-provided leasing and back-to-back financing shape deal structure and can compress margins, with vendor credit often accelerating sales cycles; in 2024 Econocom maintained revenue around €2.3bn while using vendor finance selectively to preserve margin. Access to vendor credit lines remains a differentiator but creates dependency risks; Econocom’s own funding capacity and diversified banking relationships (multiple Eurozone banks and EIB facilities) mitigate supplier leverage.
- Vendor leasing influence: selective use
- Dependency risk: present if overused
- Econocom funding: internal capacity offsets
- Bank diversification: stabilizes terms
Cloud top-3 66%, 3.5M gap boosts vendor power firm adapts
Cloud hardware/software concentrated (AWS 32%, Azure 23%, GCP 11% = 66% in 2024), giving supplier pricing leverage. A 3.5M global cybersecurity workforce gap (2024) and rising contractor rates increase supplier power; Econocom offsets with academies, nearshore centers and automation. Vendor leasing/priority allocations compress margins but Econocom’s €2.3bn 2024 revenue and diverse funding reduce dependency.
| Metric | 2024 |
|---|---|
| Top-3 cloud share | 66% |
| Cyber gap | 3.5M |
| Econocom revenue | €2.3bn |
What is included in the product
 Detailed Word Document
Uncovers key drivers of competition, buyer and supplier power, entry barriers, substitutes and disruptive threats tailored exclusively to Econocom Group, providing strategic commentary to inform investor decks, business plans and internal strategy.

 Customizable Excel Spreadsheet
One-sheet Porter's Five Forces for Econocom Group—clear, customizable pressure levels and an instant spider/radar chart to visualize strategic threats and opportunities, ready to copy into pitch decks or integrate into dashboards for fast, boardroom-ready decision-making.
Customers Bargaining Power

Large Enterprise Procurement
Econocom serves large enterprises with professional sourcing teams, and reported consolidated revenue of €2.9bn in 2024, underscoring its enterprise focus. Competitive RFPs and framework contracts intensify price pressure, while buyers routinely unbundle design, rollout and managed services to source best-of-breed. Proofs of concept and stringent SLAs are key negotiation levers that shift commercial terms and margin risk to suppliers.
Multi-Year, Multi-Vendor Strategies
Enterprises commonly maintain panels of 3 to 5 integrators, MSPs and financiers, expanding substitution options and strengthening benchmarking power; Econocom reported group revenues around €2.1bn in 2024, reflecting intense competitive pressure. Coexistence with global SIs and niche specialists keeps delivery margins compressed, often below 10% on services. Value articulation must quantify lifecycle TCO and outcome KPIs to defend pricing and win RFPs.

Switching Costs vs Standardization
Managed services and multi-year financing agreements create operational and contractual switching costs for Econocom, while by 2024 over 80% of enterprises’ cloud adoption and standardized toolchains have progressively lowered exit barriers; buyers exploit this tension to renegotiate mid-cycle, while strong governance and transparent reporting lock in perceived value and raise effective retention.

Outcome-Based Expectations
Clients demand KPIs, XLA/SLAs and risk-sharing, pushing outcome pricing that transfers delivery risk to Econocom and peers; robust delivery analytics and automation are essential to protect margin while transparent performance dashboards streamline renewals and reduce dispute cycles.
- KPIs/XLA/SLAs
- Outcome pricing = provider risk
- Analytics & automation defend margin
- Dashboards ease renewals
Internal Build Capabilities
Many enterprises maintain in-house digital teams, creating a credible internalization threat that strengthens buyer power in 2024. Co-managed models and staff augmentation defuse insourcing by offering flexible alternatives. Formal knowledge-transfer plans build trust and stickiness, reducing churn risk.
- Insourcing threat: elevates buyer leverage
- Co-managed/staff augment: mitigates switch
- Knowledge transfer: increases retention
Panels & RFPs squeeze pricing; 80%+ cloud standardization reduces switching
Large-enterprise buyers (panels 3–5) and competitive RFPs drive strong pricing pressure; Econocom reported €2.9bn group revenue and €2.1bn service revenue in 2024. Over 80% cloud/tool standardization in 2024 lowers switching costs and boosts benchmarking power. Outcome pricing, KPIs/XLA and SLAs transfer risk to providers; analytics, automation and KM plans are essential to defend sub-10% services margins.
| Metric | 2024 |
|---|---|
| Group revenue | €2.9bn |
| Service revenue | €2.1bn |
| Cloud adoption | 80%+ |
| Typical panel size | 3–5 |
What You See Is What You Get
Econocom Group Porter's Five Forces Analysis
This Econocom Group Porter's Five Forces Analysis preview is the exact document you'll receive after purchase, with no placeholders or mockups. It contains the full, professionally formatted analysis ready for immediate download and use. Purchase grants instant access to this same file, fully complete and actionable.

Don't Miss the Bigger Picture
Econocom Group faces moderate buyer power, evolving supplier relationships, and rising competitive pressure from digital services and leasing specialists; substitutes and new entrants present measured threats while industry rivalry intensifies around pricing and service bundling. This brief snapshot only scratches the surface. Unlock the full Porter's Five Forces Analysis to explore Econocom Group’s competitive dynamics, market pressures, and strategic advantages in detail.
Suppliers Bargaining Power
Concentrated OEM and Hyperscaler Dependence
Hardware, software and cloud capacity come from a concentrated set of global vendors, with AWS, Microsoft Azure and Google Cloud Platform holding roughly 66% of the cloud market in 2024 (AWS ~32%, Azure ~23%, GCP ~11%), giving suppliers leverage on pricing, certifications and deal registration. Econocom mitigates this via multi-vendor sourcing and volume commitments to reduce supplier pricing power. Preferred-partner tiers enable margin recovery through rebates and market development funds (MDF).
Specialist Talent Scarcity
Digital transformation spikes demand for cloud, cybersecurity and hybrid infra skills, with ISC2 reporting a ~3.5 million global cybersecurity workforce gap in 2024, strengthening supplier power; Hays 2024 shows tech contractor rates and salaries rising mid‑single to double digits in many markets. Econocom mitigates via internal academies and nearshore centers, while automation and AI delivery platforms gradually reduce reliance on niche experts.
Proprietary Ecosystems and Lock-ins
Suppliers embed proprietary APIs, licensing and consumption models that raise switching frictions and compliance risks for integrators, increasing supplier leverage over pricing and roadmap decisions. Framework agreements and multi-cloud architectures dilute single-vendor lock-in, with 2024 industry surveys showing over 90% of enterprises adopting multi-cloud strategies. Adoption of open standards and containerization (Kubernetes-based deployments) further rebalances bargaining dynamics by enabling portability and faster migration.
Supply Chain Volatility
Component shortages and logistics constraints tighten supplier control over lead times, with priority allocations typically favoring larger partners and prepaid orders; Econocom’s financing arm can pre-procure and buffer inventory to secure deliveries, while strong forecast accuracy and S&OP discipline reduce exposure.
- Priority allocations favor scale
- Prepayment improves access
- Financing enables pre-procurement
- Accurate S&OP lowers risk
Financing Terms from Vendors
Vendor-provided leasing and back-to-back financing shape deal structure and can compress margins, with vendor credit often accelerating sales cycles; in 2024 Econocom maintained revenue around €2.3bn while using vendor finance selectively to preserve margin. Access to vendor credit lines remains a differentiator but creates dependency risks; Econocom’s own funding capacity and diversified banking relationships (multiple Eurozone banks and EIB facilities) mitigate supplier leverage.
- Vendor leasing influence: selective use
- Dependency risk: present if overused
- Econocom funding: internal capacity offsets
- Bank diversification: stabilizes terms
Cloud top-3 66%, 3.5M gap boosts vendor power firm adapts
Cloud hardware/software concentrated (AWS 32%, Azure 23%, GCP 11% = 66% in 2024), giving supplier pricing leverage. A 3.5M global cybersecurity workforce gap (2024) and rising contractor rates increase supplier power; Econocom offsets with academies, nearshore centers and automation. Vendor leasing/priority allocations compress margins but Econocom’s €2.3bn 2024 revenue and diverse funding reduce dependency.
| Metric | 2024 |
|---|---|
| Top-3 cloud share | 66% |
| Cyber gap | 3.5M |
| Econocom revenue | €2.3bn |
What is included in the product
Detailed Word Document
Uncovers key drivers of competition, buyer and supplier power, entry barriers, substitutes and disruptive threats tailored exclusively to Econocom Group, providing strategic commentary to inform investor decks, business plans and internal strategy.
Customizable Excel Spreadsheet
One-sheet Porter's Five Forces for Econocom Group—clear, customizable pressure levels and an instant spider/radar chart to visualize strategic threats and opportunities, ready to copy into pitch decks or integrate into dashboards for fast, boardroom-ready decision-making.
Customers Bargaining Power
Large Enterprise Procurement
Econocom serves large enterprises with professional sourcing teams, and reported consolidated revenue of €2.9bn in 2024, underscoring its enterprise focus. Competitive RFPs and framework contracts intensify price pressure, while buyers routinely unbundle design, rollout and managed services to source best-of-breed. Proofs of concept and stringent SLAs are key negotiation levers that shift commercial terms and margin risk to suppliers.
Multi-Year, Multi-Vendor Strategies
Enterprises commonly maintain panels of 3 to 5 integrators, MSPs and financiers, expanding substitution options and strengthening benchmarking power; Econocom reported group revenues around €2.1bn in 2024, reflecting intense competitive pressure. Coexistence with global SIs and niche specialists keeps delivery margins compressed, often below 10% on services. Value articulation must quantify lifecycle TCO and outcome KPIs to defend pricing and win RFPs.
Switching Costs vs Standardization
Managed services and multi-year financing agreements create operational and contractual switching costs for Econocom, while by 2024 over 80% of enterprises’ cloud adoption and standardized toolchains have progressively lowered exit barriers; buyers exploit this tension to renegotiate mid-cycle, while strong governance and transparent reporting lock in perceived value and raise effective retention.
Outcome-Based Expectations
Clients demand KPIs, XLA/SLAs and risk-sharing, pushing outcome pricing that transfers delivery risk to Econocom and peers; robust delivery analytics and automation are essential to protect margin while transparent performance dashboards streamline renewals and reduce dispute cycles.
- KPIs/XLA/SLAs
- Outcome pricing = provider risk
- Analytics & automation defend margin
- Dashboards ease renewals
Internal Build Capabilities
Many enterprises maintain in-house digital teams, creating a credible internalization threat that strengthens buyer power in 2024. Co-managed models and staff augmentation defuse insourcing by offering flexible alternatives. Formal knowledge-transfer plans build trust and stickiness, reducing churn risk.
- Insourcing threat: elevates buyer leverage
- Co-managed/staff augment: mitigates switch
- Knowledge transfer: increases retention
Panels & RFPs squeeze pricing; 80%+ cloud standardization reduces switching
Large-enterprise buyers (panels 3–5) and competitive RFPs drive strong pricing pressure; Econocom reported €2.9bn group revenue and €2.1bn service revenue in 2024. Over 80% cloud/tool standardization in 2024 lowers switching costs and boosts benchmarking power. Outcome pricing, KPIs/XLA and SLAs transfer risk to providers; analytics, automation and KM plans are essential to defend sub-10% services margins.
| Metric | 2024 |
|---|---|
| Group revenue | €2.9bn |
| Service revenue | €2.1bn |
| Cloud adoption | 80%+ |
| Typical panel size | 3–5 |
What You See Is What You Get
Econocom Group Porter's Five Forces Analysis
This Econocom Group Porter's Five Forces Analysis preview is the exact document you'll receive after purchase, with no placeholders or mockups. It contains the full, professionally formatted analysis ready for immediate download and use. Purchase grants instant access to this same file, fully complete and actionable.
Original: $10.00
-65%$10.00
$3.50Description
Don't Miss the Bigger Picture
Econocom Group faces moderate buyer power, evolving supplier relationships, and rising competitive pressure from digital services and leasing specialists; substitutes and new entrants present measured threats while industry rivalry intensifies around pricing and service bundling. This brief snapshot only scratches the surface. Unlock the full Porter's Five Forces Analysis to explore Econocom Group’s competitive dynamics, market pressures, and strategic advantages in detail.
Suppliers Bargaining Power
Concentrated OEM and Hyperscaler Dependence
Hardware, software and cloud capacity come from a concentrated set of global vendors, with AWS, Microsoft Azure and Google Cloud Platform holding roughly 66% of the cloud market in 2024 (AWS ~32%, Azure ~23%, GCP ~11%), giving suppliers leverage on pricing, certifications and deal registration. Econocom mitigates this via multi-vendor sourcing and volume commitments to reduce supplier pricing power. Preferred-partner tiers enable margin recovery through rebates and market development funds (MDF).
Specialist Talent Scarcity
Digital transformation spikes demand for cloud, cybersecurity and hybrid infra skills, with ISC2 reporting a ~3.5 million global cybersecurity workforce gap in 2024, strengthening supplier power; Hays 2024 shows tech contractor rates and salaries rising mid‑single to double digits in many markets. Econocom mitigates via internal academies and nearshore centers, while automation and AI delivery platforms gradually reduce reliance on niche experts.
Proprietary Ecosystems and Lock-ins
Suppliers embed proprietary APIs, licensing and consumption models that raise switching frictions and compliance risks for integrators, increasing supplier leverage over pricing and roadmap decisions. Framework agreements and multi-cloud architectures dilute single-vendor lock-in, with 2024 industry surveys showing over 90% of enterprises adopting multi-cloud strategies. Adoption of open standards and containerization (Kubernetes-based deployments) further rebalances bargaining dynamics by enabling portability and faster migration.
Supply Chain Volatility
Component shortages and logistics constraints tighten supplier control over lead times, with priority allocations typically favoring larger partners and prepaid orders; Econocom’s financing arm can pre-procure and buffer inventory to secure deliveries, while strong forecast accuracy and S&OP discipline reduce exposure.
- Priority allocations favor scale
- Prepayment improves access
- Financing enables pre-procurement
- Accurate S&OP lowers risk
Financing Terms from Vendors
Vendor-provided leasing and back-to-back financing shape deal structure and can compress margins, with vendor credit often accelerating sales cycles; in 2024 Econocom maintained revenue around €2.3bn while using vendor finance selectively to preserve margin. Access to vendor credit lines remains a differentiator but creates dependency risks; Econocom’s own funding capacity and diversified banking relationships (multiple Eurozone banks and EIB facilities) mitigate supplier leverage.
- Vendor leasing influence: selective use
- Dependency risk: present if overused
- Econocom funding: internal capacity offsets
- Bank diversification: stabilizes terms
Cloud top-3 66%, 3.5M gap boosts vendor power firm adapts
Cloud hardware/software concentrated (AWS 32%, Azure 23%, GCP 11% = 66% in 2024), giving supplier pricing leverage. A 3.5M global cybersecurity workforce gap (2024) and rising contractor rates increase supplier power; Econocom offsets with academies, nearshore centers and automation. Vendor leasing/priority allocations compress margins but Econocom’s €2.3bn 2024 revenue and diverse funding reduce dependency.
| Metric | 2024 |
|---|---|
| Top-3 cloud share | 66% |
| Cyber gap | 3.5M |
| Econocom revenue | €2.3bn |
What is included in the product
Detailed Word Document
Uncovers key drivers of competition, buyer and supplier power, entry barriers, substitutes and disruptive threats tailored exclusively to Econocom Group, providing strategic commentary to inform investor decks, business plans and internal strategy.
Customizable Excel Spreadsheet
One-sheet Porter's Five Forces for Econocom Group—clear, customizable pressure levels and an instant spider/radar chart to visualize strategic threats and opportunities, ready to copy into pitch decks or integrate into dashboards for fast, boardroom-ready decision-making.
Customers Bargaining Power
Large Enterprise Procurement
Econocom serves large enterprises with professional sourcing teams, and reported consolidated revenue of €2.9bn in 2024, underscoring its enterprise focus. Competitive RFPs and framework contracts intensify price pressure, while buyers routinely unbundle design, rollout and managed services to source best-of-breed. Proofs of concept and stringent SLAs are key negotiation levers that shift commercial terms and margin risk to suppliers.
Multi-Year, Multi-Vendor Strategies
Enterprises commonly maintain panels of 3 to 5 integrators, MSPs and financiers, expanding substitution options and strengthening benchmarking power; Econocom reported group revenues around €2.1bn in 2024, reflecting intense competitive pressure. Coexistence with global SIs and niche specialists keeps delivery margins compressed, often below 10% on services. Value articulation must quantify lifecycle TCO and outcome KPIs to defend pricing and win RFPs.
Switching Costs vs Standardization
Managed services and multi-year financing agreements create operational and contractual switching costs for Econocom, while by 2024 over 80% of enterprises’ cloud adoption and standardized toolchains have progressively lowered exit barriers; buyers exploit this tension to renegotiate mid-cycle, while strong governance and transparent reporting lock in perceived value and raise effective retention.
Outcome-Based Expectations
Clients demand KPIs, XLA/SLAs and risk-sharing, pushing outcome pricing that transfers delivery risk to Econocom and peers; robust delivery analytics and automation are essential to protect margin while transparent performance dashboards streamline renewals and reduce dispute cycles.
- KPIs/XLA/SLAs
- Outcome pricing = provider risk
- Analytics & automation defend margin
- Dashboards ease renewals
Internal Build Capabilities
Many enterprises maintain in-house digital teams, creating a credible internalization threat that strengthens buyer power in 2024. Co-managed models and staff augmentation defuse insourcing by offering flexible alternatives. Formal knowledge-transfer plans build trust and stickiness, reducing churn risk.
- Insourcing threat: elevates buyer leverage
- Co-managed/staff augment: mitigates switch
- Knowledge transfer: increases retention
Panels & RFPs squeeze pricing; 80%+ cloud standardization reduces switching
Large-enterprise buyers (panels 3–5) and competitive RFPs drive strong pricing pressure; Econocom reported €2.9bn group revenue and €2.1bn service revenue in 2024. Over 80% cloud/tool standardization in 2024 lowers switching costs and boosts benchmarking power. Outcome pricing, KPIs/XLA and SLAs transfer risk to providers; analytics, automation and KM plans are essential to defend sub-10% services margins.
| Metric | 2024 |
|---|---|
| Group revenue | €2.9bn |
| Service revenue | €2.1bn |
| Cloud adoption | 80%+ |
| Typical panel size | 3–5 |
What You See Is What You Get
Econocom Group Porter's Five Forces Analysis
This Econocom Group Porter's Five Forces Analysis preview is the exact document you'll receive after purchase, with no placeholders or mockups. It contains the full, professionally formatted analysis ready for immediate download and use. Purchase grants instant access to this same file, fully complete and actionable.











