Econocom Group PESTLE Analysis

Plan Smarter. Present Sharper. Compete Stronger.
Discover how political shifts, economic cycles, and rapid tech disruption shape Econocom Group’s strategic outlook. This concise PESTLE highlights regulatory risks, market opportunities, and sustainability pressures that matter to investors and planners. Buy the full analysis for the complete, editable report and actionable recommendations to guide smarter decisions.
Political factors

EU digital policy shaping demand
EU pushes on digital sovereignty, cloud adoption and public-sector modernization expand project pipelines for integrators like Econocom, supported by NextGenerationEU (€806.9bn) and the Digital Europe Programme (€7.5bn) funding envelopes that accelerate health, education and government deployments. Alignment with Gaia‑X principles is increasingly a commercial differentiator for public tenders. Policy shifts or implementation delays can quickly stall or redirect spending.
Public procurement and tender dynamics
Large digital projects often route through regulated tenders: EU public procurement totals about €2 trillion annually (~14% of GDP), driving strict compliance, localization and value‑for‑money clauses. Mastering framework agreements and consortiums can secure multi‑year revenues, while award processes frequently take 6–12 months, lengthening sales cycles and cash conversion. Political shifts can reprioritize budgets mid‑cycle.

Geopolitical supply-chain exposure
Technology sourcing for Econocom is exposed to global hardware and semiconductor chains—global chip sales were $573 billion in 2023 (WSTS) and trade tensions/export controls since 2022 have tightened access to advanced nodes. Lead-time volatility, which peaked near 26 weeks in 2021 and averaged ~14 weeks in 2024 (S&P Global), disrupts deliveries and revenue recognition. Multi-vendor sourcing and buffer inventory reduce risk while ~60% of enterprise buyers in 2024 surveys request origin transparency and sovereign options.

Subsidies and incentives for green/secure IT
National and EU incentives for energy‑efficient infrastructure, cybersecurity and digital skills—backed by programmes like NextGenerationEU (€723.8bn) and Digital Europe (€7.5bn)—can materially improve project ROI for Econocom clients.
- Integrators bundling financing capture incentives faster
- Monitor country schemes continuously
- RRF measures largely run to 2026—plan for sunsets
- Sunset risk = potential demand cliffs
Tax and fiscal policy across markets
Changes in VAT and digital services taxes alter client total cost of ownership, with EU average VAT around 21% and many jurisdictions introducing DSTs alongside the OECD Pillar Two 15% global minimum tax rolled out 2023–2024; investment allowances and fiscal tightening drive volatility in public IT budgets, while stimulus can boost procurement. Cross‑border operations face rising transfer pricing audits, forcing tax‑efficient compliant financing structures.
EU tech spending surge, procurement delays and tax shifts reshape IT supply and total cost
EU digital sovereignty, NextGenerationEU €806.9bn and Digital Europe €7.5bn expand public IT pipelines; public procurement ~€2tn/yr lengthens sales cycles. Supply‑chain controls, global chip sales $573bn (2023) and 14‑week avg lead times (2024) raise delivery risk. Tax shifts: OECD Pillar Two 15% from 2023 and EU VAT ~21% affect TCO.
| Metric | Value |
|---|---|
| NextGenerationEU | €806.9bn |
| Digital Europe | €7.5bn |
| EU procurement | ~€2tn/yr |
| Chip sales (2023) | $573bn |
| Avg lead time (2024) | ~14 weeks |
| OECD Pillar Two | 15% |
| EU VAT avg | ~21% |
What is included in the product
 Detailed Word Document
Explores how Political, Economic, Social, Technological, Environmental and Legal forces uniquely affect Econocom Group, with data-driven, region- and industry-specific insights; designed for executives and investors to spot risks, opportunities and inform scenario-based strategy, ready for direct insertion into reports and pitch materials.

 Customizable Excel Spreadsheet
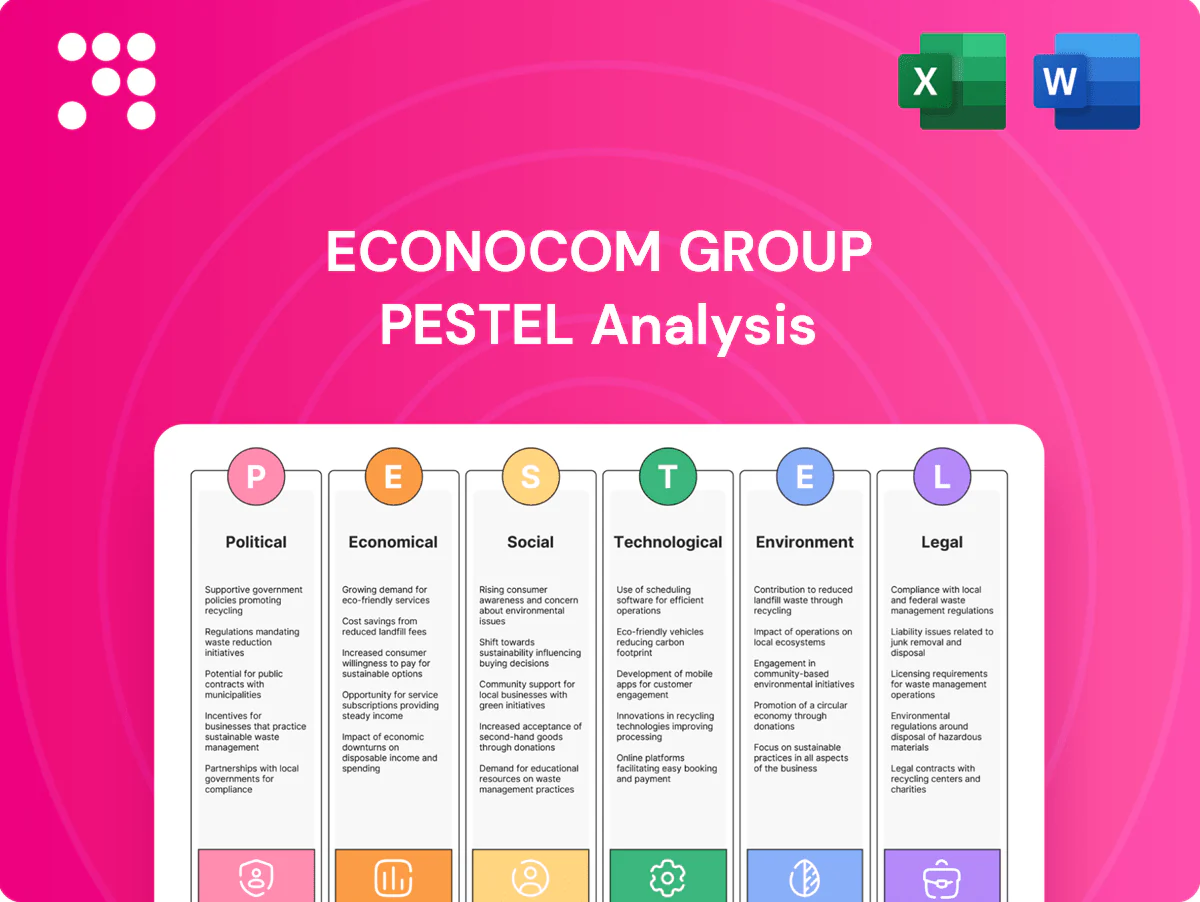
A concise, visually segmented PESTLE summary of Econocom Group that relieves preparation pain by making external risks and market positioning instantly accessible. Editable notes and shareable format streamline team alignment and presentations.
Economic factors

Interest rates impact tech financing
Econocom’s design‑finance‑operate model is highly sensitive to funding costs: with the ECB policy rate at about 4.00% and 12‑month Euribor near 3.8% in mid‑2025, higher rates increase lease pricing and can push clients from opex leases toward capex purchases. Active balance‑sheet management, including asset rotation and interest‑rate hedges, has preserved margins. Conversely, any rate cuts would likely reaccelerate project intake and generate refinancing gains.
Corporate IT spending cycles
Macro slowdowns delay large transformation programs while productivity and resilience mandates sustain core IT spend. CFOs prioritize quick‑payback projects, managed services and FinOps, and diversification across sectors smooths client cyclicality. Backlog quality and renewal rates are key leading indicators; Econocom reported 2023 revenue €2.03bn, underscoring resilience.

Inflation and wage pressure
Talent-driven cost inflation compresses Econocom services margins where contracts lack indexation, forcing tighter pricing discipline. Price-rise pass-through and productivity tooling are critical to protect EBIT, while vendor rebates and lifecycle services help offset margin pressure. Long-term contracts require clear escalation mechanisms to maintain margin resilience amid rising labour costs.

FX exposure in pan‑European operations
Revenues and costs span EUR and non-EUR markets, creating translation and transaction risks that can affect reported margins and cash flows.
Hedging policies and natural currency offsets limit volatility; USD-priced hardware from vendors can squeeze margins when the euro weakens, so transparent FX clauses in contracts protect deal economics.
- FX translation and transaction risk
- Hedging and natural offsets reduce volatility
- USD vendor pricing pressures margins
- Transparent FX clauses safeguard deals
Hardware supply normalization
Hardware supply normalization in 2024 shortened chip lead times (roughly 25–35%), improving delivery timelines and enabling faster revenue recognition for Econocom while global semiconductor market activity rebounded in H1 2024.
Price normalization, however, compresses resale margins, shifting value towards higher-margin services, systems integration and refresh-as-a-service offerings.
Strict inventory discipline remains vital to avoid write-downs amid faster turnover and narrowing hardware spreads.
- lead-times: 25–35% shorter in 2024
- margin-pressure: resale compression accelerates service pivot
- strategy: focus on integration and refresh-as-a-service
- risk: inventory discipline to prevent write-downs
EU tech spending surge, procurement delays and tax shifts reshape IT supply and total cost
Rising rates (ECB ~4.00%, 12m Euribor ~3.8% mid‑2025) increase lease pricing, shifting buyer preference to capex and pressuring deal flow; rate cuts would reverse this. 2023 revenue €2.03bn shows resilience; 2024 chip lead‑time improvement ~25–35% sped recognition but compressed hardware resale margins. FX exposure and labour inflation necessitate hedges, price‑pass through and contract indexation to protect EBIT.
| Metric | Value |
|---|---|
| ECB rate | ~4.00% (mid‑2025) |
| 12m Euribor | ~3.8% (mid‑2025) |
| Revenue | €2.03bn (2023) |
| Lead‑time change | −25–35% (2024) |
Preview Before You Purchase
Econocom Group PESTLE Analysis
The Econocom Group PESTLE Analysis shown here is the exact, fully formatted document you’ll receive after purchase—professionally structured and ready to use. The preview displays the complete content and layout with no placeholders or omissions. After checkout you’ll instantly download this same final file. Use it as-is for research, presentations, or strategy planning.

Plan Smarter. Present Sharper. Compete Stronger.
Discover how political shifts, economic cycles, and rapid tech disruption shape Econocom Group’s strategic outlook. This concise PESTLE highlights regulatory risks, market opportunities, and sustainability pressures that matter to investors and planners. Buy the full analysis for the complete, editable report and actionable recommendations to guide smarter decisions.
Political factors
EU digital policy shaping demand
EU pushes on digital sovereignty, cloud adoption and public-sector modernization expand project pipelines for integrators like Econocom, supported by NextGenerationEU (€806.9bn) and the Digital Europe Programme (€7.5bn) funding envelopes that accelerate health, education and government deployments. Alignment with Gaia‑X principles is increasingly a commercial differentiator for public tenders. Policy shifts or implementation delays can quickly stall or redirect spending.
Public procurement and tender dynamics
Large digital projects often route through regulated tenders: EU public procurement totals about €2 trillion annually (~14% of GDP), driving strict compliance, localization and value‑for‑money clauses. Mastering framework agreements and consortiums can secure multi‑year revenues, while award processes frequently take 6–12 months, lengthening sales cycles and cash conversion. Political shifts can reprioritize budgets mid‑cycle.
Geopolitical supply-chain exposure
Technology sourcing for Econocom is exposed to global hardware and semiconductor chains—global chip sales were $573 billion in 2023 (WSTS) and trade tensions/export controls since 2022 have tightened access to advanced nodes. Lead-time volatility, which peaked near 26 weeks in 2021 and averaged ~14 weeks in 2024 (S&P Global), disrupts deliveries and revenue recognition. Multi-vendor sourcing and buffer inventory reduce risk while ~60% of enterprise buyers in 2024 surveys request origin transparency and sovereign options.
Subsidies and incentives for green/secure IT
National and EU incentives for energy‑efficient infrastructure, cybersecurity and digital skills—backed by programmes like NextGenerationEU (€723.8bn) and Digital Europe (€7.5bn)—can materially improve project ROI for Econocom clients.
- Integrators bundling financing capture incentives faster
- Monitor country schemes continuously
- RRF measures largely run to 2026—plan for sunsets
- Sunset risk = potential demand cliffs
Tax and fiscal policy across markets
Changes in VAT and digital services taxes alter client total cost of ownership, with EU average VAT around 21% and many jurisdictions introducing DSTs alongside the OECD Pillar Two 15% global minimum tax rolled out 2023–2024; investment allowances and fiscal tightening drive volatility in public IT budgets, while stimulus can boost procurement. Cross‑border operations face rising transfer pricing audits, forcing tax‑efficient compliant financing structures.
EU tech spending surge, procurement delays and tax shifts reshape IT supply and total cost
EU digital sovereignty, NextGenerationEU €806.9bn and Digital Europe €7.5bn expand public IT pipelines; public procurement ~€2tn/yr lengthens sales cycles. Supply‑chain controls, global chip sales $573bn (2023) and 14‑week avg lead times (2024) raise delivery risk. Tax shifts: OECD Pillar Two 15% from 2023 and EU VAT ~21% affect TCO.
| Metric | Value |
|---|---|
| NextGenerationEU | €806.9bn |
| Digital Europe | €7.5bn |
| EU procurement | ~€2tn/yr |
| Chip sales (2023) | $573bn |
| Avg lead time (2024) | ~14 weeks |
| OECD Pillar Two | 15% |
| EU VAT avg | ~21% |
What is included in the product
Detailed Word Document
Explores how Political, Economic, Social, Technological, Environmental and Legal forces uniquely affect Econocom Group, with data-driven, region- and industry-specific insights; designed for executives and investors to spot risks, opportunities and inform scenario-based strategy, ready for direct insertion into reports and pitch materials.
Customizable Excel Spreadsheet
A concise, visually segmented PESTLE summary of Econocom Group that relieves preparation pain by making external risks and market positioning instantly accessible. Editable notes and shareable format streamline team alignment and presentations.
Economic factors
Interest rates impact tech financing
Econocom’s design‑finance‑operate model is highly sensitive to funding costs: with the ECB policy rate at about 4.00% and 12‑month Euribor near 3.8% in mid‑2025, higher rates increase lease pricing and can push clients from opex leases toward capex purchases. Active balance‑sheet management, including asset rotation and interest‑rate hedges, has preserved margins. Conversely, any rate cuts would likely reaccelerate project intake and generate refinancing gains.
Corporate IT spending cycles
Macro slowdowns delay large transformation programs while productivity and resilience mandates sustain core IT spend. CFOs prioritize quick‑payback projects, managed services and FinOps, and diversification across sectors smooths client cyclicality. Backlog quality and renewal rates are key leading indicators; Econocom reported 2023 revenue €2.03bn, underscoring resilience.
Inflation and wage pressure
Talent-driven cost inflation compresses Econocom services margins where contracts lack indexation, forcing tighter pricing discipline. Price-rise pass-through and productivity tooling are critical to protect EBIT, while vendor rebates and lifecycle services help offset margin pressure. Long-term contracts require clear escalation mechanisms to maintain margin resilience amid rising labour costs.
FX exposure in pan‑European operations
Revenues and costs span EUR and non-EUR markets, creating translation and transaction risks that can affect reported margins and cash flows.
Hedging policies and natural currency offsets limit volatility; USD-priced hardware from vendors can squeeze margins when the euro weakens, so transparent FX clauses in contracts protect deal economics.
- FX translation and transaction risk
- Hedging and natural offsets reduce volatility
- USD vendor pricing pressures margins
- Transparent FX clauses safeguard deals
Hardware supply normalization
Hardware supply normalization in 2024 shortened chip lead times (roughly 25–35%), improving delivery timelines and enabling faster revenue recognition for Econocom while global semiconductor market activity rebounded in H1 2024.
Price normalization, however, compresses resale margins, shifting value towards higher-margin services, systems integration and refresh-as-a-service offerings.
Strict inventory discipline remains vital to avoid write-downs amid faster turnover and narrowing hardware spreads.
- lead-times: 25–35% shorter in 2024
- margin-pressure: resale compression accelerates service pivot
- strategy: focus on integration and refresh-as-a-service
- risk: inventory discipline to prevent write-downs
EU tech spending surge, procurement delays and tax shifts reshape IT supply and total cost
Rising rates (ECB ~4.00%, 12m Euribor ~3.8% mid‑2025) increase lease pricing, shifting buyer preference to capex and pressuring deal flow; rate cuts would reverse this. 2023 revenue €2.03bn shows resilience; 2024 chip lead‑time improvement ~25–35% sped recognition but compressed hardware resale margins. FX exposure and labour inflation necessitate hedges, price‑pass through and contract indexation to protect EBIT.
| Metric | Value |
|---|---|
| ECB rate | ~4.00% (mid‑2025) |
| 12m Euribor | ~3.8% (mid‑2025) |
| Revenue | €2.03bn (2023) |
| Lead‑time change | −25–35% (2024) |
Preview Before You Purchase
Econocom Group PESTLE Analysis
The Econocom Group PESTLE Analysis shown here is the exact, fully formatted document you’ll receive after purchase—professionally structured and ready to use. The preview displays the complete content and layout with no placeholders or omissions. After checkout you’ll instantly download this same final file. Use it as-is for research, presentations, or strategy planning.
Description
Plan Smarter. Present Sharper. Compete Stronger.
Discover how political shifts, economic cycles, and rapid tech disruption shape Econocom Group’s strategic outlook. This concise PESTLE highlights regulatory risks, market opportunities, and sustainability pressures that matter to investors and planners. Buy the full analysis for the complete, editable report and actionable recommendations to guide smarter decisions.
Political factors
EU digital policy shaping demand
EU pushes on digital sovereignty, cloud adoption and public-sector modernization expand project pipelines for integrators like Econocom, supported by NextGenerationEU (€806.9bn) and the Digital Europe Programme (€7.5bn) funding envelopes that accelerate health, education and government deployments. Alignment with Gaia‑X principles is increasingly a commercial differentiator for public tenders. Policy shifts or implementation delays can quickly stall or redirect spending.
Public procurement and tender dynamics
Large digital projects often route through regulated tenders: EU public procurement totals about €2 trillion annually (~14% of GDP), driving strict compliance, localization and value‑for‑money clauses. Mastering framework agreements and consortiums can secure multi‑year revenues, while award processes frequently take 6–12 months, lengthening sales cycles and cash conversion. Political shifts can reprioritize budgets mid‑cycle.
Geopolitical supply-chain exposure
Technology sourcing for Econocom is exposed to global hardware and semiconductor chains—global chip sales were $573 billion in 2023 (WSTS) and trade tensions/export controls since 2022 have tightened access to advanced nodes. Lead-time volatility, which peaked near 26 weeks in 2021 and averaged ~14 weeks in 2024 (S&P Global), disrupts deliveries and revenue recognition. Multi-vendor sourcing and buffer inventory reduce risk while ~60% of enterprise buyers in 2024 surveys request origin transparency and sovereign options.
Subsidies and incentives for green/secure IT
National and EU incentives for energy‑efficient infrastructure, cybersecurity and digital skills—backed by programmes like NextGenerationEU (€723.8bn) and Digital Europe (€7.5bn)—can materially improve project ROI for Econocom clients.
- Integrators bundling financing capture incentives faster
- Monitor country schemes continuously
- RRF measures largely run to 2026—plan for sunsets
- Sunset risk = potential demand cliffs
Tax and fiscal policy across markets
Changes in VAT and digital services taxes alter client total cost of ownership, with EU average VAT around 21% and many jurisdictions introducing DSTs alongside the OECD Pillar Two 15% global minimum tax rolled out 2023–2024; investment allowances and fiscal tightening drive volatility in public IT budgets, while stimulus can boost procurement. Cross‑border operations face rising transfer pricing audits, forcing tax‑efficient compliant financing structures.
EU tech spending surge, procurement delays and tax shifts reshape IT supply and total cost
EU digital sovereignty, NextGenerationEU €806.9bn and Digital Europe €7.5bn expand public IT pipelines; public procurement ~€2tn/yr lengthens sales cycles. Supply‑chain controls, global chip sales $573bn (2023) and 14‑week avg lead times (2024) raise delivery risk. Tax shifts: OECD Pillar Two 15% from 2023 and EU VAT ~21% affect TCO.
| Metric | Value |
|---|---|
| NextGenerationEU | €806.9bn |
| Digital Europe | €7.5bn |
| EU procurement | ~€2tn/yr |
| Chip sales (2023) | $573bn |
| Avg lead time (2024) | ~14 weeks |
| OECD Pillar Two | 15% |
| EU VAT avg | ~21% |
What is included in the product
Detailed Word Document
Explores how Political, Economic, Social, Technological, Environmental and Legal forces uniquely affect Econocom Group, with data-driven, region- and industry-specific insights; designed for executives and investors to spot risks, opportunities and inform scenario-based strategy, ready for direct insertion into reports and pitch materials.
Customizable Excel Spreadsheet
A concise, visually segmented PESTLE summary of Econocom Group that relieves preparation pain by making external risks and market positioning instantly accessible. Editable notes and shareable format streamline team alignment and presentations.
Economic factors
Interest rates impact tech financing
Econocom’s design‑finance‑operate model is highly sensitive to funding costs: with the ECB policy rate at about 4.00% and 12‑month Euribor near 3.8% in mid‑2025, higher rates increase lease pricing and can push clients from opex leases toward capex purchases. Active balance‑sheet management, including asset rotation and interest‑rate hedges, has preserved margins. Conversely, any rate cuts would likely reaccelerate project intake and generate refinancing gains.
Corporate IT spending cycles
Macro slowdowns delay large transformation programs while productivity and resilience mandates sustain core IT spend. CFOs prioritize quick‑payback projects, managed services and FinOps, and diversification across sectors smooths client cyclicality. Backlog quality and renewal rates are key leading indicators; Econocom reported 2023 revenue €2.03bn, underscoring resilience.
Inflation and wage pressure
Talent-driven cost inflation compresses Econocom services margins where contracts lack indexation, forcing tighter pricing discipline. Price-rise pass-through and productivity tooling are critical to protect EBIT, while vendor rebates and lifecycle services help offset margin pressure. Long-term contracts require clear escalation mechanisms to maintain margin resilience amid rising labour costs.
FX exposure in pan‑European operations
Revenues and costs span EUR and non-EUR markets, creating translation and transaction risks that can affect reported margins and cash flows.
Hedging policies and natural currency offsets limit volatility; USD-priced hardware from vendors can squeeze margins when the euro weakens, so transparent FX clauses in contracts protect deal economics.
- FX translation and transaction risk
- Hedging and natural offsets reduce volatility
- USD vendor pricing pressures margins
- Transparent FX clauses safeguard deals
Hardware supply normalization
Hardware supply normalization in 2024 shortened chip lead times (roughly 25–35%), improving delivery timelines and enabling faster revenue recognition for Econocom while global semiconductor market activity rebounded in H1 2024.
Price normalization, however, compresses resale margins, shifting value towards higher-margin services, systems integration and refresh-as-a-service offerings.
Strict inventory discipline remains vital to avoid write-downs amid faster turnover and narrowing hardware spreads.
- lead-times: 25–35% shorter in 2024
- margin-pressure: resale compression accelerates service pivot
- strategy: focus on integration and refresh-as-a-service
- risk: inventory discipline to prevent write-downs
EU tech spending surge, procurement delays and tax shifts reshape IT supply and total cost
Rising rates (ECB ~4.00%, 12m Euribor ~3.8% mid‑2025) increase lease pricing, shifting buyer preference to capex and pressuring deal flow; rate cuts would reverse this. 2023 revenue €2.03bn shows resilience; 2024 chip lead‑time improvement ~25–35% sped recognition but compressed hardware resale margins. FX exposure and labour inflation necessitate hedges, price‑pass through and contract indexation to protect EBIT.
| Metric | Value |
|---|---|
| ECB rate | ~4.00% (mid‑2025) |
| 12m Euribor | ~3.8% (mid‑2025) |
| Revenue | €2.03bn (2023) |
| Lead‑time change | −25–35% (2024) |
Preview Before You Purchase
Econocom Group PESTLE Analysis
The Econocom Group PESTLE Analysis shown here is the exact, fully formatted document you’ll receive after purchase—professionally structured and ready to use. The preview displays the complete content and layout with no placeholders or omissions. After checkout you’ll instantly download this same final file. Use it as-is for research, presentations, or strategy planning.











