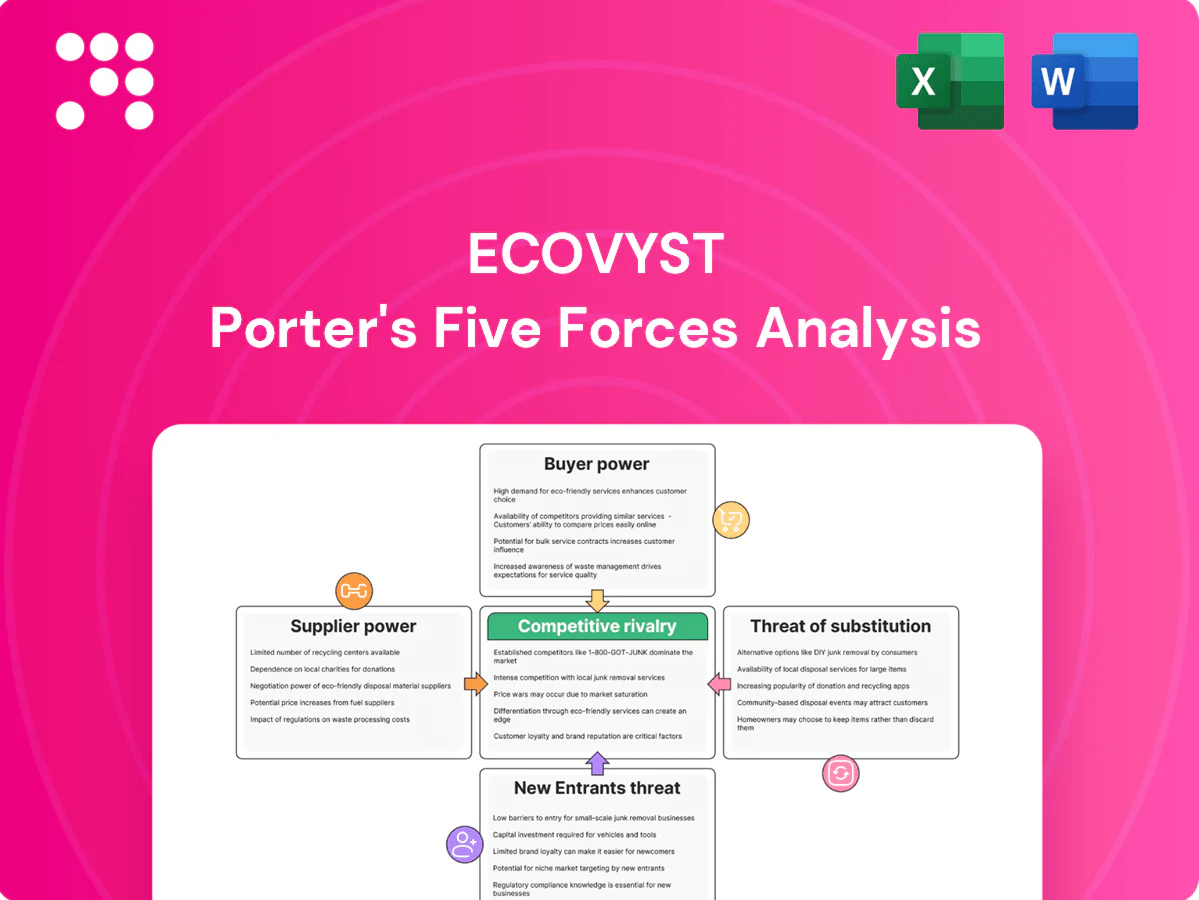
Ecovyst Porter's Five Forces Analysis

From Overview to Strategy Blueprint
Ecovyst faces moderate supplier power, cyclical end-market demand, and measurable barriers that limit new entrants; substitute threats and buyer leverage vary by segment, shaping margin pressure and strategic priorities. This brief snapshot only scratches the surface. Unlock the full Porter's Five Forces Analysis to explore Ecovyst’s competitive dynamics in detail.
Suppliers Bargaining Power

Critical mineral concentration
Many catalyst precursors (rare earths, specialty metals) are highly concentrated: China produced about 58% of rare earth oxide mine supply in 2023 and controls roughly 80–85% of processing, elevating price and availability risk. Geopolitical tensions and export controls have driven spot-price spikes and supply interruptions. Ecovyst can mitigate via forward contracts and dual sourcing, but qualifying alternative grades typically takes 6–18 months and can cost $1–3m.
Energy and utilities intensity
Ecovyst’s ecoservices and catalyst plants are highly energy-intensive, tying margins to electricity (~$0.074/kWh US industrial avg 2024) and natural gas (Henry Hub avg ~$2.79/MMBtu 2024) suppliers, giving those suppliers material influence. Fuel price spikes can compress margins if not hedged or passed through; long-term gas contracts and hedging programs materially reduce volatility exposure. Regional utility monopolies and limited local pipeline options constrain negotiating leverage.

Bulk chemical inputs
Inputs like silica, alumina and sodium silicate are largely commoditized with hundreds of global producers, which moderates supplier power versus specialty chemistries; however logistics, batch-to-batch specs and vendor qualification mean switching costs remain material, often implying multi-week lead times and formal supplier audits that create ongoing friction for Ecovyst.

Logistics and hazardous handling
Transport and handling of hazardous materials and spent acid require licensed carriers, specialized equipment and strict compliance; in 2024 the global chemical logistics market was approx $230 billion, highlighting concentration of capability and cost intensity. Fewer qualified logistics partners raise supplier power and schedule vulnerability; port, rail or truck disruptions can cascade into production delays. Proximity sourcing and dedicated fleets reduce disruption risk but typically raise logistics OPEX.
- Limited carriers → higher supplier leverage
- 2024 market ~230B USD
- Disruptions ripple into production
- Dedicated fleets/proximity reduce risk at higher cost
Equipment and maintenance OEMs
Equipment and maintenance OEMs supplying specialized reactors, filtration, and regeneration units create supplier lock-in for Ecovyst, elevating lifecycle parts and service costs and constraining bargaining leverage. Preventive maintenance and spare inventories mitigate downtime risk, while long-term service agreements often trade 5–10% price premiums for greater reliability. In 2024, industry aftermarket services represented roughly 35% of lifecycle value, highlighting OEM leverage.
- Specialized OEMs increase lifecycle costs and reduce negotiation power
- Preventive maintenance and inventories cut downtime risk
- Long-term service agreements trade ~5–10% price premium for reliability; aftermarket ≈35% of lifecycle value in 2024
Supplier power moderate-to-high: China rare-earth, energy exposure, long qualification
Supplier power for Ecovyst is moderate‑to‑high: rare‑earth/processors concentrated (China ~58% mine supply 2023; ~80–85% processing), energy exposure (US industrial electricity ~$0.074/kWh 2024; Henry Hub ~$2.79/MMBtu 2024), and specialized OEMs/logistics raise switching costs and premium pricing; qualification takes 6–18 months and ~$1–3m.
| Metric | 2023/2024 |
|---|---|
| China rare earth mine share | 58% (2023) |
| Processing control | 80–85% |
| US industrial electricity | $0.074/kWh (2024) |
| Henry Hub gas | $2.79/MMBtu (2024) |
| Logistics market | $230B (2024) |
| OEM aftermarket value | ~35% lifecycle (2024) |
What is included in the product
 Detailed Word Document
Tailored Porter’s Five Forces analysis for Ecovyst, assessing competitive rivalry, supplier and buyer power, threat of substitutes and new entrants, and identifying key disruptors and pricing pressures.

 Customizable Excel Spreadsheet
One-sheet Porter's Five Forces for Ecovyst that clearly maps supplier, buyer, entrant and regulatory pressures—customizable pressure levels and radar output make it perfect for quick strategic decisions or drop‑into pitch decks.
Customers Bargaining Power

Consolidated refinery customers
Large refiners and petrochemical majors such as integrated oil companies command substantial volume and negotiating leverage over Ecovyst, routinely running competitive tenders and insisting on service-level guarantees and performance metrics.
Price sensitivity spikes during downcycles as crack spreads compress, forcing intense price negotiations and shorter contract tenors.
Long-term relationships supported by plant performance data and proven product efficacy tend to reduce churn and stabilize margins for Ecovyst despite buyer concentration.
High qualification switching costs
Catalyst changeovers require rigorous trials and process re-optimization, commonly taking 3–12 months and generating technical and operational switching costs that can reach low six-figure levels for industrial users. Approved-vendor lists and qualification programs frequently lock in incumbents, limiting buyer leverage. Price discounts alone rarely overcome perceived performance and reliability risks, especially where downtime or yield losses would materially erode margins.

Contracted services with pass-throughs
Ecovyst’s ecosystem services rely on multi-year contracts with index-based pass-throughs for energy and feedstock, a model cited in its 2024 SEC filings as stabilizing gross margin exposure while creating benchmarking pressure.
Buyers in 2024 increasingly demanded higher uptime, faster turnarounds and stricter environmental compliance, shifting commercial negotiations toward KPI-linked terms.
Repeated KPI misses in 2024 empowered customers to seek price concessions, stricter SLAs or alternative suppliers, increasing buyer bargaining power.

Customization and co-development
Tailored catalyst formulations embed Ecovyst into customer processes, creating high switching costs while making Ecovyst a visible line-item in OEM and refinery budgets. Co-developed solutions amplify customer dependence but raise scrutiny on cost, lead times and contractual KPIs. Field technical service and performance data strengthen stickiness, yet buyers use measured performance to press for price concessions at renewal.
- Embedding: long switching costs
- Co-development: dependency vs cost scrutiny
- Service: operational stickiness
- Data: leverage in renegotiations
Demand cyclicality and mix
Refining and polymer cycles drive buyer timing and inventory swings; in downturns customers push for price concessions and extended payment terms, pressuring margins. The shift toward chemicals and cleaner fuels is changing product mix, often improving margins for specialty additives while compressing bulk catalyst pricing. Ecovyst’s diversified portfolio across refining, polymers and emissions control helps balance these cyclical customer power shifts.
- Cycle-driven order timing
- Downturns = price + payment pressure
- Cleaner fuels shift mix/margins
- Diversification cushions bargaining power
Large refiners squeeze suppliers at renewals with 3-5-year tech contracts
Large integrated refiners exert strong leverage through volume purchasing, competitive tenders and SLA demands, especially in downcycles.
Long-term, tech-embedded contracts (typical tenors 3–5 years) and six-figure switching costs limit churn but give buyers bargaining chips at renewals.
2024 trends: KPI-linked terms, index pass-throughs and demand for faster turnarounds increased buyer pressure.
| Metric | 2024 datapoint |
|---|---|
| Contract tenor | 3–5 years |
| Switching cost | Low six-figures |
| Commercial pressure | Higher KPI/linkage |
Same Document Delivered
Ecovyst Porter's Five Forces Analysis
This preview shows the exact Ecovyst Porter's Five Forces Analysis you'll receive immediately after purchase—no placeholders or mockups. The document displayed is the professionally written, fully formatted file ready for download and use the moment you buy. You're viewing the final deliverable; completion of payment grants instant access to this same comprehensive analysis.

From Overview to Strategy Blueprint
Ecovyst faces moderate supplier power, cyclical end-market demand, and measurable barriers that limit new entrants; substitute threats and buyer leverage vary by segment, shaping margin pressure and strategic priorities. This brief snapshot only scratches the surface. Unlock the full Porter's Five Forces Analysis to explore Ecovyst’s competitive dynamics in detail.
Suppliers Bargaining Power
Critical mineral concentration
Many catalyst precursors (rare earths, specialty metals) are highly concentrated: China produced about 58% of rare earth oxide mine supply in 2023 and controls roughly 80–85% of processing, elevating price and availability risk. Geopolitical tensions and export controls have driven spot-price spikes and supply interruptions. Ecovyst can mitigate via forward contracts and dual sourcing, but qualifying alternative grades typically takes 6–18 months and can cost $1–3m.
Energy and utilities intensity
Ecovyst’s ecoservices and catalyst plants are highly energy-intensive, tying margins to electricity (~$0.074/kWh US industrial avg 2024) and natural gas (Henry Hub avg ~$2.79/MMBtu 2024) suppliers, giving those suppliers material influence. Fuel price spikes can compress margins if not hedged or passed through; long-term gas contracts and hedging programs materially reduce volatility exposure. Regional utility monopolies and limited local pipeline options constrain negotiating leverage.
Bulk chemical inputs
Inputs like silica, alumina and sodium silicate are largely commoditized with hundreds of global producers, which moderates supplier power versus specialty chemistries; however logistics, batch-to-batch specs and vendor qualification mean switching costs remain material, often implying multi-week lead times and formal supplier audits that create ongoing friction for Ecovyst.
Logistics and hazardous handling
Transport and handling of hazardous materials and spent acid require licensed carriers, specialized equipment and strict compliance; in 2024 the global chemical logistics market was approx $230 billion, highlighting concentration of capability and cost intensity. Fewer qualified logistics partners raise supplier power and schedule vulnerability; port, rail or truck disruptions can cascade into production delays. Proximity sourcing and dedicated fleets reduce disruption risk but typically raise logistics OPEX.
- Limited carriers → higher supplier leverage
- 2024 market ~230B USD
- Disruptions ripple into production
- Dedicated fleets/proximity reduce risk at higher cost
Equipment and maintenance OEMs
Equipment and maintenance OEMs supplying specialized reactors, filtration, and regeneration units create supplier lock-in for Ecovyst, elevating lifecycle parts and service costs and constraining bargaining leverage. Preventive maintenance and spare inventories mitigate downtime risk, while long-term service agreements often trade 5–10% price premiums for greater reliability. In 2024, industry aftermarket services represented roughly 35% of lifecycle value, highlighting OEM leverage.
- Specialized OEMs increase lifecycle costs and reduce negotiation power
- Preventive maintenance and inventories cut downtime risk
- Long-term service agreements trade ~5–10% price premium for reliability; aftermarket ≈35% of lifecycle value in 2024
Supplier power moderate-to-high: China rare-earth, energy exposure, long qualification
Supplier power for Ecovyst is moderate‑to‑high: rare‑earth/processors concentrated (China ~58% mine supply 2023; ~80–85% processing), energy exposure (US industrial electricity ~$0.074/kWh 2024; Henry Hub ~$2.79/MMBtu 2024), and specialized OEMs/logistics raise switching costs and premium pricing; qualification takes 6–18 months and ~$1–3m.
| Metric | 2023/2024 |
|---|---|
| China rare earth mine share | 58% (2023) |
| Processing control | 80–85% |
| US industrial electricity | $0.074/kWh (2024) |
| Henry Hub gas | $2.79/MMBtu (2024) |
| Logistics market | $230B (2024) |
| OEM aftermarket value | ~35% lifecycle (2024) |
What is included in the product
Detailed Word Document
Tailored Porter’s Five Forces analysis for Ecovyst, assessing competitive rivalry, supplier and buyer power, threat of substitutes and new entrants, and identifying key disruptors and pricing pressures.
Customizable Excel Spreadsheet
One-sheet Porter's Five Forces for Ecovyst that clearly maps supplier, buyer, entrant and regulatory pressures—customizable pressure levels and radar output make it perfect for quick strategic decisions or drop‑into pitch decks.
Customers Bargaining Power
Consolidated refinery customers
Large refiners and petrochemical majors such as integrated oil companies command substantial volume and negotiating leverage over Ecovyst, routinely running competitive tenders and insisting on service-level guarantees and performance metrics.
Price sensitivity spikes during downcycles as crack spreads compress, forcing intense price negotiations and shorter contract tenors.
Long-term relationships supported by plant performance data and proven product efficacy tend to reduce churn and stabilize margins for Ecovyst despite buyer concentration.
High qualification switching costs
Catalyst changeovers require rigorous trials and process re-optimization, commonly taking 3–12 months and generating technical and operational switching costs that can reach low six-figure levels for industrial users. Approved-vendor lists and qualification programs frequently lock in incumbents, limiting buyer leverage. Price discounts alone rarely overcome perceived performance and reliability risks, especially where downtime or yield losses would materially erode margins.
Contracted services with pass-throughs
Ecovyst’s ecosystem services rely on multi-year contracts with index-based pass-throughs for energy and feedstock, a model cited in its 2024 SEC filings as stabilizing gross margin exposure while creating benchmarking pressure.
Buyers in 2024 increasingly demanded higher uptime, faster turnarounds and stricter environmental compliance, shifting commercial negotiations toward KPI-linked terms.
Repeated KPI misses in 2024 empowered customers to seek price concessions, stricter SLAs or alternative suppliers, increasing buyer bargaining power.
Customization and co-development
Tailored catalyst formulations embed Ecovyst into customer processes, creating high switching costs while making Ecovyst a visible line-item in OEM and refinery budgets. Co-developed solutions amplify customer dependence but raise scrutiny on cost, lead times and contractual KPIs. Field technical service and performance data strengthen stickiness, yet buyers use measured performance to press for price concessions at renewal.
- Embedding: long switching costs
- Co-development: dependency vs cost scrutiny
- Service: operational stickiness
- Data: leverage in renegotiations
Demand cyclicality and mix
Refining and polymer cycles drive buyer timing and inventory swings; in downturns customers push for price concessions and extended payment terms, pressuring margins. The shift toward chemicals and cleaner fuels is changing product mix, often improving margins for specialty additives while compressing bulk catalyst pricing. Ecovyst’s diversified portfolio across refining, polymers and emissions control helps balance these cyclical customer power shifts.
- Cycle-driven order timing
- Downturns = price + payment pressure
- Cleaner fuels shift mix/margins
- Diversification cushions bargaining power
Large refiners squeeze suppliers at renewals with 3-5-year tech contracts
Large integrated refiners exert strong leverage through volume purchasing, competitive tenders and SLA demands, especially in downcycles.
Long-term, tech-embedded contracts (typical tenors 3–5 years) and six-figure switching costs limit churn but give buyers bargaining chips at renewals.
2024 trends: KPI-linked terms, index pass-throughs and demand for faster turnarounds increased buyer pressure.
| Metric | 2024 datapoint |
|---|---|
| Contract tenor | 3–5 years |
| Switching cost | Low six-figures |
| Commercial pressure | Higher KPI/linkage |
Same Document Delivered
Ecovyst Porter's Five Forces Analysis
This preview shows the exact Ecovyst Porter's Five Forces Analysis you'll receive immediately after purchase—no placeholders or mockups. The document displayed is the professionally written, fully formatted file ready for download and use the moment you buy. You're viewing the final deliverable; completion of payment grants instant access to this same comprehensive analysis.
Original: $10.00
-65%$10.00
$3.50Description
From Overview to Strategy Blueprint
Ecovyst faces moderate supplier power, cyclical end-market demand, and measurable barriers that limit new entrants; substitute threats and buyer leverage vary by segment, shaping margin pressure and strategic priorities. This brief snapshot only scratches the surface. Unlock the full Porter's Five Forces Analysis to explore Ecovyst’s competitive dynamics in detail.
Suppliers Bargaining Power
Critical mineral concentration
Many catalyst precursors (rare earths, specialty metals) are highly concentrated: China produced about 58% of rare earth oxide mine supply in 2023 and controls roughly 80–85% of processing, elevating price and availability risk. Geopolitical tensions and export controls have driven spot-price spikes and supply interruptions. Ecovyst can mitigate via forward contracts and dual sourcing, but qualifying alternative grades typically takes 6–18 months and can cost $1–3m.
Energy and utilities intensity
Ecovyst’s ecoservices and catalyst plants are highly energy-intensive, tying margins to electricity (~$0.074/kWh US industrial avg 2024) and natural gas (Henry Hub avg ~$2.79/MMBtu 2024) suppliers, giving those suppliers material influence. Fuel price spikes can compress margins if not hedged or passed through; long-term gas contracts and hedging programs materially reduce volatility exposure. Regional utility monopolies and limited local pipeline options constrain negotiating leverage.
Bulk chemical inputs
Inputs like silica, alumina and sodium silicate are largely commoditized with hundreds of global producers, which moderates supplier power versus specialty chemistries; however logistics, batch-to-batch specs and vendor qualification mean switching costs remain material, often implying multi-week lead times and formal supplier audits that create ongoing friction for Ecovyst.
Logistics and hazardous handling
Transport and handling of hazardous materials and spent acid require licensed carriers, specialized equipment and strict compliance; in 2024 the global chemical logistics market was approx $230 billion, highlighting concentration of capability and cost intensity. Fewer qualified logistics partners raise supplier power and schedule vulnerability; port, rail or truck disruptions can cascade into production delays. Proximity sourcing and dedicated fleets reduce disruption risk but typically raise logistics OPEX.
- Limited carriers → higher supplier leverage
- 2024 market ~230B USD
- Disruptions ripple into production
- Dedicated fleets/proximity reduce risk at higher cost
Equipment and maintenance OEMs
Equipment and maintenance OEMs supplying specialized reactors, filtration, and regeneration units create supplier lock-in for Ecovyst, elevating lifecycle parts and service costs and constraining bargaining leverage. Preventive maintenance and spare inventories mitigate downtime risk, while long-term service agreements often trade 5–10% price premiums for greater reliability. In 2024, industry aftermarket services represented roughly 35% of lifecycle value, highlighting OEM leverage.
- Specialized OEMs increase lifecycle costs and reduce negotiation power
- Preventive maintenance and inventories cut downtime risk
- Long-term service agreements trade ~5–10% price premium for reliability; aftermarket ≈35% of lifecycle value in 2024
Supplier power moderate-to-high: China rare-earth, energy exposure, long qualification
Supplier power for Ecovyst is moderate‑to‑high: rare‑earth/processors concentrated (China ~58% mine supply 2023; ~80–85% processing), energy exposure (US industrial electricity ~$0.074/kWh 2024; Henry Hub ~$2.79/MMBtu 2024), and specialized OEMs/logistics raise switching costs and premium pricing; qualification takes 6–18 months and ~$1–3m.
| Metric | 2023/2024 |
|---|---|
| China rare earth mine share | 58% (2023) |
| Processing control | 80–85% |
| US industrial electricity | $0.074/kWh (2024) |
| Henry Hub gas | $2.79/MMBtu (2024) |
| Logistics market | $230B (2024) |
| OEM aftermarket value | ~35% lifecycle (2024) |
What is included in the product
Detailed Word Document
Tailored Porter’s Five Forces analysis for Ecovyst, assessing competitive rivalry, supplier and buyer power, threat of substitutes and new entrants, and identifying key disruptors and pricing pressures.
Customizable Excel Spreadsheet
One-sheet Porter's Five Forces for Ecovyst that clearly maps supplier, buyer, entrant and regulatory pressures—customizable pressure levels and radar output make it perfect for quick strategic decisions or drop‑into pitch decks.
Customers Bargaining Power
Consolidated refinery customers
Large refiners and petrochemical majors such as integrated oil companies command substantial volume and negotiating leverage over Ecovyst, routinely running competitive tenders and insisting on service-level guarantees and performance metrics.
Price sensitivity spikes during downcycles as crack spreads compress, forcing intense price negotiations and shorter contract tenors.
Long-term relationships supported by plant performance data and proven product efficacy tend to reduce churn and stabilize margins for Ecovyst despite buyer concentration.
High qualification switching costs
Catalyst changeovers require rigorous trials and process re-optimization, commonly taking 3–12 months and generating technical and operational switching costs that can reach low six-figure levels for industrial users. Approved-vendor lists and qualification programs frequently lock in incumbents, limiting buyer leverage. Price discounts alone rarely overcome perceived performance and reliability risks, especially where downtime or yield losses would materially erode margins.
Contracted services with pass-throughs
Ecovyst’s ecosystem services rely on multi-year contracts with index-based pass-throughs for energy and feedstock, a model cited in its 2024 SEC filings as stabilizing gross margin exposure while creating benchmarking pressure.
Buyers in 2024 increasingly demanded higher uptime, faster turnarounds and stricter environmental compliance, shifting commercial negotiations toward KPI-linked terms.
Repeated KPI misses in 2024 empowered customers to seek price concessions, stricter SLAs or alternative suppliers, increasing buyer bargaining power.
Customization and co-development
Tailored catalyst formulations embed Ecovyst into customer processes, creating high switching costs while making Ecovyst a visible line-item in OEM and refinery budgets. Co-developed solutions amplify customer dependence but raise scrutiny on cost, lead times and contractual KPIs. Field technical service and performance data strengthen stickiness, yet buyers use measured performance to press for price concessions at renewal.
- Embedding: long switching costs
- Co-development: dependency vs cost scrutiny
- Service: operational stickiness
- Data: leverage in renegotiations
Demand cyclicality and mix
Refining and polymer cycles drive buyer timing and inventory swings; in downturns customers push for price concessions and extended payment terms, pressuring margins. The shift toward chemicals and cleaner fuels is changing product mix, often improving margins for specialty additives while compressing bulk catalyst pricing. Ecovyst’s diversified portfolio across refining, polymers and emissions control helps balance these cyclical customer power shifts.
- Cycle-driven order timing
- Downturns = price + payment pressure
- Cleaner fuels shift mix/margins
- Diversification cushions bargaining power
Large refiners squeeze suppliers at renewals with 3-5-year tech contracts
Large integrated refiners exert strong leverage through volume purchasing, competitive tenders and SLA demands, especially in downcycles.
Long-term, tech-embedded contracts (typical tenors 3–5 years) and six-figure switching costs limit churn but give buyers bargaining chips at renewals.
2024 trends: KPI-linked terms, index pass-throughs and demand for faster turnarounds increased buyer pressure.
| Metric | 2024 datapoint |
|---|---|
| Contract tenor | 3–5 years |
| Switching cost | Low six-figures |
| Commercial pressure | Higher KPI/linkage |
Same Document Delivered
Ecovyst Porter's Five Forces Analysis
This preview shows the exact Ecovyst Porter's Five Forces Analysis you'll receive immediately after purchase—no placeholders or mockups. The document displayed is the professionally written, fully formatted file ready for download and use the moment you buy. You're viewing the final deliverable; completion of payment grants instant access to this same comprehensive analysis.











