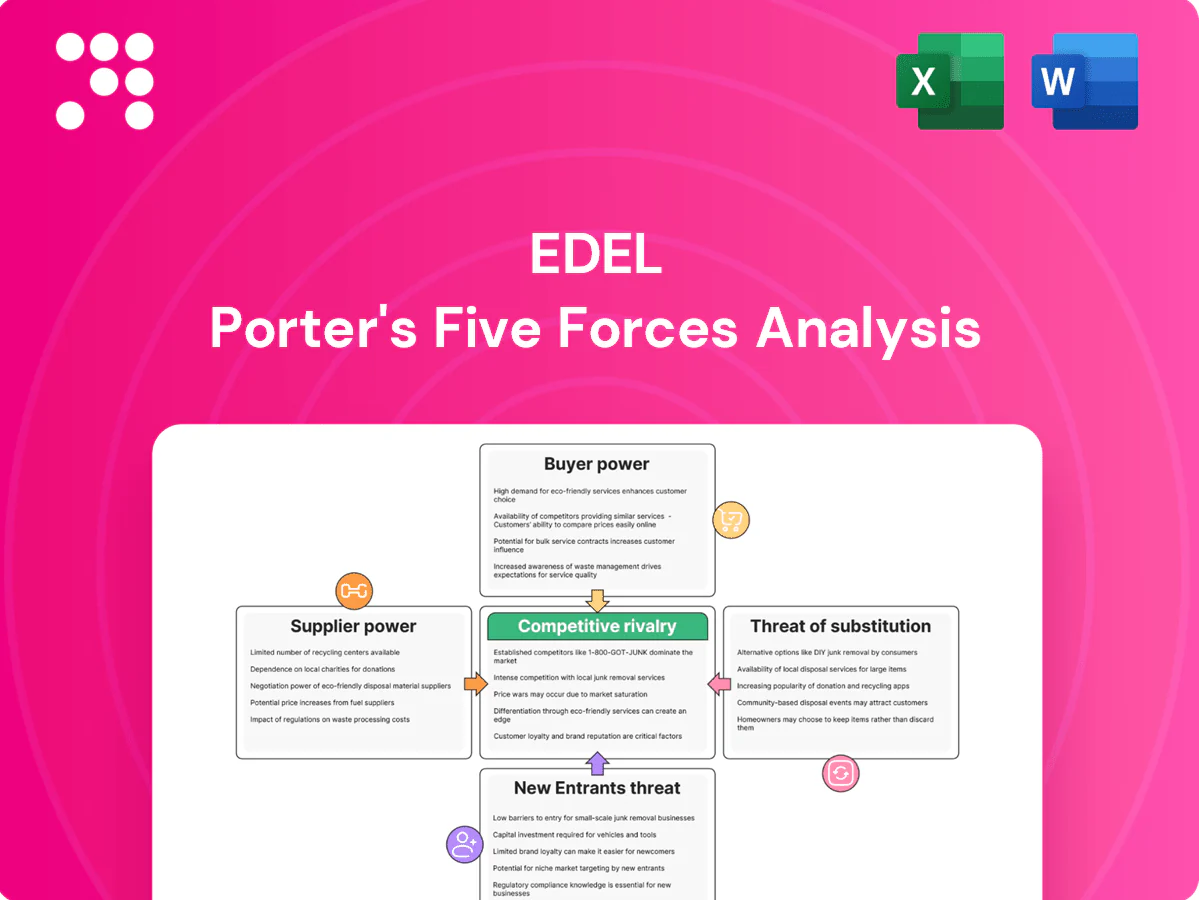
Edel Porter's Five Forces Analysis

A Must-Have Tool for Decision-Makers
Edel’s Porter’s Five Forces dissects competitive rivalry, supplier and buyer power, threats of new entrants and substitutes, and industry-specific pressures shaping margins and strategy. This concise snapshot highlights core competitive dynamics and vulnerabilities. Unlock the full Porter’s Five Forces Analysis for force-by-force ratings, visuals, and actionable strategic and investment insights.
Suppliers Bargaining Power

Hit-driven creators and rights holders
Artists, authors and IP owners with proven catalogs exert strong leverage over advances, royalty splits and windowing, especially for marquee assets; negotiations for exclusives and sync rights have intensified, lifting supplier power. Edel’s multi-genre portfolio reduces single-supplier exposure but star power remains concentrated. IFPI reported recorded music revenues of $26.2bn in 2023 with streaming ~83% of the mix, which amplifies value concentration in hit content. Long-tail lowers average supplier power but not for marquee rights.
Manufacturing capacity constraints
Vinyl pressing plants, CD/DVD manufacturers and high-quality printers have faced chronic backlogs, with industry reports in 2022–24 citing lead times of roughly 6–12 months and capacity utilization often above 90%. Scarcity drives higher prices and seasonal spikes in lead times. Edel’s scale and planning secure preferred slots but cannot fully negate these bottlenecks. Quality variation across plants further increases supplier leverage.

Studio, post-production, and specialized services
Mastering, editing, translation, and audiobook production vendors are specialized niche suppliers in a global audiobook market valued at about $4.2 billion in 2024 (Statista); professional audiobook production averages roughly $300–500 per finished hour in 2024, creating meaningful cost exposure for publishers.
Switching vendors is feasible but quality, delivery schedules, and language expertise often lock in relationships, while premium providers command higher fees for complex or multilingual titles; multi-vendor frameworks lower but do not eliminate dependency on specialized skills and timing.

Digital infrastructure and SaaS dependencies
Metadata delivery, DRM, analytics and content management platforms are core to digital distribution, and the global SaaS market topped roughly $200B by 2024, concentrating value in a few vendors. Vendor switching incurs months of integration, multi‑million-dollar engineering and operational risk, so pricing power skews to established providers with network effects. Long‑term contracts often lock favorable pricing but reduce flexibility and renegotiation options.
- Metadata/DRM/analytics: critical
- Switching: months + multi‑$M cost
- Pricing: concentrated, network effects
- Contracts: stabilize terms, limit agility
Licensing and collective management entities
Licensing bodies (PROs, CMOs, neighboring rights societies) set non-negotiable tariffs and terms, with streaming comprising about 70% of global music revenue in 2023–24, increasing negotiable exposure; cross-border collections raise compliance costs and administrative complexity. These entities can retroactively adjust rates, squeezing margins, so Edel must maintain robust rights administration to prevent leakage and reclaim royalties.
- Non-negotiable tariffs: PROs/CMOs
- Cross-border: higher compliance costs
- Retroactive rate changes: margin risk
- Mitigation: strong rights admin
Creators, DRM vendors and pressing bottlenecks squeeze margins across $26.2bn music market
Supplier power concentrated in hit creators and metadata/DRM vendors; IFPI recorded music revenues $26.2bn in 2023, streaming ~83%. Pressing/manufacturing capacity >90% utilization in 2022–24 with 6–12 month lead times. Audiobook market $4.2bn (2024); production $300–500 per finished hour; PRO/CMO tariffs and retroactive rate changes raise margin risk.
| Supplier | Impact | Key metric |
|---|---|---|
| Creators/IP | High leverage | IFPI $26.2bn (2023), streaming 83% |
| Manufacturing | Price/lead-time risk | Utilization >90%, 6–12m lead |
| Audiobook vendors | Cost exposure | $4.2bn market (2024), $300–500/hr |
| DRM/metadata | Switching cost | SaaS market >$200bn (2024) |
What is included in the product
 Detailed Word Document
Comprehensive Porter's Five Forces analysis tailored for Edel, uncovering competitive drivers, buyer and supplier power, entry barriers, substitutes, and disruptive threats to its market position.

 Customizable Excel Spreadsheet
Edel Porter's Five Forces delivers a one-sheet, editable dashboard that pinpoints competitive pressures and relieves analysis bottlenecks. Swap in your data, customize pressure levels, and export clean radar visuals for decks—no macros or finance expertise required.
Customers Bargaining Power

Dominant retail and platform gatekeepers
Dominant gatekeepers—Amazon (≈60% of US online book sales in 2024), Apple and Spotify (≈220 million premium subscribers in 2024) and major chains concentrate demand and press for lower prices and premium placement; their algorithms and shelf-space decisions materially shape sell-through, reducing Edel’s take-it-or-leave-it leverage and making preferential terms often contingent on co-funded marketing spend.
Price-sensitive end consumers
Streaming’s normalized low ARPU (~$5/month globally in 2024) has trained consumers to expect cheap access, making price the dominant leverage point; streaming now represents >80% of recorded consumption. Physical collectors pay 20–50% premiums for vinyl and special items but remain a niche. Discounting spikes around bestsellers and reissues, while bundles and limited editions recapture margin and reduce churn.

Institutional and wholesale buyers
Libraries, wholesalers and distributors demand volume discounts and return rights, with industry-standard return rates near 25% and credit terms commonly 30–60 days, pressuring Edel’s margins and cash conversion. Their ordering cycles and extended credit increase working capital needs and inventory risk. Title-performance risk shifts back via returns, while data-sharing mandates raise costs but can cut forecasting error and overstocks when integrated—empirically improving sell-through by ~10%.

Artists and label/author clients as service buyers
Edel sells distribution, marketing and logistics to labels and authors; sophisticated clients benchmark against global aggregators and majors (≈70% market share, IFPI 2024), strengthening customer bargaining power. Clients demand transparent dashboards and flexible contracts; multi-year deals typically exchange 3–8% price concessions for stability.
- clients benchmark vs majors/aggregators
- ≈70% market share for majors (IFPI 2024)
- transparent dashboards expected
- multi-year deals trade 3–8% price concession
International partners and licensors
International sub-publishers and rights partners commonly negotiate territory splits often around 50/50 and can reassign catalogs if fees or marketing commitments decline, so publishers face churn risk; performance clauses and monthly or quarterly reporting cadences materially affect retention; deep local market knowledge—radio, playlist and sync relationships—gives partners negotiating leverage.
Gatekeeper concentration and streaming dominance compress pricing, margins, and placement
Concentrated gatekeepers (Amazon ~60% US book online, 2024) and majors (≈70% market share, IFPI 2024) force price and placement concessions; streaming (>80% consumption) with ARPU ≈$5/month (2024) lowers pricing power. Return rates ~25% and 30–60 day credit terms compress margins; multi-year deals trade 3–8% discounts. Territory splits often near 50/50, with performance clauses driving churn.
| Metric | 2024 Value |
|---|---|
| Amazon share (US books) | ~60% |
| Majors market share | ≈70% |
| Streaming share | >80% |
| ARPU (streaming) | ≈$5/mo |
| Return rate | ~25% |
Preview Before You Purchase
Edel Porter's Five Forces Analysis
You’re viewing Edel Porter’s complete Porter’s Five Forces analysis and this preview is the exact document you’ll receive immediately after purchase. It’s fully formatted, professionally written and ready for use—no samples or placeholders. Instant download upon payment.

A Must-Have Tool for Decision-Makers
Edel’s Porter’s Five Forces dissects competitive rivalry, supplier and buyer power, threats of new entrants and substitutes, and industry-specific pressures shaping margins and strategy. This concise snapshot highlights core competitive dynamics and vulnerabilities. Unlock the full Porter’s Five Forces Analysis for force-by-force ratings, visuals, and actionable strategic and investment insights.
Suppliers Bargaining Power
Hit-driven creators and rights holders
Artists, authors and IP owners with proven catalogs exert strong leverage over advances, royalty splits and windowing, especially for marquee assets; negotiations for exclusives and sync rights have intensified, lifting supplier power. Edel’s multi-genre portfolio reduces single-supplier exposure but star power remains concentrated. IFPI reported recorded music revenues of $26.2bn in 2023 with streaming ~83% of the mix, which amplifies value concentration in hit content. Long-tail lowers average supplier power but not for marquee rights.
Manufacturing capacity constraints
Vinyl pressing plants, CD/DVD manufacturers and high-quality printers have faced chronic backlogs, with industry reports in 2022–24 citing lead times of roughly 6–12 months and capacity utilization often above 90%. Scarcity drives higher prices and seasonal spikes in lead times. Edel’s scale and planning secure preferred slots but cannot fully negate these bottlenecks. Quality variation across plants further increases supplier leverage.
Studio, post-production, and specialized services
Mastering, editing, translation, and audiobook production vendors are specialized niche suppliers in a global audiobook market valued at about $4.2 billion in 2024 (Statista); professional audiobook production averages roughly $300–500 per finished hour in 2024, creating meaningful cost exposure for publishers.
Switching vendors is feasible but quality, delivery schedules, and language expertise often lock in relationships, while premium providers command higher fees for complex or multilingual titles; multi-vendor frameworks lower but do not eliminate dependency on specialized skills and timing.
Digital infrastructure and SaaS dependencies
Metadata delivery, DRM, analytics and content management platforms are core to digital distribution, and the global SaaS market topped roughly $200B by 2024, concentrating value in a few vendors. Vendor switching incurs months of integration, multi‑million-dollar engineering and operational risk, so pricing power skews to established providers with network effects. Long‑term contracts often lock favorable pricing but reduce flexibility and renegotiation options.
- Metadata/DRM/analytics: critical
- Switching: months + multi‑$M cost
- Pricing: concentrated, network effects
- Contracts: stabilize terms, limit agility
Licensing and collective management entities
Licensing bodies (PROs, CMOs, neighboring rights societies) set non-negotiable tariffs and terms, with streaming comprising about 70% of global music revenue in 2023–24, increasing negotiable exposure; cross-border collections raise compliance costs and administrative complexity. These entities can retroactively adjust rates, squeezing margins, so Edel must maintain robust rights administration to prevent leakage and reclaim royalties.
- Non-negotiable tariffs: PROs/CMOs
- Cross-border: higher compliance costs
- Retroactive rate changes: margin risk
- Mitigation: strong rights admin
Creators, DRM vendors and pressing bottlenecks squeeze margins across $26.2bn music market
Supplier power concentrated in hit creators and metadata/DRM vendors; IFPI recorded music revenues $26.2bn in 2023, streaming ~83%. Pressing/manufacturing capacity >90% utilization in 2022–24 with 6–12 month lead times. Audiobook market $4.2bn (2024); production $300–500 per finished hour; PRO/CMO tariffs and retroactive rate changes raise margin risk.
| Supplier | Impact | Key metric |
|---|---|---|
| Creators/IP | High leverage | IFPI $26.2bn (2023), streaming 83% |
| Manufacturing | Price/lead-time risk | Utilization >90%, 6–12m lead |
| Audiobook vendors | Cost exposure | $4.2bn market (2024), $300–500/hr |
| DRM/metadata | Switching cost | SaaS market >$200bn (2024) |
What is included in the product
Detailed Word Document
Comprehensive Porter's Five Forces analysis tailored for Edel, uncovering competitive drivers, buyer and supplier power, entry barriers, substitutes, and disruptive threats to its market position.
Customizable Excel Spreadsheet
Edel Porter's Five Forces delivers a one-sheet, editable dashboard that pinpoints competitive pressures and relieves analysis bottlenecks. Swap in your data, customize pressure levels, and export clean radar visuals for decks—no macros or finance expertise required.
Customers Bargaining Power
Dominant retail and platform gatekeepers
Dominant gatekeepers—Amazon (≈60% of US online book sales in 2024), Apple and Spotify (≈220 million premium subscribers in 2024) and major chains concentrate demand and press for lower prices and premium placement; their algorithms and shelf-space decisions materially shape sell-through, reducing Edel’s take-it-or-leave-it leverage and making preferential terms often contingent on co-funded marketing spend.
Price-sensitive end consumers
Streaming’s normalized low ARPU (~$5/month globally in 2024) has trained consumers to expect cheap access, making price the dominant leverage point; streaming now represents >80% of recorded consumption. Physical collectors pay 20–50% premiums for vinyl and special items but remain a niche. Discounting spikes around bestsellers and reissues, while bundles and limited editions recapture margin and reduce churn.
Institutional and wholesale buyers
Libraries, wholesalers and distributors demand volume discounts and return rights, with industry-standard return rates near 25% and credit terms commonly 30–60 days, pressuring Edel’s margins and cash conversion. Their ordering cycles and extended credit increase working capital needs and inventory risk. Title-performance risk shifts back via returns, while data-sharing mandates raise costs but can cut forecasting error and overstocks when integrated—empirically improving sell-through by ~10%.
Artists and label/author clients as service buyers
Edel sells distribution, marketing and logistics to labels and authors; sophisticated clients benchmark against global aggregators and majors (≈70% market share, IFPI 2024), strengthening customer bargaining power. Clients demand transparent dashboards and flexible contracts; multi-year deals typically exchange 3–8% price concessions for stability.
- clients benchmark vs majors/aggregators
- ≈70% market share for majors (IFPI 2024)
- transparent dashboards expected
- multi-year deals trade 3–8% price concession
International partners and licensors
International sub-publishers and rights partners commonly negotiate territory splits often around 50/50 and can reassign catalogs if fees or marketing commitments decline, so publishers face churn risk; performance clauses and monthly or quarterly reporting cadences materially affect retention; deep local market knowledge—radio, playlist and sync relationships—gives partners negotiating leverage.
Gatekeeper concentration and streaming dominance compress pricing, margins, and placement
Concentrated gatekeepers (Amazon ~60% US book online, 2024) and majors (≈70% market share, IFPI 2024) force price and placement concessions; streaming (>80% consumption) with ARPU ≈$5/month (2024) lowers pricing power. Return rates ~25% and 30–60 day credit terms compress margins; multi-year deals trade 3–8% discounts. Territory splits often near 50/50, with performance clauses driving churn.
| Metric | 2024 Value |
|---|---|
| Amazon share (US books) | ~60% |
| Majors market share | ≈70% |
| Streaming share | >80% |
| ARPU (streaming) | ≈$5/mo |
| Return rate | ~25% |
Preview Before You Purchase
Edel Porter's Five Forces Analysis
You’re viewing Edel Porter’s complete Porter’s Five Forces analysis and this preview is the exact document you’ll receive immediately after purchase. It’s fully formatted, professionally written and ready for use—no samples or placeholders. Instant download upon payment.
Original: $10.00
-65%$10.00
$3.50Description
A Must-Have Tool for Decision-Makers
Edel’s Porter’s Five Forces dissects competitive rivalry, supplier and buyer power, threats of new entrants and substitutes, and industry-specific pressures shaping margins and strategy. This concise snapshot highlights core competitive dynamics and vulnerabilities. Unlock the full Porter’s Five Forces Analysis for force-by-force ratings, visuals, and actionable strategic and investment insights.
Suppliers Bargaining Power
Hit-driven creators and rights holders
Artists, authors and IP owners with proven catalogs exert strong leverage over advances, royalty splits and windowing, especially for marquee assets; negotiations for exclusives and sync rights have intensified, lifting supplier power. Edel’s multi-genre portfolio reduces single-supplier exposure but star power remains concentrated. IFPI reported recorded music revenues of $26.2bn in 2023 with streaming ~83% of the mix, which amplifies value concentration in hit content. Long-tail lowers average supplier power but not for marquee rights.
Manufacturing capacity constraints
Vinyl pressing plants, CD/DVD manufacturers and high-quality printers have faced chronic backlogs, with industry reports in 2022–24 citing lead times of roughly 6–12 months and capacity utilization often above 90%. Scarcity drives higher prices and seasonal spikes in lead times. Edel’s scale and planning secure preferred slots but cannot fully negate these bottlenecks. Quality variation across plants further increases supplier leverage.
Studio, post-production, and specialized services
Mastering, editing, translation, and audiobook production vendors are specialized niche suppliers in a global audiobook market valued at about $4.2 billion in 2024 (Statista); professional audiobook production averages roughly $300–500 per finished hour in 2024, creating meaningful cost exposure for publishers.
Switching vendors is feasible but quality, delivery schedules, and language expertise often lock in relationships, while premium providers command higher fees for complex or multilingual titles; multi-vendor frameworks lower but do not eliminate dependency on specialized skills and timing.
Digital infrastructure and SaaS dependencies
Metadata delivery, DRM, analytics and content management platforms are core to digital distribution, and the global SaaS market topped roughly $200B by 2024, concentrating value in a few vendors. Vendor switching incurs months of integration, multi‑million-dollar engineering and operational risk, so pricing power skews to established providers with network effects. Long‑term contracts often lock favorable pricing but reduce flexibility and renegotiation options.
- Metadata/DRM/analytics: critical
- Switching: months + multi‑$M cost
- Pricing: concentrated, network effects
- Contracts: stabilize terms, limit agility
Licensing and collective management entities
Licensing bodies (PROs, CMOs, neighboring rights societies) set non-negotiable tariffs and terms, with streaming comprising about 70% of global music revenue in 2023–24, increasing negotiable exposure; cross-border collections raise compliance costs and administrative complexity. These entities can retroactively adjust rates, squeezing margins, so Edel must maintain robust rights administration to prevent leakage and reclaim royalties.
- Non-negotiable tariffs: PROs/CMOs
- Cross-border: higher compliance costs
- Retroactive rate changes: margin risk
- Mitigation: strong rights admin
Creators, DRM vendors and pressing bottlenecks squeeze margins across $26.2bn music market
Supplier power concentrated in hit creators and metadata/DRM vendors; IFPI recorded music revenues $26.2bn in 2023, streaming ~83%. Pressing/manufacturing capacity >90% utilization in 2022–24 with 6–12 month lead times. Audiobook market $4.2bn (2024); production $300–500 per finished hour; PRO/CMO tariffs and retroactive rate changes raise margin risk.
| Supplier | Impact | Key metric |
|---|---|---|
| Creators/IP | High leverage | IFPI $26.2bn (2023), streaming 83% |
| Manufacturing | Price/lead-time risk | Utilization >90%, 6–12m lead |
| Audiobook vendors | Cost exposure | $4.2bn market (2024), $300–500/hr |
| DRM/metadata | Switching cost | SaaS market >$200bn (2024) |
What is included in the product
Detailed Word Document
Comprehensive Porter's Five Forces analysis tailored for Edel, uncovering competitive drivers, buyer and supplier power, entry barriers, substitutes, and disruptive threats to its market position.
Customizable Excel Spreadsheet
Edel Porter's Five Forces delivers a one-sheet, editable dashboard that pinpoints competitive pressures and relieves analysis bottlenecks. Swap in your data, customize pressure levels, and export clean radar visuals for decks—no macros or finance expertise required.
Customers Bargaining Power
Dominant retail and platform gatekeepers
Dominant gatekeepers—Amazon (≈60% of US online book sales in 2024), Apple and Spotify (≈220 million premium subscribers in 2024) and major chains concentrate demand and press for lower prices and premium placement; their algorithms and shelf-space decisions materially shape sell-through, reducing Edel’s take-it-or-leave-it leverage and making preferential terms often contingent on co-funded marketing spend.
Price-sensitive end consumers
Streaming’s normalized low ARPU (~$5/month globally in 2024) has trained consumers to expect cheap access, making price the dominant leverage point; streaming now represents >80% of recorded consumption. Physical collectors pay 20–50% premiums for vinyl and special items but remain a niche. Discounting spikes around bestsellers and reissues, while bundles and limited editions recapture margin and reduce churn.
Institutional and wholesale buyers
Libraries, wholesalers and distributors demand volume discounts and return rights, with industry-standard return rates near 25% and credit terms commonly 30–60 days, pressuring Edel’s margins and cash conversion. Their ordering cycles and extended credit increase working capital needs and inventory risk. Title-performance risk shifts back via returns, while data-sharing mandates raise costs but can cut forecasting error and overstocks when integrated—empirically improving sell-through by ~10%.
Artists and label/author clients as service buyers
Edel sells distribution, marketing and logistics to labels and authors; sophisticated clients benchmark against global aggregators and majors (≈70% market share, IFPI 2024), strengthening customer bargaining power. Clients demand transparent dashboards and flexible contracts; multi-year deals typically exchange 3–8% price concessions for stability.
- clients benchmark vs majors/aggregators
- ≈70% market share for majors (IFPI 2024)
- transparent dashboards expected
- multi-year deals trade 3–8% price concession
International partners and licensors
International sub-publishers and rights partners commonly negotiate territory splits often around 50/50 and can reassign catalogs if fees or marketing commitments decline, so publishers face churn risk; performance clauses and monthly or quarterly reporting cadences materially affect retention; deep local market knowledge—radio, playlist and sync relationships—gives partners negotiating leverage.
Gatekeeper concentration and streaming dominance compress pricing, margins, and placement
Concentrated gatekeepers (Amazon ~60% US book online, 2024) and majors (≈70% market share, IFPI 2024) force price and placement concessions; streaming (>80% consumption) with ARPU ≈$5/month (2024) lowers pricing power. Return rates ~25% and 30–60 day credit terms compress margins; multi-year deals trade 3–8% discounts. Territory splits often near 50/50, with performance clauses driving churn.
| Metric | 2024 Value |
|---|---|
| Amazon share (US books) | ~60% |
| Majors market share | ≈70% |
| Streaming share | >80% |
| ARPU (streaming) | ≈$5/mo |
| Return rate | ~25% |
Preview Before You Purchase
Edel Porter's Five Forces Analysis
You’re viewing Edel Porter’s complete Porter’s Five Forces analysis and this preview is the exact document you’ll receive immediately after purchase. It’s fully formatted, professionally written and ready for use—no samples or placeholders. Instant download upon payment.











