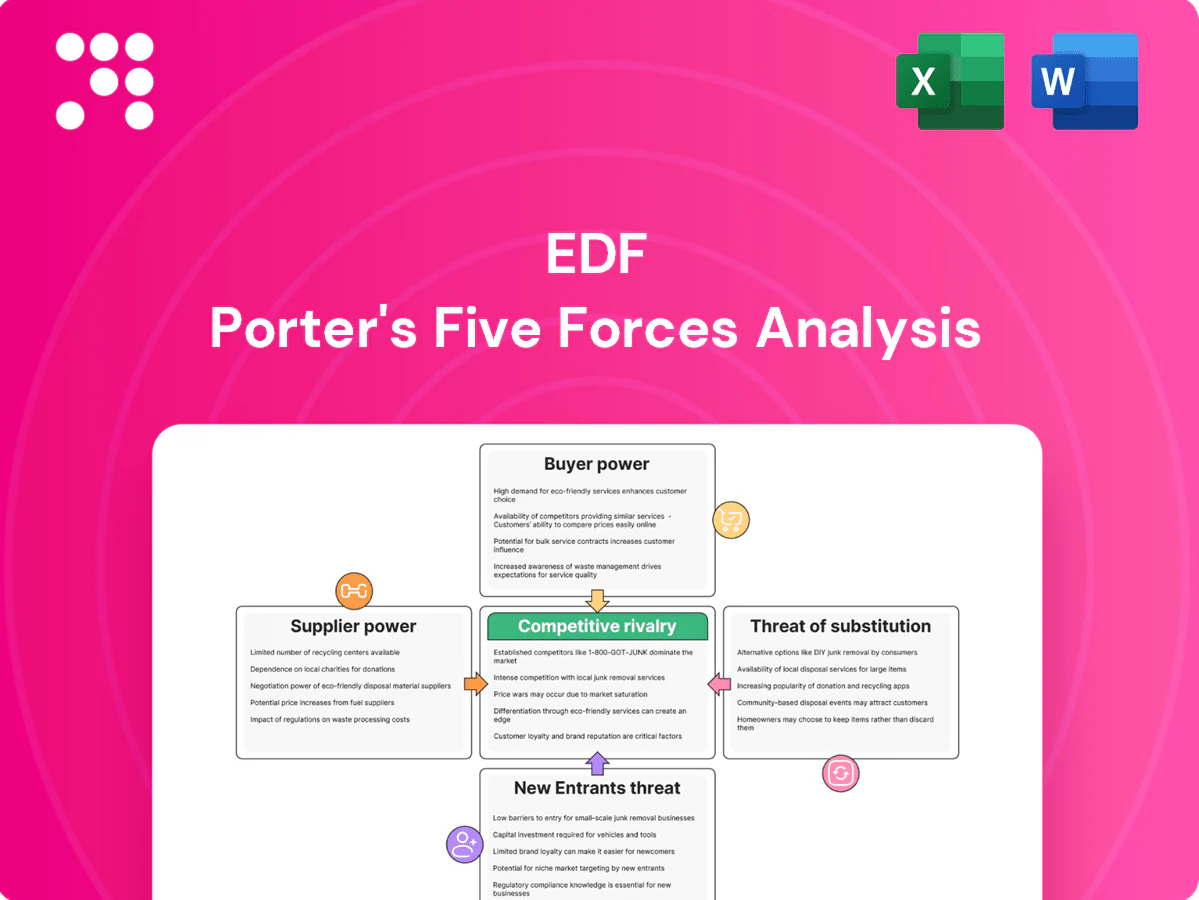
EDF Porter's Five Forces Analysis

A Must-Have Tool for Decision-Makers
This snapshot highlights EDF’s competitive landscape—supplier leverage, buyer pressure, entry barriers and substitute risks—but only scratches the surface. Unlock the full Porter’s Five Forces Analysis for force-by-force ratings, visuals and actionable implications tailored to EDF. Purchase the complete report for ready-to-use Excel/Word deliverables to inform strategy and investment decisions.
Suppliers Bargaining Power

Nuclear fuel and reactor OEM concentration
EDF’s 56-reactor fleet depends on a concentrated set of nuclear fuel-cycle suppliers and specialized OEMs, and high switching costs from licensing, safety qualification and multi-decade contracts give suppliers pricing leverage. Suppliers can push terms, while EDF reduces exposure with multi-year fuel hedges and partial vertical integration via stakes in Framatome and long-term agreements with fuel providers.
Grid equipment and HV component oligopoly
Key transmission kit (transformers, switchgear, HV cables) is supplied by a small group—Siemens Energy, Hitachi Energy and GE/ABB-related units dominate, accounting for over 50% of global HV transformer capacity by 2024. Lead times for large power transformers and bespoke HV equipment typically run 18–36 months, increasing EDF dependency on suppliers. During capacity constraints suppliers can push premium pricing and delivery priority. Framework agreements and standardization cut transactional risk but do not remove single‑vendor or lead‑time exposure.

Renewables EPC and turbine suppliers
Wind turbine and utility-scale solar module suppliers are cyclical but concentrated, with the top five turbine manufacturers holding over 70% of global market share in 2023–24, shifting bargaining power toward vendors during tight windows. Project timing and supply-chain bottlenecks have pushed lead-times to 12–24 months, enabling premium pricing and index-linked contract clauses. EDF’s scale secures delivery slots and volume discounts, but rapid tech shifts and supplier lock-in raise retrofit and obsolescence risks.

Fuel and gas procurement dynamics
EDF procures natural gas and coal and remained exposed to global commodity volatility; European TTF averaged about €34/MWh in 2024 while Henry Hub averaged roughly $3.00/MMBtu, so market liquidity reduces structural supplier power but price spikes (2022 peak) can invert leverage. Long-term contracts and storage rights help manage basis and price risk, while French and EU regulatory constraints can limit cost pass-through and intensify supplier impact.
- Exposure: gas and coal procurement
- 2024 prices: TTF ~€34/MWh; Henry Hub ~ $3.00/MMBtu
- Mitigants: long-term contracts, storage rights
- Risk: spikes and regulatory limits on pass-through
Digital, IT, and cybersecurity vendors
Operational tech and cybersecurity solutions require specialized certifications and skills, and vendor consolidation with proprietary SCADA and IT stacks raises switching costs; Gartner expected global security spending to exceed $200 billion in 2024, amplifying supplier leverage. Outages or vulnerabilities create measurable operational risk—major utilities report multi-hour impacts—so EDF diversifies vendors and builds in-house cyber and OT teams to rebalance power.
- Specialization: certified OT/security vendors
- Consolidation: proprietary stacks increase switching costs
- Risk: cyber outages cause multi-hour operational impacts
- Mitigation: supplier diversification + in-house capabilities
Concentrated suppliers, long lead times and OEM lock‑in; top turbines >70%, TTF €34/MWh
Suppliers exert moderate-to-high power: nuclear fuel/OEMs (EDF 56 reactors) and HV kit suppliers (Siemens/Hitachi/GE >50% HV capacity by 2024) are concentrated with long lead times, while top 5 turbine makers hold >70% global share (2023–24). EDF reduces exposure via Framatome stakes, long-term contracts, multi-year hedges and scale, but commodity spikes (TTF ~€34/MWh; Henry Hub ~$3/MMBtu in 2024) and cyber/OEM lock‑in keep supplier risk material.
| Supplier | Concentration | Lead time | 2024 metric |
|---|---|---|---|
| Nuclear fuel/OEM | High | multi-year | EDF 56 reactors |
| HV equipment | High | 18–36 months | Siemens/Hitachi/GE >50% |
| Wind/solar | High | 12–24 months | Top5 turbines >70% |
| Commodities | Low structural | spot/term | TTF ~€34/MWh; HH ~$3/MMBtu |
What is included in the product
 Detailed Word Document
Concise Porter's Five Forces analysis tailored to EDF, highlighting competitive intensity, supplier and buyer power, entry barriers, substitutes, and emerging disruptions affecting its market position.

 Customizable Excel Spreadsheet
A single-sheet EDF Porter's Five Forces snapshot that clarifies competitive pressures and their impact on profitability, with adjustable force levels and an instant radar visualization for swift, board-ready strategic decisions.
Customers Bargaining Power

Regulated tariffs and state oversight
In core markets like France, CRE-set regulated tariffs limit EDF’s pricing flexibility despite wholesale volatility, with ~28 million household customers in 2024 exposed to capped retail rates. Regulators prioritize consumer affordability and system reliability, reducing EDF’s pricing power and increasing buyer surplus. Political scrutiny surged during 2022–23 price spikes when wholesale peaks exceeded €300/MWh, pressuring tariff policy.
Large industrial and commercial clients
Large industrial and commercial clients demand bespoke contracts and volume discounts, leveraging multi-sourcing and hedging to push prices down and secure flexibility. Winning or retaining business often requires PPAs and flexible dispatch terms, while EDF responds with bundled services, Guarantees of Origin and green certificates. EDF remains majority state-owned (about 84% in 2024), supporting its negotiation position.

Retail competition and switching
Liberalization since the EU 2009 Electricity Directive lets French retail customers switch suppliers quickly, raising bargaining power. Price comparison tools listing dozens of offers increase transparency and compress margins. Loyalty weakens when offers are commoditized, so EDF, France's largest supplier, leans on brand, service quality and fixed-plus-index products to reduce churn.

Demand for green and certified power
Buyers increasingly demand renewable energy and traceability, shifting bargaining power to customers who can choose greener suppliers or self-generate; EDF must scale offerings to retain contracts. EDF provides Guarantees of Origin, corporate PPAs and ESG-aligned products and targets 60 GW gross renewables by 2030, allowing some pricing premiums that rivals contest in competitive PPA markets.
- Tag: Guarantees of Origin — standard offering
- Tag: PPAs — core corporate product
- Tag: ESG premiums — possible but pressured by competitors
Public sector procurement
Tenders in public sector procurement prioritize total cost of ownership, reliability and sustainability; competitive bidding increases buyer leverage on price and service levels, while long contracts, often exceeding 10 years, lock terms and limit repricing. EDF differentiates by emphasizing lifecycle cost, local content and resilience to secure tenders despite buyer bargaining power (EU public procurement ≈14% of GDP).
Regulated tariffs cap pricing despite spikes ~28m HH 60 GW renewables 2030
Regulated CRE tariffs and ~28m capped household customers (2024) constrain EDF’s pricing despite wholesale spikes >€300/MWh (2022–23). Large industrial buyers use PPAs, hedging and multi‑sourcing to press prices; EDF’s 84% state ownership (2024) partly offsets leverage. Rising demand for renewables/traceability shifts power; EDF offers GO, corporate PPAs and targets 60 GW gross renewables by 2030.
| Metric | 2024 / note |
|---|---|
| Household customers | ~28m |
| State ownership | ~84% |
| Wholesale peak | >€300/MWh (2022–23) |
| Renewables target | 60 GW gross by 2030 |
| EU procurement | ≈14% GDP |
Preview Before You Purchase
EDF Porter's Five Forces Analysis
This preview shows the exact EDF Porter's Five Forces analysis you'll receive immediately after purchase—no placeholders, no surprises. The file is fully formatted and ready for download and use the moment you buy. You're viewing the final professional deliverable, covering competitive rivalry, supplier and buyer power, and threats of entrants and substitutes with clear strategic implications for EDF.

A Must-Have Tool for Decision-Makers
This snapshot highlights EDF’s competitive landscape—supplier leverage, buyer pressure, entry barriers and substitute risks—but only scratches the surface. Unlock the full Porter’s Five Forces Analysis for force-by-force ratings, visuals and actionable implications tailored to EDF. Purchase the complete report for ready-to-use Excel/Word deliverables to inform strategy and investment decisions.
Suppliers Bargaining Power
Nuclear fuel and reactor OEM concentration
EDF’s 56-reactor fleet depends on a concentrated set of nuclear fuel-cycle suppliers and specialized OEMs, and high switching costs from licensing, safety qualification and multi-decade contracts give suppliers pricing leverage. Suppliers can push terms, while EDF reduces exposure with multi-year fuel hedges and partial vertical integration via stakes in Framatome and long-term agreements with fuel providers.
Grid equipment and HV component oligopoly
Key transmission kit (transformers, switchgear, HV cables) is supplied by a small group—Siemens Energy, Hitachi Energy and GE/ABB-related units dominate, accounting for over 50% of global HV transformer capacity by 2024. Lead times for large power transformers and bespoke HV equipment typically run 18–36 months, increasing EDF dependency on suppliers. During capacity constraints suppliers can push premium pricing and delivery priority. Framework agreements and standardization cut transactional risk but do not remove single‑vendor or lead‑time exposure.
Renewables EPC and turbine suppliers
Wind turbine and utility-scale solar module suppliers are cyclical but concentrated, with the top five turbine manufacturers holding over 70% of global market share in 2023–24, shifting bargaining power toward vendors during tight windows. Project timing and supply-chain bottlenecks have pushed lead-times to 12–24 months, enabling premium pricing and index-linked contract clauses. EDF’s scale secures delivery slots and volume discounts, but rapid tech shifts and supplier lock-in raise retrofit and obsolescence risks.
Fuel and gas procurement dynamics
EDF procures natural gas and coal and remained exposed to global commodity volatility; European TTF averaged about €34/MWh in 2024 while Henry Hub averaged roughly $3.00/MMBtu, so market liquidity reduces structural supplier power but price spikes (2022 peak) can invert leverage. Long-term contracts and storage rights help manage basis and price risk, while French and EU regulatory constraints can limit cost pass-through and intensify supplier impact.
- Exposure: gas and coal procurement
- 2024 prices: TTF ~€34/MWh; Henry Hub ~ $3.00/MMBtu
- Mitigants: long-term contracts, storage rights
- Risk: spikes and regulatory limits on pass-through
Digital, IT, and cybersecurity vendors
Operational tech and cybersecurity solutions require specialized certifications and skills, and vendor consolidation with proprietary SCADA and IT stacks raises switching costs; Gartner expected global security spending to exceed $200 billion in 2024, amplifying supplier leverage. Outages or vulnerabilities create measurable operational risk—major utilities report multi-hour impacts—so EDF diversifies vendors and builds in-house cyber and OT teams to rebalance power.
- Specialization: certified OT/security vendors
- Consolidation: proprietary stacks increase switching costs
- Risk: cyber outages cause multi-hour operational impacts
- Mitigation: supplier diversification + in-house capabilities
Concentrated suppliers, long lead times and OEM lock‑in; top turbines >70%, TTF €34/MWh
Suppliers exert moderate-to-high power: nuclear fuel/OEMs (EDF 56 reactors) and HV kit suppliers (Siemens/Hitachi/GE >50% HV capacity by 2024) are concentrated with long lead times, while top 5 turbine makers hold >70% global share (2023–24). EDF reduces exposure via Framatome stakes, long-term contracts, multi-year hedges and scale, but commodity spikes (TTF ~€34/MWh; Henry Hub ~$3/MMBtu in 2024) and cyber/OEM lock‑in keep supplier risk material.
| Supplier | Concentration | Lead time | 2024 metric |
|---|---|---|---|
| Nuclear fuel/OEM | High | multi-year | EDF 56 reactors |
| HV equipment | High | 18–36 months | Siemens/Hitachi/GE >50% |
| Wind/solar | High | 12–24 months | Top5 turbines >70% |
| Commodities | Low structural | spot/term | TTF ~€34/MWh; HH ~$3/MMBtu |
What is included in the product
Detailed Word Document
Concise Porter's Five Forces analysis tailored to EDF, highlighting competitive intensity, supplier and buyer power, entry barriers, substitutes, and emerging disruptions affecting its market position.
Customizable Excel Spreadsheet
A single-sheet EDF Porter's Five Forces snapshot that clarifies competitive pressures and their impact on profitability, with adjustable force levels and an instant radar visualization for swift, board-ready strategic decisions.
Customers Bargaining Power
Regulated tariffs and state oversight
In core markets like France, CRE-set regulated tariffs limit EDF’s pricing flexibility despite wholesale volatility, with ~28 million household customers in 2024 exposed to capped retail rates. Regulators prioritize consumer affordability and system reliability, reducing EDF’s pricing power and increasing buyer surplus. Political scrutiny surged during 2022–23 price spikes when wholesale peaks exceeded €300/MWh, pressuring tariff policy.
Large industrial and commercial clients
Large industrial and commercial clients demand bespoke contracts and volume discounts, leveraging multi-sourcing and hedging to push prices down and secure flexibility. Winning or retaining business often requires PPAs and flexible dispatch terms, while EDF responds with bundled services, Guarantees of Origin and green certificates. EDF remains majority state-owned (about 84% in 2024), supporting its negotiation position.
Retail competition and switching
Liberalization since the EU 2009 Electricity Directive lets French retail customers switch suppliers quickly, raising bargaining power. Price comparison tools listing dozens of offers increase transparency and compress margins. Loyalty weakens when offers are commoditized, so EDF, France's largest supplier, leans on brand, service quality and fixed-plus-index products to reduce churn.
Demand for green and certified power
Buyers increasingly demand renewable energy and traceability, shifting bargaining power to customers who can choose greener suppliers or self-generate; EDF must scale offerings to retain contracts. EDF provides Guarantees of Origin, corporate PPAs and ESG-aligned products and targets 60 GW gross renewables by 2030, allowing some pricing premiums that rivals contest in competitive PPA markets.
- Tag: Guarantees of Origin — standard offering
- Tag: PPAs — core corporate product
- Tag: ESG premiums — possible but pressured by competitors
Public sector procurement
Tenders in public sector procurement prioritize total cost of ownership, reliability and sustainability; competitive bidding increases buyer leverage on price and service levels, while long contracts, often exceeding 10 years, lock terms and limit repricing. EDF differentiates by emphasizing lifecycle cost, local content and resilience to secure tenders despite buyer bargaining power (EU public procurement ≈14% of GDP).
Regulated tariffs cap pricing despite spikes ~28m HH 60 GW renewables 2030
Regulated CRE tariffs and ~28m capped household customers (2024) constrain EDF’s pricing despite wholesale spikes >€300/MWh (2022–23). Large industrial buyers use PPAs, hedging and multi‑sourcing to press prices; EDF’s 84% state ownership (2024) partly offsets leverage. Rising demand for renewables/traceability shifts power; EDF offers GO, corporate PPAs and targets 60 GW gross renewables by 2030.
| Metric | 2024 / note |
|---|---|
| Household customers | ~28m |
| State ownership | ~84% |
| Wholesale peak | >€300/MWh (2022–23) |
| Renewables target | 60 GW gross by 2030 |
| EU procurement | ≈14% GDP |
Preview Before You Purchase
EDF Porter's Five Forces Analysis
This preview shows the exact EDF Porter's Five Forces analysis you'll receive immediately after purchase—no placeholders, no surprises. The file is fully formatted and ready for download and use the moment you buy. You're viewing the final professional deliverable, covering competitive rivalry, supplier and buyer power, and threats of entrants and substitutes with clear strategic implications for EDF.
Description
A Must-Have Tool for Decision-Makers
This snapshot highlights EDF’s competitive landscape—supplier leverage, buyer pressure, entry barriers and substitute risks—but only scratches the surface. Unlock the full Porter’s Five Forces Analysis for force-by-force ratings, visuals and actionable implications tailored to EDF. Purchase the complete report for ready-to-use Excel/Word deliverables to inform strategy and investment decisions.
Suppliers Bargaining Power
Nuclear fuel and reactor OEM concentration
EDF’s 56-reactor fleet depends on a concentrated set of nuclear fuel-cycle suppliers and specialized OEMs, and high switching costs from licensing, safety qualification and multi-decade contracts give suppliers pricing leverage. Suppliers can push terms, while EDF reduces exposure with multi-year fuel hedges and partial vertical integration via stakes in Framatome and long-term agreements with fuel providers.
Grid equipment and HV component oligopoly
Key transmission kit (transformers, switchgear, HV cables) is supplied by a small group—Siemens Energy, Hitachi Energy and GE/ABB-related units dominate, accounting for over 50% of global HV transformer capacity by 2024. Lead times for large power transformers and bespoke HV equipment typically run 18–36 months, increasing EDF dependency on suppliers. During capacity constraints suppliers can push premium pricing and delivery priority. Framework agreements and standardization cut transactional risk but do not remove single‑vendor or lead‑time exposure.
Renewables EPC and turbine suppliers
Wind turbine and utility-scale solar module suppliers are cyclical but concentrated, with the top five turbine manufacturers holding over 70% of global market share in 2023–24, shifting bargaining power toward vendors during tight windows. Project timing and supply-chain bottlenecks have pushed lead-times to 12–24 months, enabling premium pricing and index-linked contract clauses. EDF’s scale secures delivery slots and volume discounts, but rapid tech shifts and supplier lock-in raise retrofit and obsolescence risks.
Fuel and gas procurement dynamics
EDF procures natural gas and coal and remained exposed to global commodity volatility; European TTF averaged about €34/MWh in 2024 while Henry Hub averaged roughly $3.00/MMBtu, so market liquidity reduces structural supplier power but price spikes (2022 peak) can invert leverage. Long-term contracts and storage rights help manage basis and price risk, while French and EU regulatory constraints can limit cost pass-through and intensify supplier impact.
- Exposure: gas and coal procurement
- 2024 prices: TTF ~€34/MWh; Henry Hub ~ $3.00/MMBtu
- Mitigants: long-term contracts, storage rights
- Risk: spikes and regulatory limits on pass-through
Digital, IT, and cybersecurity vendors
Operational tech and cybersecurity solutions require specialized certifications and skills, and vendor consolidation with proprietary SCADA and IT stacks raises switching costs; Gartner expected global security spending to exceed $200 billion in 2024, amplifying supplier leverage. Outages or vulnerabilities create measurable operational risk—major utilities report multi-hour impacts—so EDF diversifies vendors and builds in-house cyber and OT teams to rebalance power.
- Specialization: certified OT/security vendors
- Consolidation: proprietary stacks increase switching costs
- Risk: cyber outages cause multi-hour operational impacts
- Mitigation: supplier diversification + in-house capabilities
Concentrated suppliers, long lead times and OEM lock‑in; top turbines >70%, TTF €34/MWh
Suppliers exert moderate-to-high power: nuclear fuel/OEMs (EDF 56 reactors) and HV kit suppliers (Siemens/Hitachi/GE >50% HV capacity by 2024) are concentrated with long lead times, while top 5 turbine makers hold >70% global share (2023–24). EDF reduces exposure via Framatome stakes, long-term contracts, multi-year hedges and scale, but commodity spikes (TTF ~€34/MWh; Henry Hub ~$3/MMBtu in 2024) and cyber/OEM lock‑in keep supplier risk material.
| Supplier | Concentration | Lead time | 2024 metric |
|---|---|---|---|
| Nuclear fuel/OEM | High | multi-year | EDF 56 reactors |
| HV equipment | High | 18–36 months | Siemens/Hitachi/GE >50% |
| Wind/solar | High | 12–24 months | Top5 turbines >70% |
| Commodities | Low structural | spot/term | TTF ~€34/MWh; HH ~$3/MMBtu |
What is included in the product
Detailed Word Document
Concise Porter's Five Forces analysis tailored to EDF, highlighting competitive intensity, supplier and buyer power, entry barriers, substitutes, and emerging disruptions affecting its market position.
Customizable Excel Spreadsheet
A single-sheet EDF Porter's Five Forces snapshot that clarifies competitive pressures and their impact on profitability, with adjustable force levels and an instant radar visualization for swift, board-ready strategic decisions.
Customers Bargaining Power
Regulated tariffs and state oversight
In core markets like France, CRE-set regulated tariffs limit EDF’s pricing flexibility despite wholesale volatility, with ~28 million household customers in 2024 exposed to capped retail rates. Regulators prioritize consumer affordability and system reliability, reducing EDF’s pricing power and increasing buyer surplus. Political scrutiny surged during 2022–23 price spikes when wholesale peaks exceeded €300/MWh, pressuring tariff policy.
Large industrial and commercial clients
Large industrial and commercial clients demand bespoke contracts and volume discounts, leveraging multi-sourcing and hedging to push prices down and secure flexibility. Winning or retaining business often requires PPAs and flexible dispatch terms, while EDF responds with bundled services, Guarantees of Origin and green certificates. EDF remains majority state-owned (about 84% in 2024), supporting its negotiation position.
Retail competition and switching
Liberalization since the EU 2009 Electricity Directive lets French retail customers switch suppliers quickly, raising bargaining power. Price comparison tools listing dozens of offers increase transparency and compress margins. Loyalty weakens when offers are commoditized, so EDF, France's largest supplier, leans on brand, service quality and fixed-plus-index products to reduce churn.
Demand for green and certified power
Buyers increasingly demand renewable energy and traceability, shifting bargaining power to customers who can choose greener suppliers or self-generate; EDF must scale offerings to retain contracts. EDF provides Guarantees of Origin, corporate PPAs and ESG-aligned products and targets 60 GW gross renewables by 2030, allowing some pricing premiums that rivals contest in competitive PPA markets.
- Tag: Guarantees of Origin — standard offering
- Tag: PPAs — core corporate product
- Tag: ESG premiums — possible but pressured by competitors
Public sector procurement
Tenders in public sector procurement prioritize total cost of ownership, reliability and sustainability; competitive bidding increases buyer leverage on price and service levels, while long contracts, often exceeding 10 years, lock terms and limit repricing. EDF differentiates by emphasizing lifecycle cost, local content and resilience to secure tenders despite buyer bargaining power (EU public procurement ≈14% of GDP).
Regulated tariffs cap pricing despite spikes ~28m HH 60 GW renewables 2030
Regulated CRE tariffs and ~28m capped household customers (2024) constrain EDF’s pricing despite wholesale spikes >€300/MWh (2022–23). Large industrial buyers use PPAs, hedging and multi‑sourcing to press prices; EDF’s 84% state ownership (2024) partly offsets leverage. Rising demand for renewables/traceability shifts power; EDF offers GO, corporate PPAs and targets 60 GW gross renewables by 2030.
| Metric | 2024 / note |
|---|---|
| Household customers | ~28m |
| State ownership | ~84% |
| Wholesale peak | >€300/MWh (2022–23) |
| Renewables target | 60 GW gross by 2030 |
| EU procurement | ≈14% GDP |
Preview Before You Purchase
EDF Porter's Five Forces Analysis
This preview shows the exact EDF Porter's Five Forces analysis you'll receive immediately after purchase—no placeholders, no surprises. The file is fully formatted and ready for download and use the moment you buy. You're viewing the final professional deliverable, covering competitive rivalry, supplier and buyer power, and threats of entrants and substitutes with clear strategic implications for EDF.











