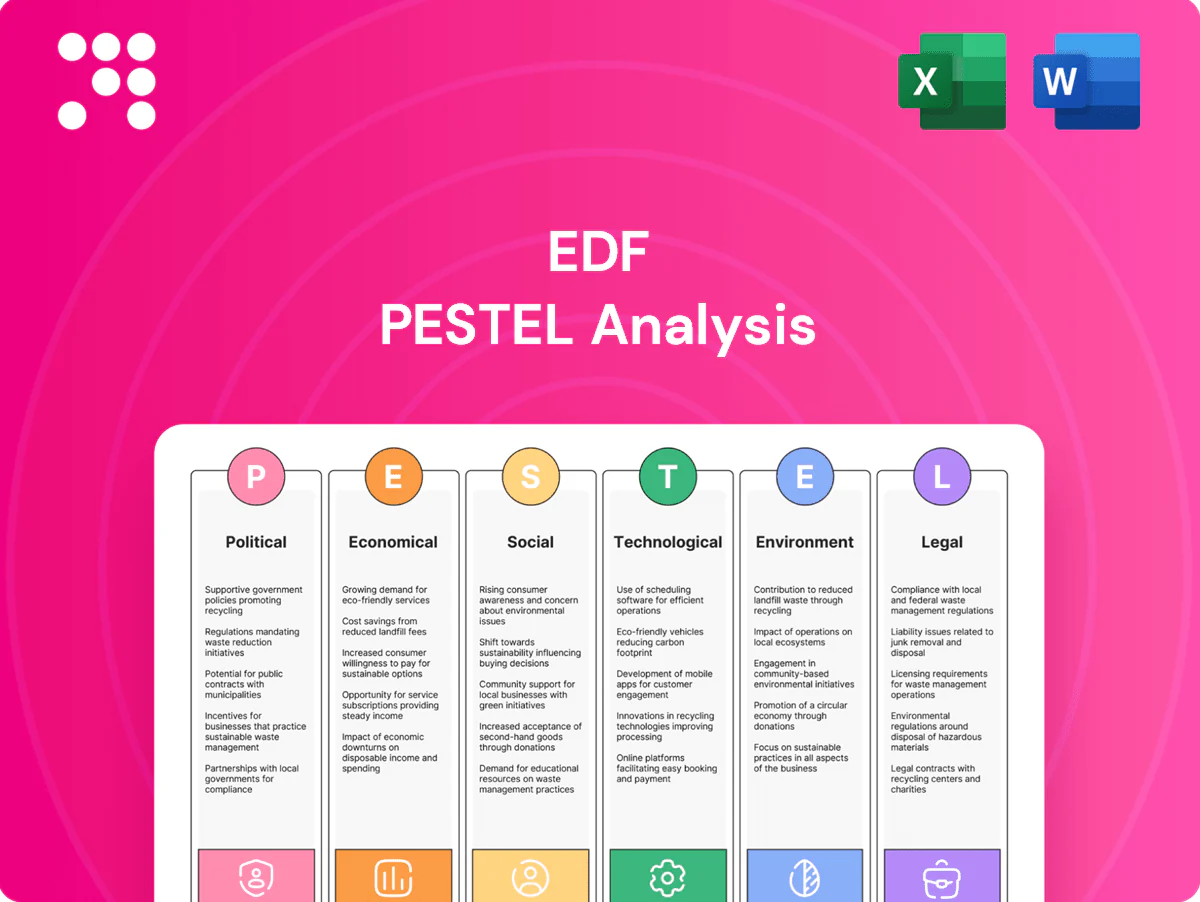
EDF PESTLE Analysis

Your Competitive Advantage Starts with This Report
Unlock how political shifts, economic cycles, and environmental trends are reshaping EDF’s strategic outlook with our concise PESTLE Analysis. Ideal for investors, consultants, and planners, this briefing pinpoints risks and opportunities you can act on today. Purchase the full report to access the complete, editable breakdown and immediate insights.
Political factors

State ownership and policy influence
With the French state holding about 84% of EDF, corporate strategy is tightly linked to national energy sovereignty; Paris’ 2022 push for 14 new reactors and policy to extend reactors to 50 years drives EDF’s investment timing and priorities. Political cycles can accelerate or delay projects, and EDF must reconcile French policy with host‑country agendas across its ~300 TWh annual generation footprint and 70% national nuclear share.
EU energy market design changes
Reforms to capacity mechanisms, price caps and revenue clawbacks have increased short-term earnings volatility for generators and reduced visibility on forward cash flows; 11 EU member states operated capacity mechanisms as of ACER 2023. The EU market redesign aims to de-risk long-term investment while protecting consumers, but implementation varies by member state, creating regulatory fragmentation. EDF must hedge merchant exposure and realign PPAs to shifting rules and national orders to preserve project economics.

Geopolitics and security of supply
Gas, uranium and equipment supply chains face sanctions, trade tensions and transport risks — Kazakhstan supplied ~40% of mined uranium in 2023 while EU imports of Russian gas fell roughly 80% since 2021, exposing vulnerabilities for EDF. Energy security pushes governments toward domestic nuclear and renewables, supporting EDF’s ~€50bn+ 2030 investment pipeline. Import restrictions can raise procurement costs and delay new builds. EDF must diversify suppliers and hold strategic inventories to mitigate disruption.

Public support and subsidies for low‑carbon
Local permitting and stakeholder politics
Regional authorities and municipalities shape siting of wind, solar, grids and new reactors; permitting timelines are politically sensitive and commonly add 12–36 months (EU average ~24 months in 2024), elongating project delivery and cash‑flows. Early stakeholder engagement reduces veto risk and conditional approvals; EDF must tailor community benefits and local contracts to secure permits and protect timelines.
- Permitting delay: 12–36 months (EU avg ~24 months, 2024)
- Early engagement: lowers veto/conditions
- EDF action: bespoke community benefits and local procurement
State-owned utility (84%) backs 70% nuclear mix, €50bn+ 2030 capex
State ownership (~84%) ties EDF strategy to French energy sovereignty; France's ~70% nuclear share and EDF ~300 TWh annual generation make Paris’ 2022 plan for 14 reactors and €50bn+ 2030 capex central to planning. Market reforms and capacity mechanisms (11 EU states, ACER 2023) raise short‑term cash‑flow volatility; permitting averages ~24 months (EU 2024). Supply risks (Kazakhstan ~40% uranium 2023; EU Russian gas imports down ~80% since 2021) push supplier diversification.
| Metric | Value |
|---|---|
| State stake | ~84% |
| EDF generation | ~300 TWh |
| Nuclear share (FR) | ~70% |
| 2030 capex | €50bn+ |
| Permitting (EU 2024) | ~24 months |
| Uranium supply (KZ 2023) | ~40% |
What is included in the product
 Detailed Word Document
Explores how macro-environmental factors uniquely affect EDF across Political, Economic, Social, Technological, Environmental and Legal dimensions, with data-backed, forward-looking insights that reflect regional market and regulatory dynamics and are formatted for direct use in executive reports and strategic planning.

 Customizable Excel Spreadsheet
Concise, visually segmented EDF PESTLE summary that’s easily editable and shareable—ideal for meetings, presentations and cross‑team alignment while supporting discussions on external risk and market positioning.
Economic factors

Power price volatility and hedging
Wholesale price swings drive EDF revenue but require robust hedging to protect cash flow; spot moves can swing margins widely. EDF’s ~56 GW nuclear fleet and major hydro assets amplify leverage to spot markets, increasing volatility exposure. Long-term contracts and capacity payments provide stabilising cash, while EDF balances merchant exposure with fixed-price offtakes alongside its €50 billion 2030 investment plan.
Capex intensity and financing costs
Nuclear new‑builds and life‑extensions plus grid upgrades require multi‑billion, multi‑year capex (Hinkley Point C ~£22–26bn; Sizewell C proposals in the £20–30bn range), so interest rates and credit spreads materially affect affordability (UK 10‑yr gilt ~4–4.5% in 2024–25). French state backing (c.84% ownership in EDF in 2024) lowers financing costs but increases oversight. Phasing and modular approaches reduce peak funding needs and balance sheet strain.

Demand growth and electrification
Rising electrification—EVs, heat pumps, data centers and hydrogen electrolysis—is driving higher baseload and changing load shapes; global electricity demand rose about 3.4% in 2023 (IEA) and studies commonly project electrification could add roughly 10–15% to demand in major markets by 2030.
Shifted hourly peaks require flexible generation and storage, boosting markets for fast-ramping gas, batteries and demand response.
Industrial decarbonization opens B2B services and PPAs; EDF can monetize demand-side management and capture flexibility-market revenues as capacity markets and ancillary services grow.

Input costs and inflation pressures
Commodity, labor and equipment inflation have raised build and O&M costs for EDF, while supply-chain bottlenecks continue to delay projects and escalate budgets. Indexation clauses in tariffs and PPAs can partly offset cost pressures, and procurement scale plus standardization improve cost control and unit economics.
- Commodity, labor, equipment inflation
- Supply-chain delays → higher capex
- Indexation in tariffs/PPAs mitigates risk
- Procurement scale & standardization lower unit costs
Currency and cross‑border exposure
Revenues and costs in over 20 countries expose EDF to significant FX risk as project cash flows span currencies; long‑dated nuclear and renewables assets often have lifecycles up to 40 years, requiring hedges that match duration. Regulatory regimes shape repatriation and allowed returns, while portfolio diversification across markets smooths country‑specific shocks and volatility.
- FX exposure: operations in over 20 countries
- Hedge horizon: align with 10–40 year project lives
- Regulation: affects repatriation and permitted returns
- Diversification: reduces country shock volatility
State-owned utility (84%) backs 70% nuclear mix, €50bn+ 2030 capex
Wholesale price swings and EDF’s ~56 GW nuclear fleet drive revenue volatility; hedges and long‑term contracts partly stabilise cash. Multi‑bn new‑builds (Hinkley ~£22–26bn; Sizewell proposals £20–30bn) and EDF’s €50bn 2030 plan make rates (UK 10y gilt ~4–4.5% 2024–25) and state backing (~84% 2024) critical. Electrification (+3.4% global demand 2023) and flexibility markets expand opportunities while capex and supply‑chain inflation raise costs.
| Metric | Value |
|---|---|
| Nuclear capacity | ~56 GW |
| 2030 capex | €50 bn |
| UK 10y gilt (2024–25) | 4–4.5% |
| State ownership (2024) | ~84% |
Same Document Delivered
EDF PESTLE Analysis
The preview shown here is the exact EDF PESTLE Analysis document you’ll receive after purchase—fully formatted and ready to use. What you see is the real, finished file with no placeholders or teasers. The layout, content, and structure match the downloadable product. After checkout you’ll get this same file instantly.

Your Competitive Advantage Starts with This Report
Unlock how political shifts, economic cycles, and environmental trends are reshaping EDF’s strategic outlook with our concise PESTLE Analysis. Ideal for investors, consultants, and planners, this briefing pinpoints risks and opportunities you can act on today. Purchase the full report to access the complete, editable breakdown and immediate insights.
Political factors
State ownership and policy influence
With the French state holding about 84% of EDF, corporate strategy is tightly linked to national energy sovereignty; Paris’ 2022 push for 14 new reactors and policy to extend reactors to 50 years drives EDF’s investment timing and priorities. Political cycles can accelerate or delay projects, and EDF must reconcile French policy with host‑country agendas across its ~300 TWh annual generation footprint and 70% national nuclear share.
EU energy market design changes
Reforms to capacity mechanisms, price caps and revenue clawbacks have increased short-term earnings volatility for generators and reduced visibility on forward cash flows; 11 EU member states operated capacity mechanisms as of ACER 2023. The EU market redesign aims to de-risk long-term investment while protecting consumers, but implementation varies by member state, creating regulatory fragmentation. EDF must hedge merchant exposure and realign PPAs to shifting rules and national orders to preserve project economics.
Geopolitics and security of supply
Gas, uranium and equipment supply chains face sanctions, trade tensions and transport risks — Kazakhstan supplied ~40% of mined uranium in 2023 while EU imports of Russian gas fell roughly 80% since 2021, exposing vulnerabilities for EDF. Energy security pushes governments toward domestic nuclear and renewables, supporting EDF’s ~€50bn+ 2030 investment pipeline. Import restrictions can raise procurement costs and delay new builds. EDF must diversify suppliers and hold strategic inventories to mitigate disruption.
Public support and subsidies for low‑carbon
Local permitting and stakeholder politics
Regional authorities and municipalities shape siting of wind, solar, grids and new reactors; permitting timelines are politically sensitive and commonly add 12–36 months (EU average ~24 months in 2024), elongating project delivery and cash‑flows. Early stakeholder engagement reduces veto risk and conditional approvals; EDF must tailor community benefits and local contracts to secure permits and protect timelines.
- Permitting delay: 12–36 months (EU avg ~24 months, 2024)
- Early engagement: lowers veto/conditions
- EDF action: bespoke community benefits and local procurement
State-owned utility (84%) backs 70% nuclear mix, €50bn+ 2030 capex
State ownership (~84%) ties EDF strategy to French energy sovereignty; France's ~70% nuclear share and EDF ~300 TWh annual generation make Paris’ 2022 plan for 14 reactors and €50bn+ 2030 capex central to planning. Market reforms and capacity mechanisms (11 EU states, ACER 2023) raise short‑term cash‑flow volatility; permitting averages ~24 months (EU 2024). Supply risks (Kazakhstan ~40% uranium 2023; EU Russian gas imports down ~80% since 2021) push supplier diversification.
| Metric | Value |
|---|---|
| State stake | ~84% |
| EDF generation | ~300 TWh |
| Nuclear share (FR) | ~70% |
| 2030 capex | €50bn+ |
| Permitting (EU 2024) | ~24 months |
| Uranium supply (KZ 2023) | ~40% |
What is included in the product
Detailed Word Document
Explores how macro-environmental factors uniquely affect EDF across Political, Economic, Social, Technological, Environmental and Legal dimensions, with data-backed, forward-looking insights that reflect regional market and regulatory dynamics and are formatted for direct use in executive reports and strategic planning.
Customizable Excel Spreadsheet
Concise, visually segmented EDF PESTLE summary that’s easily editable and shareable—ideal for meetings, presentations and cross‑team alignment while supporting discussions on external risk and market positioning.
Economic factors
Power price volatility and hedging
Wholesale price swings drive EDF revenue but require robust hedging to protect cash flow; spot moves can swing margins widely. EDF’s ~56 GW nuclear fleet and major hydro assets amplify leverage to spot markets, increasing volatility exposure. Long-term contracts and capacity payments provide stabilising cash, while EDF balances merchant exposure with fixed-price offtakes alongside its €50 billion 2030 investment plan.
Capex intensity and financing costs
Nuclear new‑builds and life‑extensions plus grid upgrades require multi‑billion, multi‑year capex (Hinkley Point C ~£22–26bn; Sizewell C proposals in the £20–30bn range), so interest rates and credit spreads materially affect affordability (UK 10‑yr gilt ~4–4.5% in 2024–25). French state backing (c.84% ownership in EDF in 2024) lowers financing costs but increases oversight. Phasing and modular approaches reduce peak funding needs and balance sheet strain.
Demand growth and electrification
Rising electrification—EVs, heat pumps, data centers and hydrogen electrolysis—is driving higher baseload and changing load shapes; global electricity demand rose about 3.4% in 2023 (IEA) and studies commonly project electrification could add roughly 10–15% to demand in major markets by 2030.
Shifted hourly peaks require flexible generation and storage, boosting markets for fast-ramping gas, batteries and demand response.
Industrial decarbonization opens B2B services and PPAs; EDF can monetize demand-side management and capture flexibility-market revenues as capacity markets and ancillary services grow.
Input costs and inflation pressures
Commodity, labor and equipment inflation have raised build and O&M costs for EDF, while supply-chain bottlenecks continue to delay projects and escalate budgets. Indexation clauses in tariffs and PPAs can partly offset cost pressures, and procurement scale plus standardization improve cost control and unit economics.
- Commodity, labor, equipment inflation
- Supply-chain delays → higher capex
- Indexation in tariffs/PPAs mitigates risk
- Procurement scale & standardization lower unit costs
Currency and cross‑border exposure
Revenues and costs in over 20 countries expose EDF to significant FX risk as project cash flows span currencies; long‑dated nuclear and renewables assets often have lifecycles up to 40 years, requiring hedges that match duration. Regulatory regimes shape repatriation and allowed returns, while portfolio diversification across markets smooths country‑specific shocks and volatility.
- FX exposure: operations in over 20 countries
- Hedge horizon: align with 10–40 year project lives
- Regulation: affects repatriation and permitted returns
- Diversification: reduces country shock volatility
State-owned utility (84%) backs 70% nuclear mix, €50bn+ 2030 capex
Wholesale price swings and EDF’s ~56 GW nuclear fleet drive revenue volatility; hedges and long‑term contracts partly stabilise cash. Multi‑bn new‑builds (Hinkley ~£22–26bn; Sizewell proposals £20–30bn) and EDF’s €50bn 2030 plan make rates (UK 10y gilt ~4–4.5% 2024–25) and state backing (~84% 2024) critical. Electrification (+3.4% global demand 2023) and flexibility markets expand opportunities while capex and supply‑chain inflation raise costs.
| Metric | Value |
|---|---|
| Nuclear capacity | ~56 GW |
| 2030 capex | €50 bn |
| UK 10y gilt (2024–25) | 4–4.5% |
| State ownership (2024) | ~84% |
Same Document Delivered
EDF PESTLE Analysis
The preview shown here is the exact EDF PESTLE Analysis document you’ll receive after purchase—fully formatted and ready to use. What you see is the real, finished file with no placeholders or teasers. The layout, content, and structure match the downloadable product. After checkout you’ll get this same file instantly.
Original: $10.00
-65%$10.00
$3.50Description
Your Competitive Advantage Starts with This Report
Unlock how political shifts, economic cycles, and environmental trends are reshaping EDF’s strategic outlook with our concise PESTLE Analysis. Ideal for investors, consultants, and planners, this briefing pinpoints risks and opportunities you can act on today. Purchase the full report to access the complete, editable breakdown and immediate insights.
Political factors
State ownership and policy influence
With the French state holding about 84% of EDF, corporate strategy is tightly linked to national energy sovereignty; Paris’ 2022 push for 14 new reactors and policy to extend reactors to 50 years drives EDF’s investment timing and priorities. Political cycles can accelerate or delay projects, and EDF must reconcile French policy with host‑country agendas across its ~300 TWh annual generation footprint and 70% national nuclear share.
EU energy market design changes
Reforms to capacity mechanisms, price caps and revenue clawbacks have increased short-term earnings volatility for generators and reduced visibility on forward cash flows; 11 EU member states operated capacity mechanisms as of ACER 2023. The EU market redesign aims to de-risk long-term investment while protecting consumers, but implementation varies by member state, creating regulatory fragmentation. EDF must hedge merchant exposure and realign PPAs to shifting rules and national orders to preserve project economics.
Geopolitics and security of supply
Gas, uranium and equipment supply chains face sanctions, trade tensions and transport risks — Kazakhstan supplied ~40% of mined uranium in 2023 while EU imports of Russian gas fell roughly 80% since 2021, exposing vulnerabilities for EDF. Energy security pushes governments toward domestic nuclear and renewables, supporting EDF’s ~€50bn+ 2030 investment pipeline. Import restrictions can raise procurement costs and delay new builds. EDF must diversify suppliers and hold strategic inventories to mitigate disruption.
Public support and subsidies for low‑carbon
Local permitting and stakeholder politics
Regional authorities and municipalities shape siting of wind, solar, grids and new reactors; permitting timelines are politically sensitive and commonly add 12–36 months (EU average ~24 months in 2024), elongating project delivery and cash‑flows. Early stakeholder engagement reduces veto risk and conditional approvals; EDF must tailor community benefits and local contracts to secure permits and protect timelines.
- Permitting delay: 12–36 months (EU avg ~24 months, 2024)
- Early engagement: lowers veto/conditions
- EDF action: bespoke community benefits and local procurement
State-owned utility (84%) backs 70% nuclear mix, €50bn+ 2030 capex
State ownership (~84%) ties EDF strategy to French energy sovereignty; France's ~70% nuclear share and EDF ~300 TWh annual generation make Paris’ 2022 plan for 14 reactors and €50bn+ 2030 capex central to planning. Market reforms and capacity mechanisms (11 EU states, ACER 2023) raise short‑term cash‑flow volatility; permitting averages ~24 months (EU 2024). Supply risks (Kazakhstan ~40% uranium 2023; EU Russian gas imports down ~80% since 2021) push supplier diversification.
| Metric | Value |
|---|---|
| State stake | ~84% |
| EDF generation | ~300 TWh |
| Nuclear share (FR) | ~70% |
| 2030 capex | €50bn+ |
| Permitting (EU 2024) | ~24 months |
| Uranium supply (KZ 2023) | ~40% |
What is included in the product
Detailed Word Document
Explores how macro-environmental factors uniquely affect EDF across Political, Economic, Social, Technological, Environmental and Legal dimensions, with data-backed, forward-looking insights that reflect regional market and regulatory dynamics and are formatted for direct use in executive reports and strategic planning.
Customizable Excel Spreadsheet
Concise, visually segmented EDF PESTLE summary that’s easily editable and shareable—ideal for meetings, presentations and cross‑team alignment while supporting discussions on external risk and market positioning.
Economic factors
Power price volatility and hedging
Wholesale price swings drive EDF revenue but require robust hedging to protect cash flow; spot moves can swing margins widely. EDF’s ~56 GW nuclear fleet and major hydro assets amplify leverage to spot markets, increasing volatility exposure. Long-term contracts and capacity payments provide stabilising cash, while EDF balances merchant exposure with fixed-price offtakes alongside its €50 billion 2030 investment plan.
Capex intensity and financing costs
Nuclear new‑builds and life‑extensions plus grid upgrades require multi‑billion, multi‑year capex (Hinkley Point C ~£22–26bn; Sizewell C proposals in the £20–30bn range), so interest rates and credit spreads materially affect affordability (UK 10‑yr gilt ~4–4.5% in 2024–25). French state backing (c.84% ownership in EDF in 2024) lowers financing costs but increases oversight. Phasing and modular approaches reduce peak funding needs and balance sheet strain.
Demand growth and electrification
Rising electrification—EVs, heat pumps, data centers and hydrogen electrolysis—is driving higher baseload and changing load shapes; global electricity demand rose about 3.4% in 2023 (IEA) and studies commonly project electrification could add roughly 10–15% to demand in major markets by 2030.
Shifted hourly peaks require flexible generation and storage, boosting markets for fast-ramping gas, batteries and demand response.
Industrial decarbonization opens B2B services and PPAs; EDF can monetize demand-side management and capture flexibility-market revenues as capacity markets and ancillary services grow.
Input costs and inflation pressures
Commodity, labor and equipment inflation have raised build and O&M costs for EDF, while supply-chain bottlenecks continue to delay projects and escalate budgets. Indexation clauses in tariffs and PPAs can partly offset cost pressures, and procurement scale plus standardization improve cost control and unit economics.
- Commodity, labor, equipment inflation
- Supply-chain delays → higher capex
- Indexation in tariffs/PPAs mitigates risk
- Procurement scale & standardization lower unit costs
Currency and cross‑border exposure
Revenues and costs in over 20 countries expose EDF to significant FX risk as project cash flows span currencies; long‑dated nuclear and renewables assets often have lifecycles up to 40 years, requiring hedges that match duration. Regulatory regimes shape repatriation and allowed returns, while portfolio diversification across markets smooths country‑specific shocks and volatility.
- FX exposure: operations in over 20 countries
- Hedge horizon: align with 10–40 year project lives
- Regulation: affects repatriation and permitted returns
- Diversification: reduces country shock volatility
State-owned utility (84%) backs 70% nuclear mix, €50bn+ 2030 capex
Wholesale price swings and EDF’s ~56 GW nuclear fleet drive revenue volatility; hedges and long‑term contracts partly stabilise cash. Multi‑bn new‑builds (Hinkley ~£22–26bn; Sizewell proposals £20–30bn) and EDF’s €50bn 2030 plan make rates (UK 10y gilt ~4–4.5% 2024–25) and state backing (~84% 2024) critical. Electrification (+3.4% global demand 2023) and flexibility markets expand opportunities while capex and supply‑chain inflation raise costs.
| Metric | Value |
|---|---|
| Nuclear capacity | ~56 GW |
| 2030 capex | €50 bn |
| UK 10y gilt (2024–25) | 4–4.5% |
| State ownership (2024) | ~84% |
Same Document Delivered
EDF PESTLE Analysis
The preview shown here is the exact EDF PESTLE Analysis document you’ll receive after purchase—fully formatted and ready to use. What you see is the real, finished file with no placeholders or teasers. The layout, content, and structure match the downloadable product. After checkout you’ll get this same file instantly.











