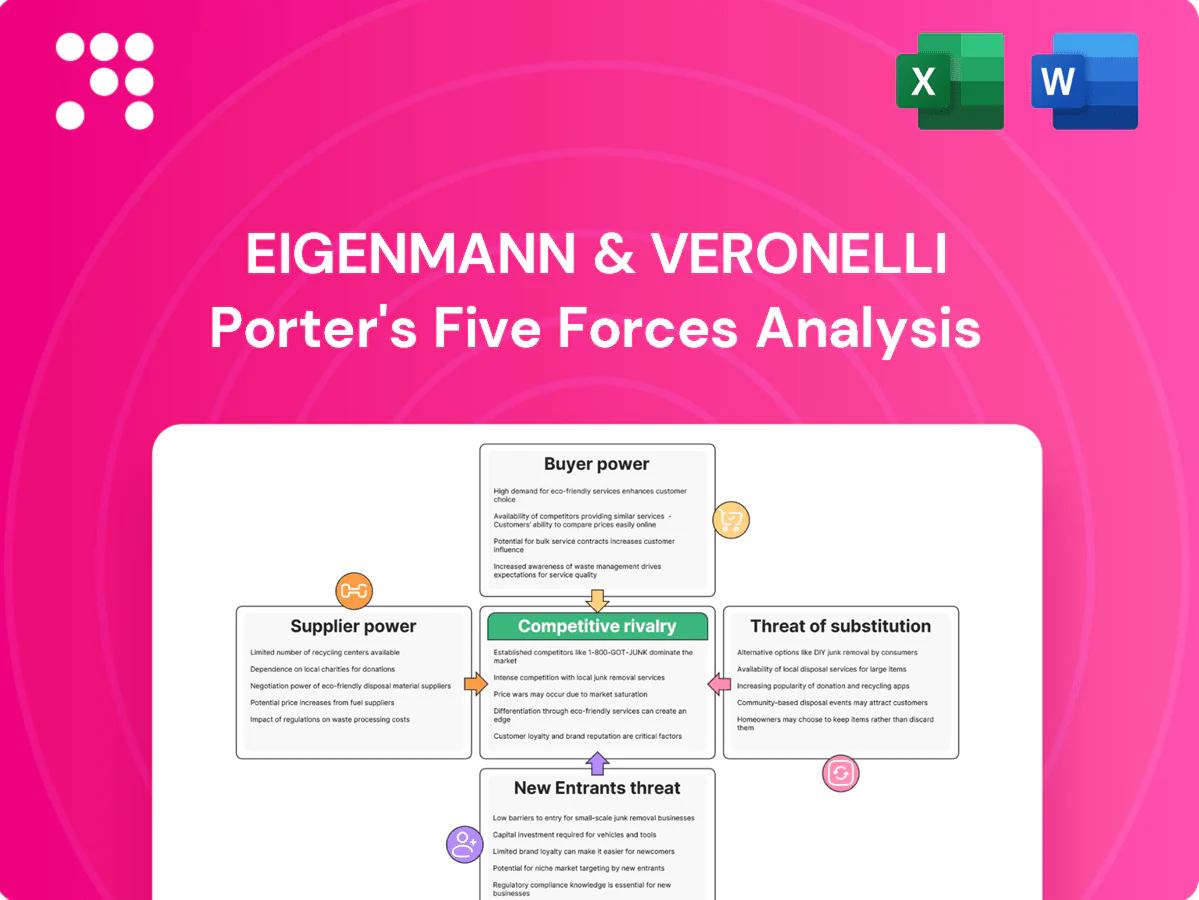
Eigenmann & Veronelli Porter's Five Forces Analysis

Elevate Your Analysis with the Complete Porter's Five Forces Analysis
Eigenmann & Veronelli faces moderate supplier power but intense buyer expectations and growing private-label competition, while regulatory and capital barriers influence entrant threats. This snapshot outlines core competitive levers and strategic vulnerabilities. This brief only scratches the surface—unlock the full Porter's Five Forces Analysis for force-by-force ratings, visuals, and actionable recommendations.
Suppliers Bargaining Power

Concentrated global producers
Specialty chemicals are concentrated among a few global producers, with the top 10 firms holding roughly 35% of the market in 2024, raising supplier leverage over pricing and availability.
Manufacturers owning proprietary IP or regulatory approvals can enforce territory exclusivities and tougher contract terms, squeezing distributor margins and imposing volume targets.
Eigenmann & Veronelli offsets this by maintaining a broad portfolio and cross-category sourcing options, reducing reliance on any single supplier and preserving margin flexibility.
Exclusivity and agency agreements
Regional exclusivity strengthens supplier power by tying access to key brands and technologies, with exclusive lines often representing 25–40% of a distributor’s revenue mix and driving customer stickiness.
Suppliers commonly mandate technical promotion, minimum inventory commitments (often 60–120 days) and KPIs such as 5–10% annual sell-through growth or specified display/share targets.
Losing an exclusive line can materially reduce revenue mix and retention; strong sales performance and market coverage are critical for E&V to retain supplier mandates.

Regulatory and quality gatekeeping
Compliance regimes—REACH (over 21,000 registered substances as of 2024), GMP and food/pharma standards—give suppliers leverage through documentation control and formal change-management, forcing downstream re-approvals and raising switching costs. Suppliers frequently pass compliance and certification costs through price adjustments. Eigenmann & Veronelli’s regulatory support and dossier management reduces approval friction and dependency risk.

Capacity cycles and allocation power
Brand equity and application know-how
Leading suppliers bundle products with application labs and co-development, embedding trials, technical data and approvals into customers’ processes and raising supplier bargaining power; in specialty chemicals the broader market size reached about USD 900 billion in 2024, increasing incentives for bundled service models. Distributors compete fiercely for access to these toolkits while E&V’s technical service can complement and rebalance supplier influence.
- Bundled labs increase supplier lock-in
- Embedded approvals raise switching costs
- Distributors vie for toolkit access
- E&V technical service mitigates supplier power
Supplier power tightens: concentration, exclusives and regulation strain specialty chemical supply
Suppliers are concentrated (top 10 ≈ 35% of market in 2024), giving pricing and availability leverage. Proprietary IP, exclusivities and bundled labs raise switching costs and lock customers (exclusive lines often 25–40% of distributor revenue). E&V reduces dependence via broad cross‑category sourcing, technical services and forecasting. Compliance burdens (REACH ≈ 21,000 substances) and tight feedstock (US refinery utilization ≈ 86% in 2024) strengthen supplier power.
| Metric | 2024 value |
|---|---|
| Top 10 market share | ≈35% |
| Specialty chemicals market | USD 900bn |
| REACH registered substances | ≈21,000 |
| US refinery utilization | ≈86% |
| Exclusive lines revenue mix | 25–40% |
| Inventory commitments | 60–120 days |
What is included in the product
 Detailed Word Document
Tailored Porter's Five Forces analysis for Eigenmann & Veronelli that uncovers key drivers of competition, buyer and supplier power, and market entry risks; includes identification of disruptive substitutes and emerging threats to market share. Designed for easy editing and incorporation into investor materials, strategy decks, or academic projects.

 Customizable Excel Spreadsheet
A concise one-sheet Porter's Five Forces for Eigenmann & Veronelli—quickly spot competitive pressure, customize force levels with new data, and drop the clean spider chart into decks for faster, board-ready strategic decisions.
Customers Bargaining Power

Diverse customer base
Eigenmann & Veronelli serves food, pharma, cosmetics and industrial segments, reducing dependence on any single buyer and diluting individual customer bargaining power. Diversification across these sectors lowers revenue concentration risk, but specialized segments require tailored technical support and supply-chain flexibility. The company’s broad portfolio enables cross-selling and better alignment with varied industry requirements.
Large accounts negotiate hard
Large multinationals and OEMs exert strong pricing and service demands, often running formal tenders and requiring vendor-managed inventory; in 2024 many negotiated payment terms up to 90 days, increasing working capital pressure. Their volumes can compress supplier margins, so E&V often trades lower prices for multi-year pipeline access and cross-selling commitments to secure scale and predictable revenue.

Technical service reduces price sensitivity
Where formulation support and regulatory compliance are critical, buyers prioritize reliability over lowest price, reducing price sensitivity. Qualification timelines of 6–18 months and audit-driven supplier validation raise switching costs and soften pure price bargaining. Eigenmann & Veronelli’s in-house labs and application expertise further reinforce this advantage by shortening development cycles and mitigating supply risk.

Multi-sourcing options
Many buyers keep 2–3 alternate suppliers for risk management, preserving negotiating leverage; commodity lines face higher substitution risk than specialty products, reducing buyer lock-in. Framework agreements commonly cap annual price increases at 2–4%, constraining supplier pricing. E&V mitigates pressure by differentiating through service SLAs and a broader substitutes catalogue.
- 2–3 alternate suppliers typical
- Commodities = higher substitution risk
- Framework caps 2–4%/yr
- E&V differentiates via SLAs & breadth
Working capital terms
Buyers increasingly demand 60–90 day credit and higher inventory buffers, straining distributor cash flows as DSO can rise ~10–15 days; term concessions often equal the impact of price cuts. Eigenmann & Veronelli’s strong balance sheet and lean logistics let it absorb selective term risk, while dynamic pricing and faster inventory turns (improving turns by 0.5–1.0x) mitigate working capital drag.
- Buyer terms: 60–90 days
- DSO impact: +10–15 days
- E&V strengths: strong balance sheet, efficient logistics
- Offsets: dynamic pricing, +0.5–1.0x turns
Customers wield power: OEMs set 60-90d, caps 2-4%/yr
Customers wield moderate-to-high bargaining power: large OEMs drive 60–90 day terms and formal tenders, while technical/regulatory needs raise switching costs (qualification 6–18 months). Commodity lines see higher substitution; framework contracts cap price rises 2–4%/yr. E&V offsets pressure via SLAs, in‑house labs, strong balance sheet and faster turns (+0.5–1.0x).
| Metric | 2024 | Impact |
|---|---|---|
| Buyer terms | 60–90 days | Working capital strain |
| DSO change | +10–15 days | Cash drag |
| Price caps | 2–4%/yr | Limits pricing |
Same Document Delivered
Eigenmann & Veronelli Porter's Five Forces Analysis
This preview shows the exact Eigenmann & Veronelli Porter's Five Forces Analysis you'll receive immediately after purchase—no surprises, no placeholders. It's fully formatted, professionally written, and ready for download and use the moment you buy. You're looking at the actual deliverable.

Elevate Your Analysis with the Complete Porter's Five Forces Analysis
Eigenmann & Veronelli faces moderate supplier power but intense buyer expectations and growing private-label competition, while regulatory and capital barriers influence entrant threats. This snapshot outlines core competitive levers and strategic vulnerabilities. This brief only scratches the surface—unlock the full Porter's Five Forces Analysis for force-by-force ratings, visuals, and actionable recommendations.
Suppliers Bargaining Power
Concentrated global producers
Specialty chemicals are concentrated among a few global producers, with the top 10 firms holding roughly 35% of the market in 2024, raising supplier leverage over pricing and availability.
Manufacturers owning proprietary IP or regulatory approvals can enforce territory exclusivities and tougher contract terms, squeezing distributor margins and imposing volume targets.
Eigenmann & Veronelli offsets this by maintaining a broad portfolio and cross-category sourcing options, reducing reliance on any single supplier and preserving margin flexibility.
Exclusivity and agency agreements
Regional exclusivity strengthens supplier power by tying access to key brands and technologies, with exclusive lines often representing 25–40% of a distributor’s revenue mix and driving customer stickiness.
Suppliers commonly mandate technical promotion, minimum inventory commitments (often 60–120 days) and KPIs such as 5–10% annual sell-through growth or specified display/share targets.
Losing an exclusive line can materially reduce revenue mix and retention; strong sales performance and market coverage are critical for E&V to retain supplier mandates.
Regulatory and quality gatekeeping
Compliance regimes—REACH (over 21,000 registered substances as of 2024), GMP and food/pharma standards—give suppliers leverage through documentation control and formal change-management, forcing downstream re-approvals and raising switching costs. Suppliers frequently pass compliance and certification costs through price adjustments. Eigenmann & Veronelli’s regulatory support and dossier management reduces approval friction and dependency risk.
Capacity cycles and allocation power
Brand equity and application know-how
Leading suppliers bundle products with application labs and co-development, embedding trials, technical data and approvals into customers’ processes and raising supplier bargaining power; in specialty chemicals the broader market size reached about USD 900 billion in 2024, increasing incentives for bundled service models. Distributors compete fiercely for access to these toolkits while E&V’s technical service can complement and rebalance supplier influence.
- Bundled labs increase supplier lock-in
- Embedded approvals raise switching costs
- Distributors vie for toolkit access
- E&V technical service mitigates supplier power
Supplier power tightens: concentration, exclusives and regulation strain specialty chemical supply
Suppliers are concentrated (top 10 ≈ 35% of market in 2024), giving pricing and availability leverage. Proprietary IP, exclusivities and bundled labs raise switching costs and lock customers (exclusive lines often 25–40% of distributor revenue). E&V reduces dependence via broad cross‑category sourcing, technical services and forecasting. Compliance burdens (REACH ≈ 21,000 substances) and tight feedstock (US refinery utilization ≈ 86% in 2024) strengthen supplier power.
| Metric | 2024 value |
|---|---|
| Top 10 market share | ≈35% |
| Specialty chemicals market | USD 900bn |
| REACH registered substances | ≈21,000 |
| US refinery utilization | ≈86% |
| Exclusive lines revenue mix | 25–40% |
| Inventory commitments | 60–120 days |
What is included in the product
Detailed Word Document
Tailored Porter's Five Forces analysis for Eigenmann & Veronelli that uncovers key drivers of competition, buyer and supplier power, and market entry risks; includes identification of disruptive substitutes and emerging threats to market share. Designed for easy editing and incorporation into investor materials, strategy decks, or academic projects.
Customizable Excel Spreadsheet
A concise one-sheet Porter's Five Forces for Eigenmann & Veronelli—quickly spot competitive pressure, customize force levels with new data, and drop the clean spider chart into decks for faster, board-ready strategic decisions.
Customers Bargaining Power
Diverse customer base
Eigenmann & Veronelli serves food, pharma, cosmetics and industrial segments, reducing dependence on any single buyer and diluting individual customer bargaining power. Diversification across these sectors lowers revenue concentration risk, but specialized segments require tailored technical support and supply-chain flexibility. The company’s broad portfolio enables cross-selling and better alignment with varied industry requirements.
Large accounts negotiate hard
Large multinationals and OEMs exert strong pricing and service demands, often running formal tenders and requiring vendor-managed inventory; in 2024 many negotiated payment terms up to 90 days, increasing working capital pressure. Their volumes can compress supplier margins, so E&V often trades lower prices for multi-year pipeline access and cross-selling commitments to secure scale and predictable revenue.
Technical service reduces price sensitivity
Where formulation support and regulatory compliance are critical, buyers prioritize reliability over lowest price, reducing price sensitivity. Qualification timelines of 6–18 months and audit-driven supplier validation raise switching costs and soften pure price bargaining. Eigenmann & Veronelli’s in-house labs and application expertise further reinforce this advantage by shortening development cycles and mitigating supply risk.
Multi-sourcing options
Many buyers keep 2–3 alternate suppliers for risk management, preserving negotiating leverage; commodity lines face higher substitution risk than specialty products, reducing buyer lock-in. Framework agreements commonly cap annual price increases at 2–4%, constraining supplier pricing. E&V mitigates pressure by differentiating through service SLAs and a broader substitutes catalogue.
- 2–3 alternate suppliers typical
- Commodities = higher substitution risk
- Framework caps 2–4%/yr
- E&V differentiates via SLAs & breadth
Working capital terms
Buyers increasingly demand 60–90 day credit and higher inventory buffers, straining distributor cash flows as DSO can rise ~10–15 days; term concessions often equal the impact of price cuts. Eigenmann & Veronelli’s strong balance sheet and lean logistics let it absorb selective term risk, while dynamic pricing and faster inventory turns (improving turns by 0.5–1.0x) mitigate working capital drag.
- Buyer terms: 60–90 days
- DSO impact: +10–15 days
- E&V strengths: strong balance sheet, efficient logistics
- Offsets: dynamic pricing, +0.5–1.0x turns
Customers wield power: OEMs set 60-90d, caps 2-4%/yr
Customers wield moderate-to-high bargaining power: large OEMs drive 60–90 day terms and formal tenders, while technical/regulatory needs raise switching costs (qualification 6–18 months). Commodity lines see higher substitution; framework contracts cap price rises 2–4%/yr. E&V offsets pressure via SLAs, in‑house labs, strong balance sheet and faster turns (+0.5–1.0x).
| Metric | 2024 | Impact |
|---|---|---|
| Buyer terms | 60–90 days | Working capital strain |
| DSO change | +10–15 days | Cash drag |
| Price caps | 2–4%/yr | Limits pricing |
Same Document Delivered
Eigenmann & Veronelli Porter's Five Forces Analysis
This preview shows the exact Eigenmann & Veronelli Porter's Five Forces Analysis you'll receive immediately after purchase—no surprises, no placeholders. It's fully formatted, professionally written, and ready for download and use the moment you buy. You're looking at the actual deliverable.
Original: $10.00
-65%$10.00
$3.50Description
Elevate Your Analysis with the Complete Porter's Five Forces Analysis
Eigenmann & Veronelli faces moderate supplier power but intense buyer expectations and growing private-label competition, while regulatory and capital barriers influence entrant threats. This snapshot outlines core competitive levers and strategic vulnerabilities. This brief only scratches the surface—unlock the full Porter's Five Forces Analysis for force-by-force ratings, visuals, and actionable recommendations.
Suppliers Bargaining Power
Concentrated global producers
Specialty chemicals are concentrated among a few global producers, with the top 10 firms holding roughly 35% of the market in 2024, raising supplier leverage over pricing and availability.
Manufacturers owning proprietary IP or regulatory approvals can enforce territory exclusivities and tougher contract terms, squeezing distributor margins and imposing volume targets.
Eigenmann & Veronelli offsets this by maintaining a broad portfolio and cross-category sourcing options, reducing reliance on any single supplier and preserving margin flexibility.
Exclusivity and agency agreements
Regional exclusivity strengthens supplier power by tying access to key brands and technologies, with exclusive lines often representing 25–40% of a distributor’s revenue mix and driving customer stickiness.
Suppliers commonly mandate technical promotion, minimum inventory commitments (often 60–120 days) and KPIs such as 5–10% annual sell-through growth or specified display/share targets.
Losing an exclusive line can materially reduce revenue mix and retention; strong sales performance and market coverage are critical for E&V to retain supplier mandates.
Regulatory and quality gatekeeping
Compliance regimes—REACH (over 21,000 registered substances as of 2024), GMP and food/pharma standards—give suppliers leverage through documentation control and formal change-management, forcing downstream re-approvals and raising switching costs. Suppliers frequently pass compliance and certification costs through price adjustments. Eigenmann & Veronelli’s regulatory support and dossier management reduces approval friction and dependency risk.
Capacity cycles and allocation power
Brand equity and application know-how
Leading suppliers bundle products with application labs and co-development, embedding trials, technical data and approvals into customers’ processes and raising supplier bargaining power; in specialty chemicals the broader market size reached about USD 900 billion in 2024, increasing incentives for bundled service models. Distributors compete fiercely for access to these toolkits while E&V’s technical service can complement and rebalance supplier influence.
- Bundled labs increase supplier lock-in
- Embedded approvals raise switching costs
- Distributors vie for toolkit access
- E&V technical service mitigates supplier power
Supplier power tightens: concentration, exclusives and regulation strain specialty chemical supply
Suppliers are concentrated (top 10 ≈ 35% of market in 2024), giving pricing and availability leverage. Proprietary IP, exclusivities and bundled labs raise switching costs and lock customers (exclusive lines often 25–40% of distributor revenue). E&V reduces dependence via broad cross‑category sourcing, technical services and forecasting. Compliance burdens (REACH ≈ 21,000 substances) and tight feedstock (US refinery utilization ≈ 86% in 2024) strengthen supplier power.
| Metric | 2024 value |
|---|---|
| Top 10 market share | ≈35% |
| Specialty chemicals market | USD 900bn |
| REACH registered substances | ≈21,000 |
| US refinery utilization | ≈86% |
| Exclusive lines revenue mix | 25–40% |
| Inventory commitments | 60–120 days |
What is included in the product
Detailed Word Document
Tailored Porter's Five Forces analysis for Eigenmann & Veronelli that uncovers key drivers of competition, buyer and supplier power, and market entry risks; includes identification of disruptive substitutes and emerging threats to market share. Designed for easy editing and incorporation into investor materials, strategy decks, or academic projects.
Customizable Excel Spreadsheet
A concise one-sheet Porter's Five Forces for Eigenmann & Veronelli—quickly spot competitive pressure, customize force levels with new data, and drop the clean spider chart into decks for faster, board-ready strategic decisions.
Customers Bargaining Power
Diverse customer base
Eigenmann & Veronelli serves food, pharma, cosmetics and industrial segments, reducing dependence on any single buyer and diluting individual customer bargaining power. Diversification across these sectors lowers revenue concentration risk, but specialized segments require tailored technical support and supply-chain flexibility. The company’s broad portfolio enables cross-selling and better alignment with varied industry requirements.
Large accounts negotiate hard
Large multinationals and OEMs exert strong pricing and service demands, often running formal tenders and requiring vendor-managed inventory; in 2024 many negotiated payment terms up to 90 days, increasing working capital pressure. Their volumes can compress supplier margins, so E&V often trades lower prices for multi-year pipeline access and cross-selling commitments to secure scale and predictable revenue.
Technical service reduces price sensitivity
Where formulation support and regulatory compliance are critical, buyers prioritize reliability over lowest price, reducing price sensitivity. Qualification timelines of 6–18 months and audit-driven supplier validation raise switching costs and soften pure price bargaining. Eigenmann & Veronelli’s in-house labs and application expertise further reinforce this advantage by shortening development cycles and mitigating supply risk.
Multi-sourcing options
Many buyers keep 2–3 alternate suppliers for risk management, preserving negotiating leverage; commodity lines face higher substitution risk than specialty products, reducing buyer lock-in. Framework agreements commonly cap annual price increases at 2–4%, constraining supplier pricing. E&V mitigates pressure by differentiating through service SLAs and a broader substitutes catalogue.
- 2–3 alternate suppliers typical
- Commodities = higher substitution risk
- Framework caps 2–4%/yr
- E&V differentiates via SLAs & breadth
Working capital terms
Buyers increasingly demand 60–90 day credit and higher inventory buffers, straining distributor cash flows as DSO can rise ~10–15 days; term concessions often equal the impact of price cuts. Eigenmann & Veronelli’s strong balance sheet and lean logistics let it absorb selective term risk, while dynamic pricing and faster inventory turns (improving turns by 0.5–1.0x) mitigate working capital drag.
- Buyer terms: 60–90 days
- DSO impact: +10–15 days
- E&V strengths: strong balance sheet, efficient logistics
- Offsets: dynamic pricing, +0.5–1.0x turns
Customers wield power: OEMs set 60-90d, caps 2-4%/yr
Customers wield moderate-to-high bargaining power: large OEMs drive 60–90 day terms and formal tenders, while technical/regulatory needs raise switching costs (qualification 6–18 months). Commodity lines see higher substitution; framework contracts cap price rises 2–4%/yr. E&V offsets pressure via SLAs, in‑house labs, strong balance sheet and faster turns (+0.5–1.0x).
| Metric | 2024 | Impact |
|---|---|---|
| Buyer terms | 60–90 days | Working capital strain |
| DSO change | +10–15 days | Cash drag |
| Price caps | 2–4%/yr | Limits pricing |
Same Document Delivered
Eigenmann & Veronelli Porter's Five Forces Analysis
This preview shows the exact Eigenmann & Veronelli Porter's Five Forces Analysis you'll receive immediately after purchase—no surprises, no placeholders. It's fully formatted, professionally written, and ready for download and use the moment you buy. You're looking at the actual deliverable.











