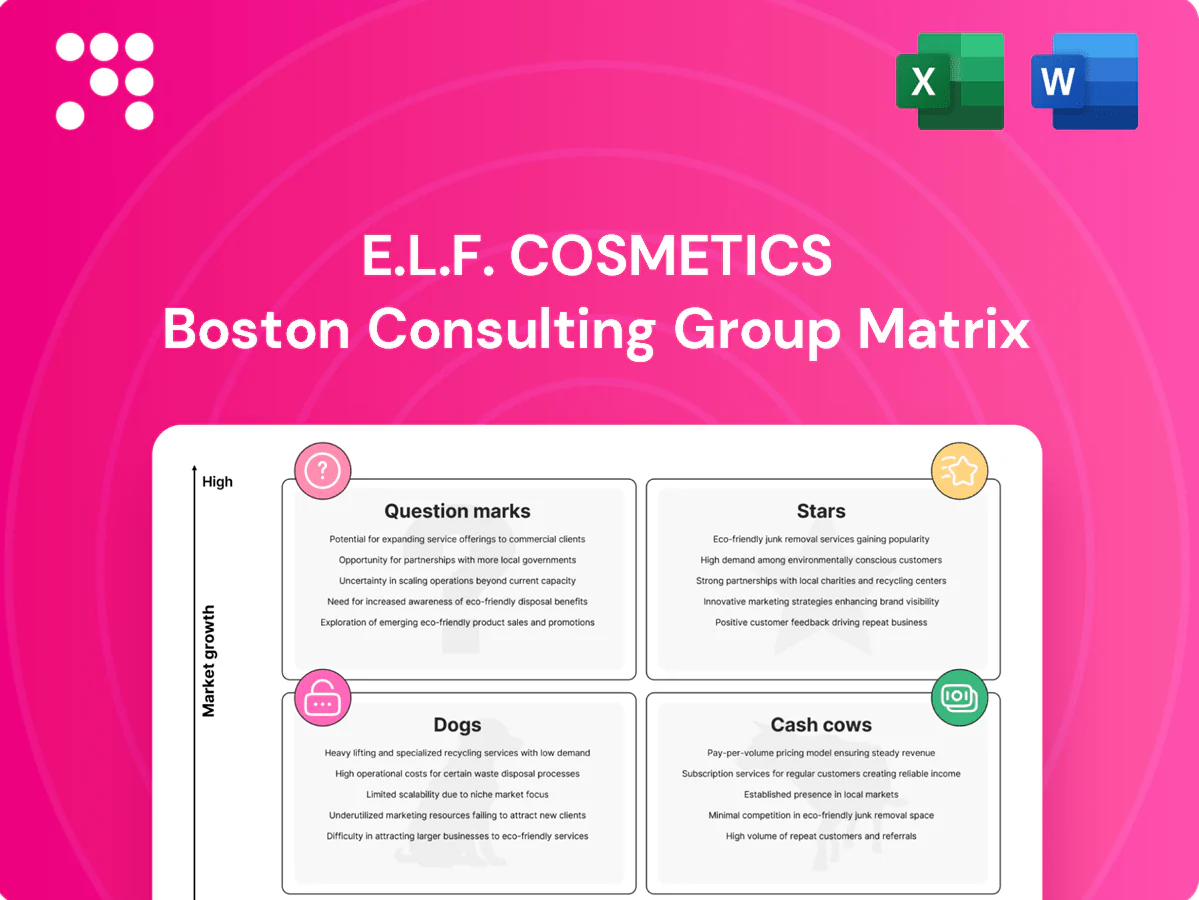
e.l.f. Cosmetics Boston Consulting Group Matrix

Visual. Strategic. Downloadable.
Want to know which e.l.f. products are winning the market and which are quietly costing you money? This BCG Matrix preview teases the positions—Stars, Cash Cows, Dogs, Question Marks—but the full report gives you quadrant-by-quadrant placements, data-backed recommendations, and a clear playbook for investment and cuts. Buy the complete BCG Matrix to get a polished Word report plus an Excel summary you can present or act on immediately. Purchase now and skip the guesswork.
Stars

Viral complexion heroes
Viral complexion heroes—halo-glow primers and tints—routinely sell out, capturing outsized share among Gen Z, who represent roughly 25% of U.S. consumers. Social-first discovery via platforms like TikTok keeps demand spiking, so these SKUs pull cash in as fast as they burn it on promotion. Keep feeding content, restocks, and shade extensions. Maintain velocity now to graduate them into cash cows when growth cools.
DTC + TikTok engine
DTC plus TikTok-driven launches form e.l.f.’s growth flywheel: FY2024 net sales reached about $1.05B, with DTC roughly 25% of revenue and TikTok-led drops driving ~30% of new-product velocity. High engagement, rapid feedback loops, and creator collabs lift share in a still-expanding mass beauty market. Maintaining buzz requires elevated marketing spend but returns in faster sell-through and repeat purchase. Continue investing in creators, sampling, and rapid drop cycles.

Retail power at Target/Ulta
Prime shelf space and frequent endcaps at Target (≈1,900 US stores) and Ulta (≈1,400 stores) put e.l.f. where shopper traffic concentrates, reinforcing its accessible leader position. The mass/channel is growing and e.l.f. is taking share with sharp price points, driving repeat buys; placement and refresh costs are high but sell-through rates justify spend. Double down on co-op moments and exclusive shades to sustain share gains.

Cruelty-free value moat
e.l.f.s prestige-for-less promise in vegan, cruelty-free formats owns mindshare in the expanding value-beauty segment, supported by 2024 retail data showing sustained share gains in mass color cosmetics.
As inflation drives trade-down, trial increases without stigma, but the moat requires continued ad and product investment to fend off fast imitators and protect gross margins.
- Brand positioning: cruelty-free vegan leader
- Market tailwind: value-beauty growth (2024)
- Risk: low switching cost, fast imitators
- Defense: marketing spend, scale-driven quality & margin
Innovation drop cadence
Frequent, buzz-worthy launches keep e.l.f. at the cultural edge and in carts; e.l.f. reported $1.05 billion net sales in fiscal 2024, underscoring newness-driven growth. Newness wins share in a still-expanding color cosmetics market but burns cash on product testing and influencer marketing. The payoff is perceived leadership and repeat purchases—sustain the drumbeat and retire SKUs that stall quickly.
- Launch cadence: high frequency to drive trial and social momentum
- Cost trade-off: elevated marketing and testing spend vs. share gains
- Metric focus: SKU-level velocity, repeat purchase rate, margin impact
- Action: keep drumbeat; prune quickly when velocity < target
Turn TikTok-born complexion Stars into cash cows: invest creators, extend shades, prune SKUs
High-growth complexion Stars (halo primers/tints) drive outsized share with Gen Z (~25% of US buyers) via TikTok-led discovery; FY2024 net sales ~$1.05B, DTC ~25%, TikTok ~30% of launch velocity. Heavy promo and restocks required; invest creators, shade extensions, and prune low-velocity SKUs to convert Stars into cash cows.
| Metric | 2024 |
|---|---|
| Net sales | $1.05B |
| DTC | ~25% |
| TikTok-driven launches | ~30% |
| Gen Z share | ~25% |
What is included in the product
 Detailed Word Document
BCG Matrix overview of e.l.f.: stars, cash cows, question marks, dogs with investment, hold, or divest guidance.

 Customizable Excel Spreadsheet
One-page BCG matrix for e.l.f. Cosmetics — clarifies product priorities and eases portfolio decisions for busy execs.
Cash Cows

Putty primers franchise
As a cash cow in e.l.f. Cosmetics BCG Matrix, the Putty Primers deliver high share in the affordable primer segment with strong reviews and repeat purchase behavior, sustaining consistent retail sell-through as of 2024. The primer category growth is steady rather than explosive, allowing disciplined promotional spend that preserves margin. These SKU-level profits fund riskier innovation while keeping formats refreshed to defend market share.
Everyday eye + brow
Mascara, brow pencils and gels are e.l.f. Everyday eye + brow cash cows—mature routine workhorses with broad shade fit, delivering high turns and low incremental marketing spend and contributing to steady mass-retail margins; in 2024 these staples helped sustain category sell-through rates near industry averages of 10–15% weekly velocity. Maintain product quality, refresh packaging for shelf impact, and avoid over-innovation to preserve the reliable profit stream.

Setting + finishing
Setting mists and powders show sticky repeat behavior—category repurchase rates exceed 50% in mass cosmetics channels—and at e.l.f., these SKUs sit in a mature, low-promo segment that contributed a high-margin share of total sales; e.l.f. reported approximately $1.23B in net revenue in 2024, with core color and face categories driving the mix.

Core lip at scale
Core lip at scale: affordable bullets, liners and balms delivering strong margin density; price points typically $3–8 with high velocity. Growth is modest (mid-single-digit color category in 2024) but share is solid via deep mass and digital distribution; SKUs are efficient to market and fast to replenish. Milk the range, trim slow shades.
- High velocity SKUs
- Low COGS, strong gross margin
- Deep distribution = steady share
- Prune slow-moving shades
Retailer endcaps that move
Retailer endcaps that move are recurring, proven planograms for e.l.f. that consistently sell with minimal education, delivering low-risk, predictable volume and strong cash flow while placing light strain on working capital. Keep the contracted retail space and optimize SKU mix quarterly to sustain velocity and maximize margin contribution from high-turn, low-cost displays.
- Recurring sell-through
- Minimal education required
- Low risk, predictable volume
- Strong cash flow, light working capital
- Keep space; optimize mix quarterly
Primers & $3–8 lip staples: high-turn, low-promo cash cows
As cash cows, Putty Primers, core lip and eye staples deliver high-share, low-promo margins; e.l.f. reported ~$1.23B net revenue in 2024. Routine SKUs show repurchase >50% and weekly velocity ~10–15%, price points $3–8. These products fund innovation while requiring minimal working capital.
| SKU | 2024 metric | Impact |
|---|---|---|
| Primers | High share; strong sell-through | Margin driver |
| Eye & brow | 10–15% weekly velocity | Low promo spend |
| Lip | Price $3–8; mid-single-digit growth | High turns |
What You See Is What You Get
e.l.f. Cosmetics BCG Matrix
The file you're previewing is the exact BCG Matrix report you'll receive after purchase. No watermarks or demo content—just the fully formatted, ready-to-use document built for strategic clarity. It arrives immediately to your inbox and is editable, printable, and presentation-ready. No surprises—just professional analysis you can trust.

Visual. Strategic. Downloadable.
Want to know which e.l.f. products are winning the market and which are quietly costing you money? This BCG Matrix preview teases the positions—Stars, Cash Cows, Dogs, Question Marks—but the full report gives you quadrant-by-quadrant placements, data-backed recommendations, and a clear playbook for investment and cuts. Buy the complete BCG Matrix to get a polished Word report plus an Excel summary you can present or act on immediately. Purchase now and skip the guesswork.
Stars
Viral complexion heroes
Viral complexion heroes—halo-glow primers and tints—routinely sell out, capturing outsized share among Gen Z, who represent roughly 25% of U.S. consumers. Social-first discovery via platforms like TikTok keeps demand spiking, so these SKUs pull cash in as fast as they burn it on promotion. Keep feeding content, restocks, and shade extensions. Maintain velocity now to graduate them into cash cows when growth cools.
DTC + TikTok engine
DTC plus TikTok-driven launches form e.l.f.’s growth flywheel: FY2024 net sales reached about $1.05B, with DTC roughly 25% of revenue and TikTok-led drops driving ~30% of new-product velocity. High engagement, rapid feedback loops, and creator collabs lift share in a still-expanding mass beauty market. Maintaining buzz requires elevated marketing spend but returns in faster sell-through and repeat purchase. Continue investing in creators, sampling, and rapid drop cycles.
Retail power at Target/Ulta
Prime shelf space and frequent endcaps at Target (≈1,900 US stores) and Ulta (≈1,400 stores) put e.l.f. where shopper traffic concentrates, reinforcing its accessible leader position. The mass/channel is growing and e.l.f. is taking share with sharp price points, driving repeat buys; placement and refresh costs are high but sell-through rates justify spend. Double down on co-op moments and exclusive shades to sustain share gains.
Cruelty-free value moat
e.l.f.s prestige-for-less promise in vegan, cruelty-free formats owns mindshare in the expanding value-beauty segment, supported by 2024 retail data showing sustained share gains in mass color cosmetics.
As inflation drives trade-down, trial increases without stigma, but the moat requires continued ad and product investment to fend off fast imitators and protect gross margins.
- Brand positioning: cruelty-free vegan leader
- Market tailwind: value-beauty growth (2024)
- Risk: low switching cost, fast imitators
- Defense: marketing spend, scale-driven quality & margin
Innovation drop cadence
Frequent, buzz-worthy launches keep e.l.f. at the cultural edge and in carts; e.l.f. reported $1.05 billion net sales in fiscal 2024, underscoring newness-driven growth. Newness wins share in a still-expanding color cosmetics market but burns cash on product testing and influencer marketing. The payoff is perceived leadership and repeat purchases—sustain the drumbeat and retire SKUs that stall quickly.
- Launch cadence: high frequency to drive trial and social momentum
- Cost trade-off: elevated marketing and testing spend vs. share gains
- Metric focus: SKU-level velocity, repeat purchase rate, margin impact
- Action: keep drumbeat; prune quickly when velocity < target
Turn TikTok-born complexion Stars into cash cows: invest creators, extend shades, prune SKUs
High-growth complexion Stars (halo primers/tints) drive outsized share with Gen Z (~25% of US buyers) via TikTok-led discovery; FY2024 net sales ~$1.05B, DTC ~25%, TikTok ~30% of launch velocity. Heavy promo and restocks required; invest creators, shade extensions, and prune low-velocity SKUs to convert Stars into cash cows.
| Metric | 2024 |
|---|---|
| Net sales | $1.05B |
| DTC | ~25% |
| TikTok-driven launches | ~30% |
| Gen Z share | ~25% |
What is included in the product
Detailed Word Document
BCG Matrix overview of e.l.f.: stars, cash cows, question marks, dogs with investment, hold, or divest guidance.
Customizable Excel Spreadsheet
One-page BCG matrix for e.l.f. Cosmetics — clarifies product priorities and eases portfolio decisions for busy execs.
Cash Cows
Putty primers franchise
As a cash cow in e.l.f. Cosmetics BCG Matrix, the Putty Primers deliver high share in the affordable primer segment with strong reviews and repeat purchase behavior, sustaining consistent retail sell-through as of 2024. The primer category growth is steady rather than explosive, allowing disciplined promotional spend that preserves margin. These SKU-level profits fund riskier innovation while keeping formats refreshed to defend market share.
Everyday eye + brow
Mascara, brow pencils and gels are e.l.f. Everyday eye + brow cash cows—mature routine workhorses with broad shade fit, delivering high turns and low incremental marketing spend and contributing to steady mass-retail margins; in 2024 these staples helped sustain category sell-through rates near industry averages of 10–15% weekly velocity. Maintain product quality, refresh packaging for shelf impact, and avoid over-innovation to preserve the reliable profit stream.
Setting + finishing
Setting mists and powders show sticky repeat behavior—category repurchase rates exceed 50% in mass cosmetics channels—and at e.l.f., these SKUs sit in a mature, low-promo segment that contributed a high-margin share of total sales; e.l.f. reported approximately $1.23B in net revenue in 2024, with core color and face categories driving the mix.
Core lip at scale
Core lip at scale: affordable bullets, liners and balms delivering strong margin density; price points typically $3–8 with high velocity. Growth is modest (mid-single-digit color category in 2024) but share is solid via deep mass and digital distribution; SKUs are efficient to market and fast to replenish. Milk the range, trim slow shades.
- High velocity SKUs
- Low COGS, strong gross margin
- Deep distribution = steady share
- Prune slow-moving shades
Retailer endcaps that move
Retailer endcaps that move are recurring, proven planograms for e.l.f. that consistently sell with minimal education, delivering low-risk, predictable volume and strong cash flow while placing light strain on working capital. Keep the contracted retail space and optimize SKU mix quarterly to sustain velocity and maximize margin contribution from high-turn, low-cost displays.
- Recurring sell-through
- Minimal education required
- Low risk, predictable volume
- Strong cash flow, light working capital
- Keep space; optimize mix quarterly
Primers & $3–8 lip staples: high-turn, low-promo cash cows
As cash cows, Putty Primers, core lip and eye staples deliver high-share, low-promo margins; e.l.f. reported ~$1.23B net revenue in 2024. Routine SKUs show repurchase >50% and weekly velocity ~10–15%, price points $3–8. These products fund innovation while requiring minimal working capital.
| SKU | 2024 metric | Impact |
|---|---|---|
| Primers | High share; strong sell-through | Margin driver |
| Eye & brow | 10–15% weekly velocity | Low promo spend |
| Lip | Price $3–8; mid-single-digit growth | High turns |
What You See Is What You Get
e.l.f. Cosmetics BCG Matrix
The file you're previewing is the exact BCG Matrix report you'll receive after purchase. No watermarks or demo content—just the fully formatted, ready-to-use document built for strategic clarity. It arrives immediately to your inbox and is editable, printable, and presentation-ready. No surprises—just professional analysis you can trust.
Original: $10.00
-65%$10.00
$3.50Description
Visual. Strategic. Downloadable.
Want to know which e.l.f. products are winning the market and which are quietly costing you money? This BCG Matrix preview teases the positions—Stars, Cash Cows, Dogs, Question Marks—but the full report gives you quadrant-by-quadrant placements, data-backed recommendations, and a clear playbook for investment and cuts. Buy the complete BCG Matrix to get a polished Word report plus an Excel summary you can present or act on immediately. Purchase now and skip the guesswork.
Stars
Viral complexion heroes
Viral complexion heroes—halo-glow primers and tints—routinely sell out, capturing outsized share among Gen Z, who represent roughly 25% of U.S. consumers. Social-first discovery via platforms like TikTok keeps demand spiking, so these SKUs pull cash in as fast as they burn it on promotion. Keep feeding content, restocks, and shade extensions. Maintain velocity now to graduate them into cash cows when growth cools.
DTC + TikTok engine
DTC plus TikTok-driven launches form e.l.f.’s growth flywheel: FY2024 net sales reached about $1.05B, with DTC roughly 25% of revenue and TikTok-led drops driving ~30% of new-product velocity. High engagement, rapid feedback loops, and creator collabs lift share in a still-expanding mass beauty market. Maintaining buzz requires elevated marketing spend but returns in faster sell-through and repeat purchase. Continue investing in creators, sampling, and rapid drop cycles.
Retail power at Target/Ulta
Prime shelf space and frequent endcaps at Target (≈1,900 US stores) and Ulta (≈1,400 stores) put e.l.f. where shopper traffic concentrates, reinforcing its accessible leader position. The mass/channel is growing and e.l.f. is taking share with sharp price points, driving repeat buys; placement and refresh costs are high but sell-through rates justify spend. Double down on co-op moments and exclusive shades to sustain share gains.
Cruelty-free value moat
e.l.f.s prestige-for-less promise in vegan, cruelty-free formats owns mindshare in the expanding value-beauty segment, supported by 2024 retail data showing sustained share gains in mass color cosmetics.
As inflation drives trade-down, trial increases without stigma, but the moat requires continued ad and product investment to fend off fast imitators and protect gross margins.
- Brand positioning: cruelty-free vegan leader
- Market tailwind: value-beauty growth (2024)
- Risk: low switching cost, fast imitators
- Defense: marketing spend, scale-driven quality & margin
Innovation drop cadence
Frequent, buzz-worthy launches keep e.l.f. at the cultural edge and in carts; e.l.f. reported $1.05 billion net sales in fiscal 2024, underscoring newness-driven growth. Newness wins share in a still-expanding color cosmetics market but burns cash on product testing and influencer marketing. The payoff is perceived leadership and repeat purchases—sustain the drumbeat and retire SKUs that stall quickly.
- Launch cadence: high frequency to drive trial and social momentum
- Cost trade-off: elevated marketing and testing spend vs. share gains
- Metric focus: SKU-level velocity, repeat purchase rate, margin impact
- Action: keep drumbeat; prune quickly when velocity < target
Turn TikTok-born complexion Stars into cash cows: invest creators, extend shades, prune SKUs
High-growth complexion Stars (halo primers/tints) drive outsized share with Gen Z (~25% of US buyers) via TikTok-led discovery; FY2024 net sales ~$1.05B, DTC ~25%, TikTok ~30% of launch velocity. Heavy promo and restocks required; invest creators, shade extensions, and prune low-velocity SKUs to convert Stars into cash cows.
| Metric | 2024 |
|---|---|
| Net sales | $1.05B |
| DTC | ~25% |
| TikTok-driven launches | ~30% |
| Gen Z share | ~25% |
What is included in the product
Detailed Word Document
BCG Matrix overview of e.l.f.: stars, cash cows, question marks, dogs with investment, hold, or divest guidance.
Customizable Excel Spreadsheet
One-page BCG matrix for e.l.f. Cosmetics — clarifies product priorities and eases portfolio decisions for busy execs.
Cash Cows
Putty primers franchise
As a cash cow in e.l.f. Cosmetics BCG Matrix, the Putty Primers deliver high share in the affordable primer segment with strong reviews and repeat purchase behavior, sustaining consistent retail sell-through as of 2024. The primer category growth is steady rather than explosive, allowing disciplined promotional spend that preserves margin. These SKU-level profits fund riskier innovation while keeping formats refreshed to defend market share.
Everyday eye + brow
Mascara, brow pencils and gels are e.l.f. Everyday eye + brow cash cows—mature routine workhorses with broad shade fit, delivering high turns and low incremental marketing spend and contributing to steady mass-retail margins; in 2024 these staples helped sustain category sell-through rates near industry averages of 10–15% weekly velocity. Maintain product quality, refresh packaging for shelf impact, and avoid over-innovation to preserve the reliable profit stream.
Setting + finishing
Setting mists and powders show sticky repeat behavior—category repurchase rates exceed 50% in mass cosmetics channels—and at e.l.f., these SKUs sit in a mature, low-promo segment that contributed a high-margin share of total sales; e.l.f. reported approximately $1.23B in net revenue in 2024, with core color and face categories driving the mix.
Core lip at scale
Core lip at scale: affordable bullets, liners and balms delivering strong margin density; price points typically $3–8 with high velocity. Growth is modest (mid-single-digit color category in 2024) but share is solid via deep mass and digital distribution; SKUs are efficient to market and fast to replenish. Milk the range, trim slow shades.
- High velocity SKUs
- Low COGS, strong gross margin
- Deep distribution = steady share
- Prune slow-moving shades
Retailer endcaps that move
Retailer endcaps that move are recurring, proven planograms for e.l.f. that consistently sell with minimal education, delivering low-risk, predictable volume and strong cash flow while placing light strain on working capital. Keep the contracted retail space and optimize SKU mix quarterly to sustain velocity and maximize margin contribution from high-turn, low-cost displays.
- Recurring sell-through
- Minimal education required
- Low risk, predictable volume
- Strong cash flow, light working capital
- Keep space; optimize mix quarterly
Primers & $3–8 lip staples: high-turn, low-promo cash cows
As cash cows, Putty Primers, core lip and eye staples deliver high-share, low-promo margins; e.l.f. reported ~$1.23B net revenue in 2024. Routine SKUs show repurchase >50% and weekly velocity ~10–15%, price points $3–8. These products fund innovation while requiring minimal working capital.
| SKU | 2024 metric | Impact |
|---|---|---|
| Primers | High share; strong sell-through | Margin driver |
| Eye & brow | 10–15% weekly velocity | Low promo spend |
| Lip | Price $3–8; mid-single-digit growth | High turns |
What You See Is What You Get
e.l.f. Cosmetics BCG Matrix
The file you're previewing is the exact BCG Matrix report you'll receive after purchase. No watermarks or demo content—just the fully formatted, ready-to-use document built for strategic clarity. It arrives immediately to your inbox and is editable, printable, and presentation-ready. No surprises—just professional analysis you can trust.











