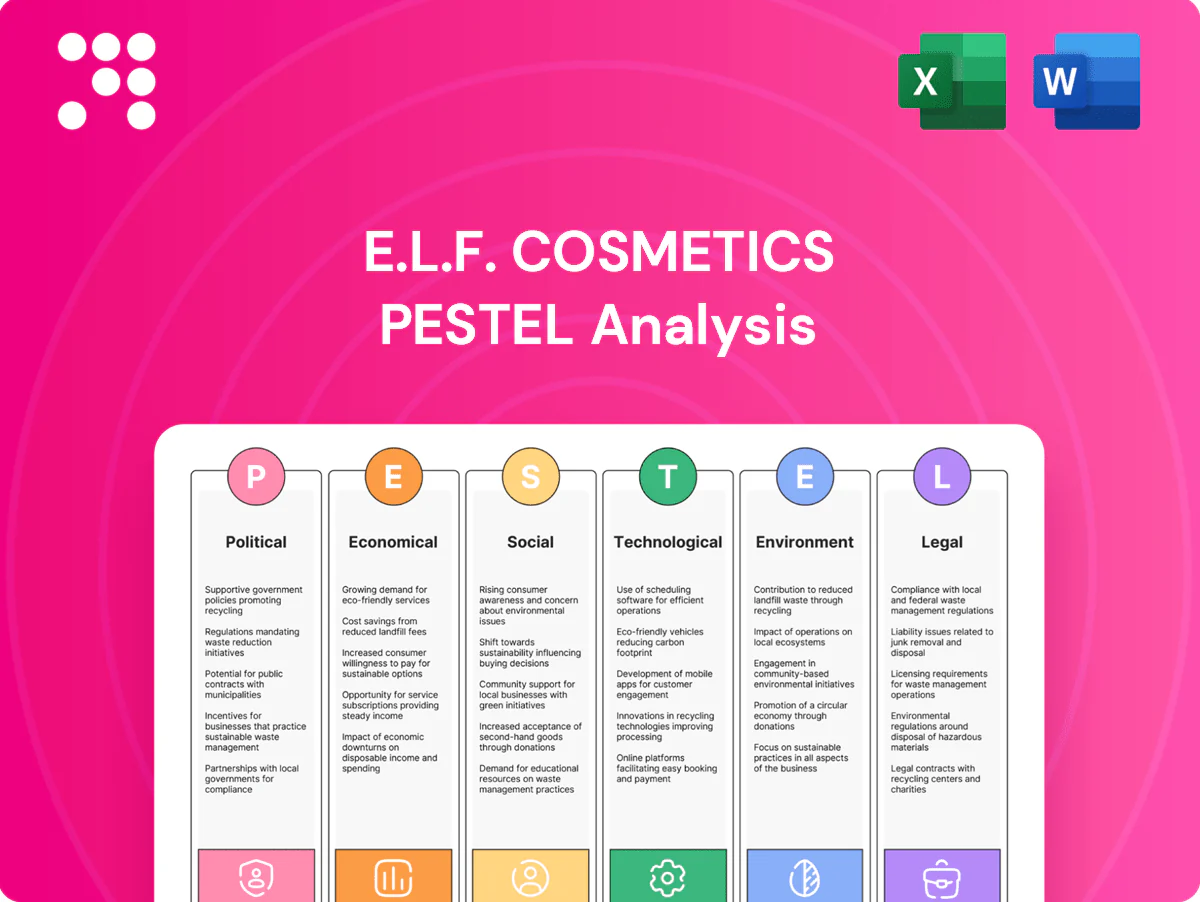
e.l.f. Cosmetics PESTLE Analysis

Your Shortcut to Market Insight Starts Here
Our PESTLE analysis reveals how political, economic and technological shifts are reshaping e.l.f. Cosmetics' growth trajectory. It highlights regulatory risks, consumer trends, supply-chain pressures and sustainability challenges. Purchase the full report to get actionable intelligence and a ready-to-use strategic toolkit.
Political factors

Trade policy shifts
Global tariffs, notably US Section 301 duties on China implemented 2018–19 that reached up to 25%, can raise landed costs for cosmetics inputs and finished goods and squeeze e.l.f.’s margins. e.l.f. must diversify sourcing, monitor U.S.–China and EU trade dynamics, and hedge supplier concentration to avoid margin shocks. Government incentives or relocation restrictions (tax credits, import rules) can materially shift manufacturing footprint economics. Active scenario planning preserves e.l.f.’s price leadership amid tariff volatility.
Animal welfare policies
Government backing for cruelty-free standards strengthens e.l.f.’s positioning as regulatory momentum grows: more than 40 countries now restrict cosmetic animal testing (EU ban effective 2013). Political support for bans raises rivals’ compliance costs and bolsters e.l.f.’s brand equity. Divergent national rules, notably China’s 2021 change removing mandatory testing for many imports, create market-by-market complexity. Active advocacy and compliance readiness speed market access.

Cosmetics oversight expansion
Political momentum—highlighted by the Modernization of Cosmetics Regulation Act (MoCRA) enacted December 2022—drives stricter oversight and increased regulator activity, raising documentation and testing expectations for ingredients and claims.
e.l.f., with robust quality systems and reported fiscal 2024 net sales of about $1.07 billion, gains competitive advantage by exceeding minimums and reducing compliance disruption.
Early, proactive engagement with regulators helps e.l.f. shape pragmatic standards and limit costly rework as enforcement and funding expand.

Retail market access
Political decisions on competition policy and large-retailer practices directly affect e.l.f. Cosmetics shelf access and terms; e.l.f. reported fiscal 2024 net revenue of $1.03 billion, intensifying dependence on retail placement. Localization rules and domestic-content preferences force assortment adjustments, while government trade missions and export programs (e.g., 2024 UK‑US trade initiatives) can open channels. Proactive policy tracking safeguards omnichannel distribution and margins.
Digital platform governance
Political scrutiny of social media and app data flows may change marketing reach and cost, notably across platforms with 2024 MAUs like Meta ~3.0 billion and TikTok ~1.1 billion; regulation-driven targeting limits can raise CPMs and reduce ROI.
- Risk: platform restrictions disrupt influencer activation; influencer market ~21B (2024)
- Action: hedge spend across channels and grow owned communities
- Trust: transparent data use lowers political and consumer backlash
Tariffs, compliance and platform ad shifts reshape beauty market; cruelty-free demand grows
Tariffs (US Section 301 up to 25%) and shifting trade policy raise landed costs and force sourcing diversification; MoCRA (Dec 2022) increases compliance burden. Cruelty-free momentum (40+ countries restrict testing) and China policy changes expand access for e.l.f., supporting fiscal 2024 net sales ~$1.07B. Platform data rules risk higher marketing CPMs (Meta MAU ~3.0B; TikTok ~1.1B).
| Metric | Value |
|---|---|
| FY2024 sales | $1.07B |
| Tariff impact | up to 25% |
| Countries banning animal testing | 40+ |
| Meta MAU | ~3.0B |
What is included in the product
 Detailed Word Document
Explores how Political, Economic, Social, Technological, Environmental and Legal forces shape e.l.f. Cosmetics’ strategy and performance, with data-backed trends, regionally relevant risks/opportunities and forward-looking insights to support executive decision-making and investor communications.

 Customizable Excel Spreadsheet
A clean, summarized PESTLE of e.l.f. Cosmetics for easy reference in meetings, highlighting external risks and opportunities across Political, Economic, Social, Technological, Legal and Environmental factors; editable notes let teams adapt insights to region or business line for faster strategic alignment.
Economic factors

Trade-down dynamics
With US inflation around 3.4% in 2024 squeezing real incomes, consumers traded down to value cosmetics; e.l.f.’s mass-market positioning and average price points below $15 captured share as shoppers sought quality at lower prices. Managing price elasticity is crucial to defend margins, while strategic pack-size and tiered price architecture can boost wallet retention and frequency.
Input cost volatility
Fluctuations in petrochemical feedstocks (Brent averaged about $85/bbl in 2024), botanical extracts and packaging resins directly pressure e.l.f.’s COGS and can swing margins by several percentage points. Global freight and energy swings — SCFI averaged roughly $1,300/container in 2024 — raise landed cost across channels. Hedging, dual sourcing and formulation agility help blunt shocks; realized savings can be reinvested into marketing and product innovation to protect growth.

FX and global sales mix
Currency moves materially affect e.l.f. Cosmetics' translated international revenue and import costs; e.l.f. reported roughly $820 million in net sales for fiscal 2024, meaning USD strength can meaningfully compress overseas margins. A stronger dollar in 2024 (U.S. Dollar Index rose about 4% year-over-year) lowered some input prices but reduced reported non‑U.S. sales. Diversified sourcing and manufacturing footprint provide natural hedges, and pricing governance (tight global MSRP control) limits FX-driven volatility in retail tags.

Ad spend efficiency
Ad spend efficiency: digital CPMs and CACs fluctuate with macro cycles and platform auctions—platform CPMs rose about 20% in 2024, pressuring beauty advertisers; e.l.f. leans on efficient social and influencer ROI to scale profitably while keeping marketing-to-sales disciplined after FY2024 net sales near $1.06B. MMM and incrementality testing are used to preserve ROI during cost spikes, and a strong creative engine mitigates bid inflation.
- CPM pressure ~+20% (2024)
- e.l.f. FY2024 net sales ~1.06B
- MMM/incrementality preserve efficiency
- Creative engine offsets bid inflation
Rate and credit conditions
Higher interest rates raise financing costs and dampen discretionary spend; the US federal funds rate stood at 5.25–5.50% in mid-2025, tightening consumer demand for beauty discretionary categories.
e.l.f.’s strong cash generation and low leverage enhance resilience versus peers, supporting operations through slower sales periods.
Vendor terms, faster inventory turns and flexible capex enable cost control and opportunistic growth in downturns.
- rate: Fed 5.25–5.50% (mid-2025)
- liquidity: strong cash generation
- ops: vendor terms + inventory turns critical
- strategy: flexible capex for opportunistic M&A/growth
Tariffs, compliance and platform ad shifts reshape beauty market; cruelty-free demand grows
US inflation ~3.4% (2024) pushed consumers to value; e.l.f.’s sub-$15 positioning captured share while price elasticity and pack/tiering protect margins. Input cost swings (Brent ~$85/bbl; SCFI ~$1,300/container in 2024) and CPM +20% strained COGS and marketing; hedging, dual sourcing, MMM and creative ROI preserved profitability. Fed 5.25–5.50% (mid-2025) tightens demand; strong cash and low leverage sustain flexibility.
| Metric | Value |
|---|---|
| US inflation (2024) | 3.4% |
| e.l.f. FY2024 sales | $1.06B |
| Brent (2024 avg) | $85/bbl |
| SCFI (2024 avg) | $1,300/container |
| CPM change (2024) | +20% |
| Fed rate (mid-2025) | 5.25–5.50% |
Preview the Actual Deliverable
e.l.f. Cosmetics PESTLE Analysis
The e.l.f. Cosmetics PESTLE Analysis preview shown here is the exact document you’ll receive after purchase—fully formatted and ready to use. It provides a concise breakdown of political, economic, social, technological, legal, and environmental factors affecting e.l.f., with actionable insights for strategy and investment. No placeholders or surprises—this is the final file available for immediate download.

Your Shortcut to Market Insight Starts Here
Our PESTLE analysis reveals how political, economic and technological shifts are reshaping e.l.f. Cosmetics' growth trajectory. It highlights regulatory risks, consumer trends, supply-chain pressures and sustainability challenges. Purchase the full report to get actionable intelligence and a ready-to-use strategic toolkit.
Political factors
Trade policy shifts
Global tariffs, notably US Section 301 duties on China implemented 2018–19 that reached up to 25%, can raise landed costs for cosmetics inputs and finished goods and squeeze e.l.f.’s margins. e.l.f. must diversify sourcing, monitor U.S.–China and EU trade dynamics, and hedge supplier concentration to avoid margin shocks. Government incentives or relocation restrictions (tax credits, import rules) can materially shift manufacturing footprint economics. Active scenario planning preserves e.l.f.’s price leadership amid tariff volatility.
Animal welfare policies
Government backing for cruelty-free standards strengthens e.l.f.’s positioning as regulatory momentum grows: more than 40 countries now restrict cosmetic animal testing (EU ban effective 2013). Political support for bans raises rivals’ compliance costs and bolsters e.l.f.’s brand equity. Divergent national rules, notably China’s 2021 change removing mandatory testing for many imports, create market-by-market complexity. Active advocacy and compliance readiness speed market access.
Cosmetics oversight expansion
Political momentum—highlighted by the Modernization of Cosmetics Regulation Act (MoCRA) enacted December 2022—drives stricter oversight and increased regulator activity, raising documentation and testing expectations for ingredients and claims.
e.l.f., with robust quality systems and reported fiscal 2024 net sales of about $1.07 billion, gains competitive advantage by exceeding minimums and reducing compliance disruption.
Early, proactive engagement with regulators helps e.l.f. shape pragmatic standards and limit costly rework as enforcement and funding expand.
Retail market access
Political decisions on competition policy and large-retailer practices directly affect e.l.f. Cosmetics shelf access and terms; e.l.f. reported fiscal 2024 net revenue of $1.03 billion, intensifying dependence on retail placement. Localization rules and domestic-content preferences force assortment adjustments, while government trade missions and export programs (e.g., 2024 UK‑US trade initiatives) can open channels. Proactive policy tracking safeguards omnichannel distribution and margins.
Digital platform governance
Political scrutiny of social media and app data flows may change marketing reach and cost, notably across platforms with 2024 MAUs like Meta ~3.0 billion and TikTok ~1.1 billion; regulation-driven targeting limits can raise CPMs and reduce ROI.
- Risk: platform restrictions disrupt influencer activation; influencer market ~21B (2024)
- Action: hedge spend across channels and grow owned communities
- Trust: transparent data use lowers political and consumer backlash
Tariffs, compliance and platform ad shifts reshape beauty market; cruelty-free demand grows
Tariffs (US Section 301 up to 25%) and shifting trade policy raise landed costs and force sourcing diversification; MoCRA (Dec 2022) increases compliance burden. Cruelty-free momentum (40+ countries restrict testing) and China policy changes expand access for e.l.f., supporting fiscal 2024 net sales ~$1.07B. Platform data rules risk higher marketing CPMs (Meta MAU ~3.0B; TikTok ~1.1B).
| Metric | Value |
|---|---|
| FY2024 sales | $1.07B |
| Tariff impact | up to 25% |
| Countries banning animal testing | 40+ |
| Meta MAU | ~3.0B |
What is included in the product
Detailed Word Document
Explores how Political, Economic, Social, Technological, Environmental and Legal forces shape e.l.f. Cosmetics’ strategy and performance, with data-backed trends, regionally relevant risks/opportunities and forward-looking insights to support executive decision-making and investor communications.
Customizable Excel Spreadsheet
A clean, summarized PESTLE of e.l.f. Cosmetics for easy reference in meetings, highlighting external risks and opportunities across Political, Economic, Social, Technological, Legal and Environmental factors; editable notes let teams adapt insights to region or business line for faster strategic alignment.
Economic factors
Trade-down dynamics
With US inflation around 3.4% in 2024 squeezing real incomes, consumers traded down to value cosmetics; e.l.f.’s mass-market positioning and average price points below $15 captured share as shoppers sought quality at lower prices. Managing price elasticity is crucial to defend margins, while strategic pack-size and tiered price architecture can boost wallet retention and frequency.
Input cost volatility
Fluctuations in petrochemical feedstocks (Brent averaged about $85/bbl in 2024), botanical extracts and packaging resins directly pressure e.l.f.’s COGS and can swing margins by several percentage points. Global freight and energy swings — SCFI averaged roughly $1,300/container in 2024 — raise landed cost across channels. Hedging, dual sourcing and formulation agility help blunt shocks; realized savings can be reinvested into marketing and product innovation to protect growth.
FX and global sales mix
Currency moves materially affect e.l.f. Cosmetics' translated international revenue and import costs; e.l.f. reported roughly $820 million in net sales for fiscal 2024, meaning USD strength can meaningfully compress overseas margins. A stronger dollar in 2024 (U.S. Dollar Index rose about 4% year-over-year) lowered some input prices but reduced reported non‑U.S. sales. Diversified sourcing and manufacturing footprint provide natural hedges, and pricing governance (tight global MSRP control) limits FX-driven volatility in retail tags.
Ad spend efficiency
Ad spend efficiency: digital CPMs and CACs fluctuate with macro cycles and platform auctions—platform CPMs rose about 20% in 2024, pressuring beauty advertisers; e.l.f. leans on efficient social and influencer ROI to scale profitably while keeping marketing-to-sales disciplined after FY2024 net sales near $1.06B. MMM and incrementality testing are used to preserve ROI during cost spikes, and a strong creative engine mitigates bid inflation.
- CPM pressure ~+20% (2024)
- e.l.f. FY2024 net sales ~1.06B
- MMM/incrementality preserve efficiency
- Creative engine offsets bid inflation
Rate and credit conditions
Higher interest rates raise financing costs and dampen discretionary spend; the US federal funds rate stood at 5.25–5.50% in mid-2025, tightening consumer demand for beauty discretionary categories.
e.l.f.’s strong cash generation and low leverage enhance resilience versus peers, supporting operations through slower sales periods.
Vendor terms, faster inventory turns and flexible capex enable cost control and opportunistic growth in downturns.
- rate: Fed 5.25–5.50% (mid-2025)
- liquidity: strong cash generation
- ops: vendor terms + inventory turns critical
- strategy: flexible capex for opportunistic M&A/growth
Tariffs, compliance and platform ad shifts reshape beauty market; cruelty-free demand grows
US inflation ~3.4% (2024) pushed consumers to value; e.l.f.’s sub-$15 positioning captured share while price elasticity and pack/tiering protect margins. Input cost swings (Brent ~$85/bbl; SCFI ~$1,300/container in 2024) and CPM +20% strained COGS and marketing; hedging, dual sourcing, MMM and creative ROI preserved profitability. Fed 5.25–5.50% (mid-2025) tightens demand; strong cash and low leverage sustain flexibility.
| Metric | Value |
|---|---|
| US inflation (2024) | 3.4% |
| e.l.f. FY2024 sales | $1.06B |
| Brent (2024 avg) | $85/bbl |
| SCFI (2024 avg) | $1,300/container |
| CPM change (2024) | +20% |
| Fed rate (mid-2025) | 5.25–5.50% |
Preview the Actual Deliverable
e.l.f. Cosmetics PESTLE Analysis
The e.l.f. Cosmetics PESTLE Analysis preview shown here is the exact document you’ll receive after purchase—fully formatted and ready to use. It provides a concise breakdown of political, economic, social, technological, legal, and environmental factors affecting e.l.f., with actionable insights for strategy and investment. No placeholders or surprises—this is the final file available for immediate download.
Original: $10.00
-65%$10.00
$3.50Description
Your Shortcut to Market Insight Starts Here
Our PESTLE analysis reveals how political, economic and technological shifts are reshaping e.l.f. Cosmetics' growth trajectory. It highlights regulatory risks, consumer trends, supply-chain pressures and sustainability challenges. Purchase the full report to get actionable intelligence and a ready-to-use strategic toolkit.
Political factors
Trade policy shifts
Global tariffs, notably US Section 301 duties on China implemented 2018–19 that reached up to 25%, can raise landed costs for cosmetics inputs and finished goods and squeeze e.l.f.’s margins. e.l.f. must diversify sourcing, monitor U.S.–China and EU trade dynamics, and hedge supplier concentration to avoid margin shocks. Government incentives or relocation restrictions (tax credits, import rules) can materially shift manufacturing footprint economics. Active scenario planning preserves e.l.f.’s price leadership amid tariff volatility.
Animal welfare policies
Government backing for cruelty-free standards strengthens e.l.f.’s positioning as regulatory momentum grows: more than 40 countries now restrict cosmetic animal testing (EU ban effective 2013). Political support for bans raises rivals’ compliance costs and bolsters e.l.f.’s brand equity. Divergent national rules, notably China’s 2021 change removing mandatory testing for many imports, create market-by-market complexity. Active advocacy and compliance readiness speed market access.
Cosmetics oversight expansion
Political momentum—highlighted by the Modernization of Cosmetics Regulation Act (MoCRA) enacted December 2022—drives stricter oversight and increased regulator activity, raising documentation and testing expectations for ingredients and claims.
e.l.f., with robust quality systems and reported fiscal 2024 net sales of about $1.07 billion, gains competitive advantage by exceeding minimums and reducing compliance disruption.
Early, proactive engagement with regulators helps e.l.f. shape pragmatic standards and limit costly rework as enforcement and funding expand.
Retail market access
Political decisions on competition policy and large-retailer practices directly affect e.l.f. Cosmetics shelf access and terms; e.l.f. reported fiscal 2024 net revenue of $1.03 billion, intensifying dependence on retail placement. Localization rules and domestic-content preferences force assortment adjustments, while government trade missions and export programs (e.g., 2024 UK‑US trade initiatives) can open channels. Proactive policy tracking safeguards omnichannel distribution and margins.
Digital platform governance
Political scrutiny of social media and app data flows may change marketing reach and cost, notably across platforms with 2024 MAUs like Meta ~3.0 billion and TikTok ~1.1 billion; regulation-driven targeting limits can raise CPMs and reduce ROI.
- Risk: platform restrictions disrupt influencer activation; influencer market ~21B (2024)
- Action: hedge spend across channels and grow owned communities
- Trust: transparent data use lowers political and consumer backlash
Tariffs, compliance and platform ad shifts reshape beauty market; cruelty-free demand grows
Tariffs (US Section 301 up to 25%) and shifting trade policy raise landed costs and force sourcing diversification; MoCRA (Dec 2022) increases compliance burden. Cruelty-free momentum (40+ countries restrict testing) and China policy changes expand access for e.l.f., supporting fiscal 2024 net sales ~$1.07B. Platform data rules risk higher marketing CPMs (Meta MAU ~3.0B; TikTok ~1.1B).
| Metric | Value |
|---|---|
| FY2024 sales | $1.07B |
| Tariff impact | up to 25% |
| Countries banning animal testing | 40+ |
| Meta MAU | ~3.0B |
What is included in the product
Detailed Word Document
Explores how Political, Economic, Social, Technological, Environmental and Legal forces shape e.l.f. Cosmetics’ strategy and performance, with data-backed trends, regionally relevant risks/opportunities and forward-looking insights to support executive decision-making and investor communications.
Customizable Excel Spreadsheet
A clean, summarized PESTLE of e.l.f. Cosmetics for easy reference in meetings, highlighting external risks and opportunities across Political, Economic, Social, Technological, Legal and Environmental factors; editable notes let teams adapt insights to region or business line for faster strategic alignment.
Economic factors
Trade-down dynamics
With US inflation around 3.4% in 2024 squeezing real incomes, consumers traded down to value cosmetics; e.l.f.’s mass-market positioning and average price points below $15 captured share as shoppers sought quality at lower prices. Managing price elasticity is crucial to defend margins, while strategic pack-size and tiered price architecture can boost wallet retention and frequency.
Input cost volatility
Fluctuations in petrochemical feedstocks (Brent averaged about $85/bbl in 2024), botanical extracts and packaging resins directly pressure e.l.f.’s COGS and can swing margins by several percentage points. Global freight and energy swings — SCFI averaged roughly $1,300/container in 2024 — raise landed cost across channels. Hedging, dual sourcing and formulation agility help blunt shocks; realized savings can be reinvested into marketing and product innovation to protect growth.
FX and global sales mix
Currency moves materially affect e.l.f. Cosmetics' translated international revenue and import costs; e.l.f. reported roughly $820 million in net sales for fiscal 2024, meaning USD strength can meaningfully compress overseas margins. A stronger dollar in 2024 (U.S. Dollar Index rose about 4% year-over-year) lowered some input prices but reduced reported non‑U.S. sales. Diversified sourcing and manufacturing footprint provide natural hedges, and pricing governance (tight global MSRP control) limits FX-driven volatility in retail tags.
Ad spend efficiency
Ad spend efficiency: digital CPMs and CACs fluctuate with macro cycles and platform auctions—platform CPMs rose about 20% in 2024, pressuring beauty advertisers; e.l.f. leans on efficient social and influencer ROI to scale profitably while keeping marketing-to-sales disciplined after FY2024 net sales near $1.06B. MMM and incrementality testing are used to preserve ROI during cost spikes, and a strong creative engine mitigates bid inflation.
- CPM pressure ~+20% (2024)
- e.l.f. FY2024 net sales ~1.06B
- MMM/incrementality preserve efficiency
- Creative engine offsets bid inflation
Rate and credit conditions
Higher interest rates raise financing costs and dampen discretionary spend; the US federal funds rate stood at 5.25–5.50% in mid-2025, tightening consumer demand for beauty discretionary categories.
e.l.f.’s strong cash generation and low leverage enhance resilience versus peers, supporting operations through slower sales periods.
Vendor terms, faster inventory turns and flexible capex enable cost control and opportunistic growth in downturns.
- rate: Fed 5.25–5.50% (mid-2025)
- liquidity: strong cash generation
- ops: vendor terms + inventory turns critical
- strategy: flexible capex for opportunistic M&A/growth
Tariffs, compliance and platform ad shifts reshape beauty market; cruelty-free demand grows
US inflation ~3.4% (2024) pushed consumers to value; e.l.f.’s sub-$15 positioning captured share while price elasticity and pack/tiering protect margins. Input cost swings (Brent ~$85/bbl; SCFI ~$1,300/container in 2024) and CPM +20% strained COGS and marketing; hedging, dual sourcing, MMM and creative ROI preserved profitability. Fed 5.25–5.50% (mid-2025) tightens demand; strong cash and low leverage sustain flexibility.
| Metric | Value |
|---|---|
| US inflation (2024) | 3.4% |
| e.l.f. FY2024 sales | $1.06B |
| Brent (2024 avg) | $85/bbl |
| SCFI (2024 avg) | $1,300/container |
| CPM change (2024) | +20% |
| Fed rate (mid-2025) | 5.25–5.50% |
Preview the Actual Deliverable
e.l.f. Cosmetics PESTLE Analysis
The e.l.f. Cosmetics PESTLE Analysis preview shown here is the exact document you’ll receive after purchase—fully formatted and ready to use. It provides a concise breakdown of political, economic, social, technological, legal, and environmental factors affecting e.l.f., with actionable insights for strategy and investment. No placeholders or surprises—this is the final file available for immediate download.











