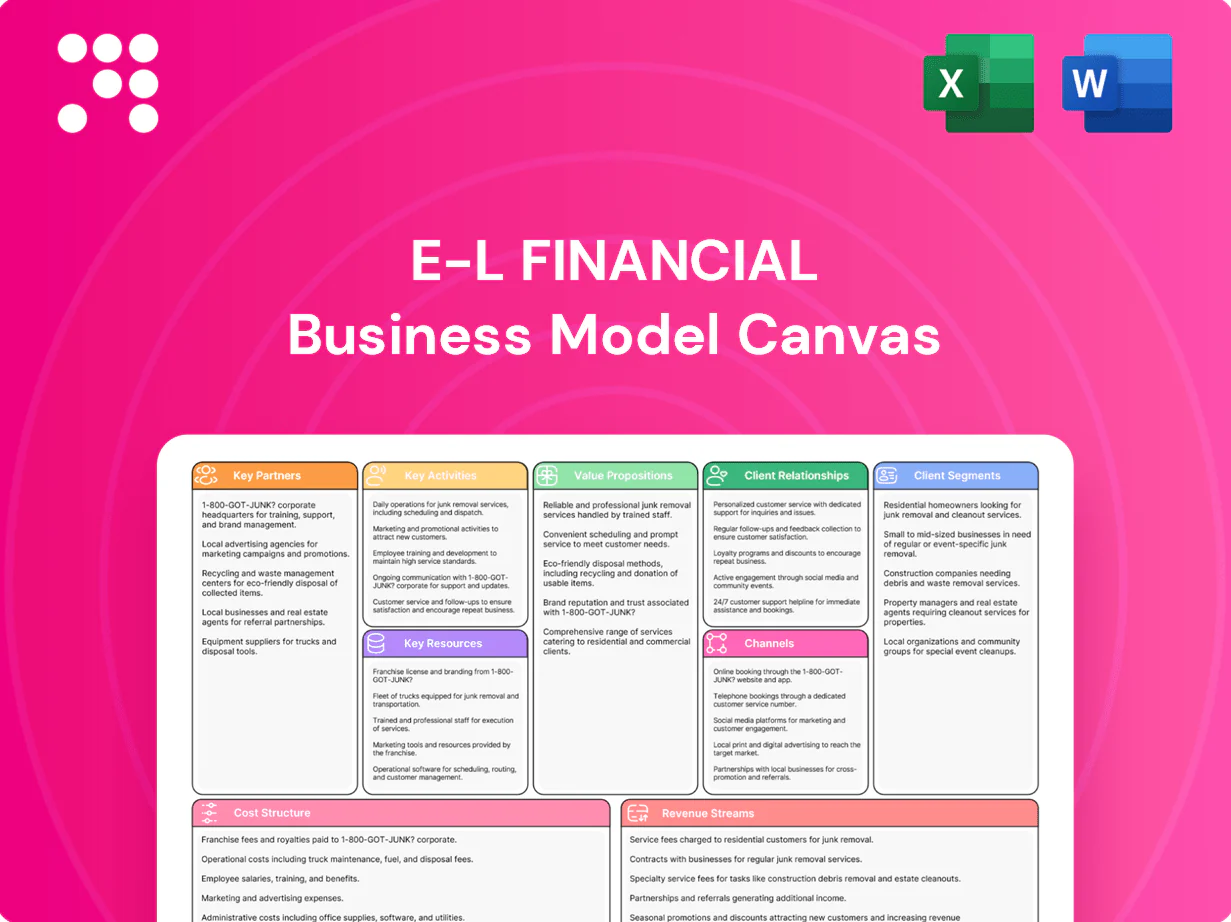
E-L Financial Business Model Canvas

Unlock the Business Model Canvas for Financial Firms — Download Editable Canvas
Unlock the full strategic blueprint behind E-L Financial with our Business Model Canvas. This in-depth, editable document maps value propositions, revenue streams, key partners and cost structure to reveal how the firm wins and scales. Ideal for investors, consultants and founders—download the Word/Excel canvas to benchmark, plan, and act.
Partnerships

Reinsurers
E-L Financial, through The Empire Life Insurance Company, partners with top-tier reinsurers to optimize risk transfer and capital efficiency. These reinsurance arrangements stabilize earnings during adverse claims events and help smooth underwriting volatility to support competitive pricing. Joint development of underwriting guidelines with reinsurers strengthens product sustainability and capital management.
Independent Advisors & Brokers
E-L Financial relies on a broad network of independent advisors and brokers for distribution and customer acquisition, with independent channels accounting for roughly 60% of its retail product placements in 2024. These partners deliver tailored advice that boosts conversion and retention, supported by training, digital tools and aligned compensation. Continuous feedback loops from advisors inform product design and pricing, tightening market fit and improving margins.

Banks & Workplace Benefits Consultants
Banks and workplace benefits consultants extend E-L Financial reach into retail and group markets; bancassurance now accounts for about 30% of global life distribution in 2024, unlocking cross-sell across life, health and wealth. Shared data and joint campaigns raise penetration and customer lifetime value. Co-branded offerings accelerate trust and speed to market.

Asset Managers & Co-investors
Specialist asset managers and co-investors underpin E-L Financial’s public and private strategies, supplying sector expertise and proprietary deal flow to drive long-term capital appreciation.
Mandates diversify style and asset-class exposure across equities, fixed income, real estate, private equity and alternatives, supporting portfolio resilience.
Robust governance frameworks — formal mandates, quarterly reporting and independent oversight — ensure alignment, fee discipline and risk controls.
Technology, Data & RegTech Vendors
Core admin, analytics and cybersecurity partners enable scalable operations and compliance; cyber breaches cost an average $4.45M in 2024 (IBM), so robust partners cut financial and operational risk. Digital tools speed underwriting and claims automation while improving NPS and retention; InsurTech and RegTech adoption rose in 2024, with the RegTech market at $12.6B. APIs integrate advisor platforms and portfolio systems, lowering manual reconciliation and error rates.
- Scalability: admin & analytics partners
- Security: cyber partners (avg breach cost $4.45M, 2024)
- Efficiency: underwriting & claims automation
- Integration: APIs for advisors & portfolios
- Compliance: RegTech reduces reporting friction (RegTech market $12.6B, 2024)
Partnerships drive 60% retail distribution, capital efficiency and stronger cyber defense
E-L Financial leverages reinsurers, brokers (60% retail placements in 2024), bancassurance (aligning with ~30% global life distribution 2024), specialist asset managers and RegTech/InsurTech partners to optimize capital, distribution, asset returns and compliance. Partnerships reduce underwriting volatility, accelerate digital distribution and protect against cyber losses (~$4.45M breach cost, 2024).
| Partner | Role | 2024 Metric |
|---|---|---|
| Reinsurers | Risk transfer | Capital efficiency |
| Advisors/Brokers | Distribution | 60% retail placements |
| Bancassurance | Channel | 30% global life dist. |
| Cyber/RegTech | Security/Compliance | $4.45M breach cost; $12.6B RegTech |
What is included in the product
 Detailed Word Document
A concise, pre-written Business Model Canvas for E-L Financial that maps all nine BMC blocks to the company’s strategy, operations and value propositions. It includes competitive analysis, SWOT linkage and polished narrative ideal for investors, bankers and internal decision-making.

 Customizable Excel Spreadsheet
Condenses E-L Financial’s strategy into a digestible one-page canvas, saving hours of formatting and structuring your own model. Shareable and editable for fast team collaboration, it’s perfect for quick reviews, boardrooms, or comparing multiple companies side-by-side.
Activities

Underwriting & Product Pricing
Empire Life assesses risk and prices life, health, and annuity products using actuarial pricing frameworks and experience studies to update mortality, morbidity, and lapse assumptions. Continuous refinement relies on predictive models, scenario testing, and regular portfolio reviews to align reserves and pricing with observed claims. Competitive pricing seeks a balance between market growth and profitability while governance and compliance frameworks ensure fairness and regulatory adherence.
Investment Management & Asset Allocation
E-L Financial allocates capital across public and private assets, tapping a private capital market that exceeded $12 trillion in 2024 per Preqin. Asset-liability matching underpins insurance portfolios, with insurers typically holding roughly 60% of invested assets in fixed income to match liabilities (Swiss Re/industry data). Diversification across sectors and geographies supports stable returns and solvency, while active risk management targets superior long-term performance through dynamic rebalancing and hedging.

Distribution Management
Recruiting, training and supporting advisors increases sales effectiveness; firms with structured onboarding report up to 25% higher advisor productivity in 2024. Incentive plans tied to persistency lift retention 15–20% and improve customer outcomes. Digital quoting/onboarding cuts turnaround by ~40%. Channel analytics boost territory ROI and lift campaign efficiency by ~18%.

Risk & Capital Management
Enterprise risk frameworks continuously monitor market, credit, insurance and operational risks; 2024 benchmarks show large banks with CET1 around 13% and many European insurers holding Solvency II ratios above 150%. Reinsurance programs and hedging tools are used to manage tail events and reduce capital volatility. Capital planning targets robust solvency buffers while scenario testing and stress exercises in 2024 inform strategic capital allocation.
- Risk types: market, credit, insurance, operational
- Capital targets: CET1 ~13% (banks), Solvency II >150% (insurers)
- Tools: reinsurance, hedging, scenario testing
Claims, Service & Compliance Operations
Efficient claims handling drives trust and loyalty, with 2024 industry benchmarks showing digital claims automation can cut average claim processing time and reduce cost-to-serve by roughly 25–35%, boosting retention and NPS around 8–12 points. Multi-channel service (web, mobile, contact center) reduces friction across the customer lifecycle and raises first-contact resolution. Robust compliance frameworks ensure adherence to insurance and securities rules, avoiding fines and protecting capital; continuous improvement programs further lower unit costs.
- claims-efficiency: 25–35% cost-to-serve reduction (2024)
- omnichannel-service: +8–12 NPS / higher retention (2024)
- compliance: reduced regulatory fines, preserved solvency ratios
- continuous-improvement: lowers unit costs, raises throughput
Actuarial pricing, ALM & automation boost solvency; favor fixed income (~60%) and $12T+
Actuarial pricing, predictive models and portfolio reviews align reserves and pricing with observed claims. Capital allocation and ALM prioritize fixed income (~60% of assets) and private markets ($12T+ private capital, 2024) for returns and solvency. Advisor enablement, digital onboarding and claims automation raise productivity and cut costs while enterprise risk, reinsurance and stress-testing protect capital.
| Metric | 2024 |
|---|---|
| Private capital | $12T+ |
| Fixed income share | ~60% |
| Advisor productivity lift | +25% |
| Digital onboarding speed | -40% |
| Claims cost reduction | 25–35% |
| Solvency/CET1 benchmarks | Solvency II >150% / CET1 ~13% |
Full Version Awaits
Business Model Canvas
The E-L Financial Business Model Canvas you’re previewing is the actual deliverable, not a mockup. When you purchase, you’ll receive this same document — complete and formatted — ready to download in Word and Excel. No surprises: what you see is what you’ll get, editable and presentation-ready.

Unlock the Business Model Canvas for Financial Firms — Download Editable Canvas
Unlock the full strategic blueprint behind E-L Financial with our Business Model Canvas. This in-depth, editable document maps value propositions, revenue streams, key partners and cost structure to reveal how the firm wins and scales. Ideal for investors, consultants and founders—download the Word/Excel canvas to benchmark, plan, and act.
Partnerships
Reinsurers
E-L Financial, through The Empire Life Insurance Company, partners with top-tier reinsurers to optimize risk transfer and capital efficiency. These reinsurance arrangements stabilize earnings during adverse claims events and help smooth underwriting volatility to support competitive pricing. Joint development of underwriting guidelines with reinsurers strengthens product sustainability and capital management.
Independent Advisors & Brokers
E-L Financial relies on a broad network of independent advisors and brokers for distribution and customer acquisition, with independent channels accounting for roughly 60% of its retail product placements in 2024. These partners deliver tailored advice that boosts conversion and retention, supported by training, digital tools and aligned compensation. Continuous feedback loops from advisors inform product design and pricing, tightening market fit and improving margins.
Banks & Workplace Benefits Consultants
Banks and workplace benefits consultants extend E-L Financial reach into retail and group markets; bancassurance now accounts for about 30% of global life distribution in 2024, unlocking cross-sell across life, health and wealth. Shared data and joint campaigns raise penetration and customer lifetime value. Co-branded offerings accelerate trust and speed to market.
Asset Managers & Co-investors
Specialist asset managers and co-investors underpin E-L Financial’s public and private strategies, supplying sector expertise and proprietary deal flow to drive long-term capital appreciation.
Mandates diversify style and asset-class exposure across equities, fixed income, real estate, private equity and alternatives, supporting portfolio resilience.
Robust governance frameworks — formal mandates, quarterly reporting and independent oversight — ensure alignment, fee discipline and risk controls.
Technology, Data & RegTech Vendors
Core admin, analytics and cybersecurity partners enable scalable operations and compliance; cyber breaches cost an average $4.45M in 2024 (IBM), so robust partners cut financial and operational risk. Digital tools speed underwriting and claims automation while improving NPS and retention; InsurTech and RegTech adoption rose in 2024, with the RegTech market at $12.6B. APIs integrate advisor platforms and portfolio systems, lowering manual reconciliation and error rates.
- Scalability: admin & analytics partners
- Security: cyber partners (avg breach cost $4.45M, 2024)
- Efficiency: underwriting & claims automation
- Integration: APIs for advisors & portfolios
- Compliance: RegTech reduces reporting friction (RegTech market $12.6B, 2024)
Partnerships drive 60% retail distribution, capital efficiency and stronger cyber defense
E-L Financial leverages reinsurers, brokers (60% retail placements in 2024), bancassurance (aligning with ~30% global life distribution 2024), specialist asset managers and RegTech/InsurTech partners to optimize capital, distribution, asset returns and compliance. Partnerships reduce underwriting volatility, accelerate digital distribution and protect against cyber losses (~$4.45M breach cost, 2024).
| Partner | Role | 2024 Metric |
|---|---|---|
| Reinsurers | Risk transfer | Capital efficiency |
| Advisors/Brokers | Distribution | 60% retail placements |
| Bancassurance | Channel | 30% global life dist. |
| Cyber/RegTech | Security/Compliance | $4.45M breach cost; $12.6B RegTech |
What is included in the product
Detailed Word Document
A concise, pre-written Business Model Canvas for E-L Financial that maps all nine BMC blocks to the company’s strategy, operations and value propositions. It includes competitive analysis, SWOT linkage and polished narrative ideal for investors, bankers and internal decision-making.
Customizable Excel Spreadsheet
Condenses E-L Financial’s strategy into a digestible one-page canvas, saving hours of formatting and structuring your own model. Shareable and editable for fast team collaboration, it’s perfect for quick reviews, boardrooms, or comparing multiple companies side-by-side.
Activities
Underwriting & Product Pricing
Empire Life assesses risk and prices life, health, and annuity products using actuarial pricing frameworks and experience studies to update mortality, morbidity, and lapse assumptions. Continuous refinement relies on predictive models, scenario testing, and regular portfolio reviews to align reserves and pricing with observed claims. Competitive pricing seeks a balance between market growth and profitability while governance and compliance frameworks ensure fairness and regulatory adherence.
Investment Management & Asset Allocation
E-L Financial allocates capital across public and private assets, tapping a private capital market that exceeded $12 trillion in 2024 per Preqin. Asset-liability matching underpins insurance portfolios, with insurers typically holding roughly 60% of invested assets in fixed income to match liabilities (Swiss Re/industry data). Diversification across sectors and geographies supports stable returns and solvency, while active risk management targets superior long-term performance through dynamic rebalancing and hedging.
Distribution Management
Recruiting, training and supporting advisors increases sales effectiveness; firms with structured onboarding report up to 25% higher advisor productivity in 2024. Incentive plans tied to persistency lift retention 15–20% and improve customer outcomes. Digital quoting/onboarding cuts turnaround by ~40%. Channel analytics boost territory ROI and lift campaign efficiency by ~18%.
Risk & Capital Management
Enterprise risk frameworks continuously monitor market, credit, insurance and operational risks; 2024 benchmarks show large banks with CET1 around 13% and many European insurers holding Solvency II ratios above 150%. Reinsurance programs and hedging tools are used to manage tail events and reduce capital volatility. Capital planning targets robust solvency buffers while scenario testing and stress exercises in 2024 inform strategic capital allocation.
- Risk types: market, credit, insurance, operational
- Capital targets: CET1 ~13% (banks), Solvency II >150% (insurers)
- Tools: reinsurance, hedging, scenario testing
Claims, Service & Compliance Operations
Efficient claims handling drives trust and loyalty, with 2024 industry benchmarks showing digital claims automation can cut average claim processing time and reduce cost-to-serve by roughly 25–35%, boosting retention and NPS around 8–12 points. Multi-channel service (web, mobile, contact center) reduces friction across the customer lifecycle and raises first-contact resolution. Robust compliance frameworks ensure adherence to insurance and securities rules, avoiding fines and protecting capital; continuous improvement programs further lower unit costs.
- claims-efficiency: 25–35% cost-to-serve reduction (2024)
- omnichannel-service: +8–12 NPS / higher retention (2024)
- compliance: reduced regulatory fines, preserved solvency ratios
- continuous-improvement: lowers unit costs, raises throughput
Actuarial pricing, ALM & automation boost solvency; favor fixed income (~60%) and $12T+
Actuarial pricing, predictive models and portfolio reviews align reserves and pricing with observed claims. Capital allocation and ALM prioritize fixed income (~60% of assets) and private markets ($12T+ private capital, 2024) for returns and solvency. Advisor enablement, digital onboarding and claims automation raise productivity and cut costs while enterprise risk, reinsurance and stress-testing protect capital.
| Metric | 2024 |
|---|---|
| Private capital | $12T+ |
| Fixed income share | ~60% |
| Advisor productivity lift | +25% |
| Digital onboarding speed | -40% |
| Claims cost reduction | 25–35% |
| Solvency/CET1 benchmarks | Solvency II >150% / CET1 ~13% |
Full Version Awaits
Business Model Canvas
The E-L Financial Business Model Canvas you’re previewing is the actual deliverable, not a mockup. When you purchase, you’ll receive this same document — complete and formatted — ready to download in Word and Excel. No surprises: what you see is what you’ll get, editable and presentation-ready.
Original: $10.00
-65%$10.00
$3.50Description
Unlock the Business Model Canvas for Financial Firms — Download Editable Canvas
Unlock the full strategic blueprint behind E-L Financial with our Business Model Canvas. This in-depth, editable document maps value propositions, revenue streams, key partners and cost structure to reveal how the firm wins and scales. Ideal for investors, consultants and founders—download the Word/Excel canvas to benchmark, plan, and act.
Partnerships
Reinsurers
E-L Financial, through The Empire Life Insurance Company, partners with top-tier reinsurers to optimize risk transfer and capital efficiency. These reinsurance arrangements stabilize earnings during adverse claims events and help smooth underwriting volatility to support competitive pricing. Joint development of underwriting guidelines with reinsurers strengthens product sustainability and capital management.
Independent Advisors & Brokers
E-L Financial relies on a broad network of independent advisors and brokers for distribution and customer acquisition, with independent channels accounting for roughly 60% of its retail product placements in 2024. These partners deliver tailored advice that boosts conversion and retention, supported by training, digital tools and aligned compensation. Continuous feedback loops from advisors inform product design and pricing, tightening market fit and improving margins.
Banks & Workplace Benefits Consultants
Banks and workplace benefits consultants extend E-L Financial reach into retail and group markets; bancassurance now accounts for about 30% of global life distribution in 2024, unlocking cross-sell across life, health and wealth. Shared data and joint campaigns raise penetration and customer lifetime value. Co-branded offerings accelerate trust and speed to market.
Asset Managers & Co-investors
Specialist asset managers and co-investors underpin E-L Financial’s public and private strategies, supplying sector expertise and proprietary deal flow to drive long-term capital appreciation.
Mandates diversify style and asset-class exposure across equities, fixed income, real estate, private equity and alternatives, supporting portfolio resilience.
Robust governance frameworks — formal mandates, quarterly reporting and independent oversight — ensure alignment, fee discipline and risk controls.
Technology, Data & RegTech Vendors
Core admin, analytics and cybersecurity partners enable scalable operations and compliance; cyber breaches cost an average $4.45M in 2024 (IBM), so robust partners cut financial and operational risk. Digital tools speed underwriting and claims automation while improving NPS and retention; InsurTech and RegTech adoption rose in 2024, with the RegTech market at $12.6B. APIs integrate advisor platforms and portfolio systems, lowering manual reconciliation and error rates.
- Scalability: admin & analytics partners
- Security: cyber partners (avg breach cost $4.45M, 2024)
- Efficiency: underwriting & claims automation
- Integration: APIs for advisors & portfolios
- Compliance: RegTech reduces reporting friction (RegTech market $12.6B, 2024)
Partnerships drive 60% retail distribution, capital efficiency and stronger cyber defense
E-L Financial leverages reinsurers, brokers (60% retail placements in 2024), bancassurance (aligning with ~30% global life distribution 2024), specialist asset managers and RegTech/InsurTech partners to optimize capital, distribution, asset returns and compliance. Partnerships reduce underwriting volatility, accelerate digital distribution and protect against cyber losses (~$4.45M breach cost, 2024).
| Partner | Role | 2024 Metric |
|---|---|---|
| Reinsurers | Risk transfer | Capital efficiency |
| Advisors/Brokers | Distribution | 60% retail placements |
| Bancassurance | Channel | 30% global life dist. |
| Cyber/RegTech | Security/Compliance | $4.45M breach cost; $12.6B RegTech |
What is included in the product
Detailed Word Document
A concise, pre-written Business Model Canvas for E-L Financial that maps all nine BMC blocks to the company’s strategy, operations and value propositions. It includes competitive analysis, SWOT linkage and polished narrative ideal for investors, bankers and internal decision-making.
Customizable Excel Spreadsheet
Condenses E-L Financial’s strategy into a digestible one-page canvas, saving hours of formatting and structuring your own model. Shareable and editable for fast team collaboration, it’s perfect for quick reviews, boardrooms, or comparing multiple companies side-by-side.
Activities
Underwriting & Product Pricing
Empire Life assesses risk and prices life, health, and annuity products using actuarial pricing frameworks and experience studies to update mortality, morbidity, and lapse assumptions. Continuous refinement relies on predictive models, scenario testing, and regular portfolio reviews to align reserves and pricing with observed claims. Competitive pricing seeks a balance between market growth and profitability while governance and compliance frameworks ensure fairness and regulatory adherence.
Investment Management & Asset Allocation
E-L Financial allocates capital across public and private assets, tapping a private capital market that exceeded $12 trillion in 2024 per Preqin. Asset-liability matching underpins insurance portfolios, with insurers typically holding roughly 60% of invested assets in fixed income to match liabilities (Swiss Re/industry data). Diversification across sectors and geographies supports stable returns and solvency, while active risk management targets superior long-term performance through dynamic rebalancing and hedging.
Distribution Management
Recruiting, training and supporting advisors increases sales effectiveness; firms with structured onboarding report up to 25% higher advisor productivity in 2024. Incentive plans tied to persistency lift retention 15–20% and improve customer outcomes. Digital quoting/onboarding cuts turnaround by ~40%. Channel analytics boost territory ROI and lift campaign efficiency by ~18%.
Risk & Capital Management
Enterprise risk frameworks continuously monitor market, credit, insurance and operational risks; 2024 benchmarks show large banks with CET1 around 13% and many European insurers holding Solvency II ratios above 150%. Reinsurance programs and hedging tools are used to manage tail events and reduce capital volatility. Capital planning targets robust solvency buffers while scenario testing and stress exercises in 2024 inform strategic capital allocation.
- Risk types: market, credit, insurance, operational
- Capital targets: CET1 ~13% (banks), Solvency II >150% (insurers)
- Tools: reinsurance, hedging, scenario testing
Claims, Service & Compliance Operations
Efficient claims handling drives trust and loyalty, with 2024 industry benchmarks showing digital claims automation can cut average claim processing time and reduce cost-to-serve by roughly 25–35%, boosting retention and NPS around 8–12 points. Multi-channel service (web, mobile, contact center) reduces friction across the customer lifecycle and raises first-contact resolution. Robust compliance frameworks ensure adherence to insurance and securities rules, avoiding fines and protecting capital; continuous improvement programs further lower unit costs.
- claims-efficiency: 25–35% cost-to-serve reduction (2024)
- omnichannel-service: +8–12 NPS / higher retention (2024)
- compliance: reduced regulatory fines, preserved solvency ratios
- continuous-improvement: lowers unit costs, raises throughput
Actuarial pricing, ALM & automation boost solvency; favor fixed income (~60%) and $12T+
Actuarial pricing, predictive models and portfolio reviews align reserves and pricing with observed claims. Capital allocation and ALM prioritize fixed income (~60% of assets) and private markets ($12T+ private capital, 2024) for returns and solvency. Advisor enablement, digital onboarding and claims automation raise productivity and cut costs while enterprise risk, reinsurance and stress-testing protect capital.
| Metric | 2024 |
|---|---|
| Private capital | $12T+ |
| Fixed income share | ~60% |
| Advisor productivity lift | +25% |
| Digital onboarding speed | -40% |
| Claims cost reduction | 25–35% |
| Solvency/CET1 benchmarks | Solvency II >150% / CET1 ~13% |
Full Version Awaits
Business Model Canvas
The E-L Financial Business Model Canvas you’re previewing is the actual deliverable, not a mockup. When you purchase, you’ll receive this same document — complete and formatted — ready to download in Word and Excel. No surprises: what you see is what you’ll get, editable and presentation-ready.











