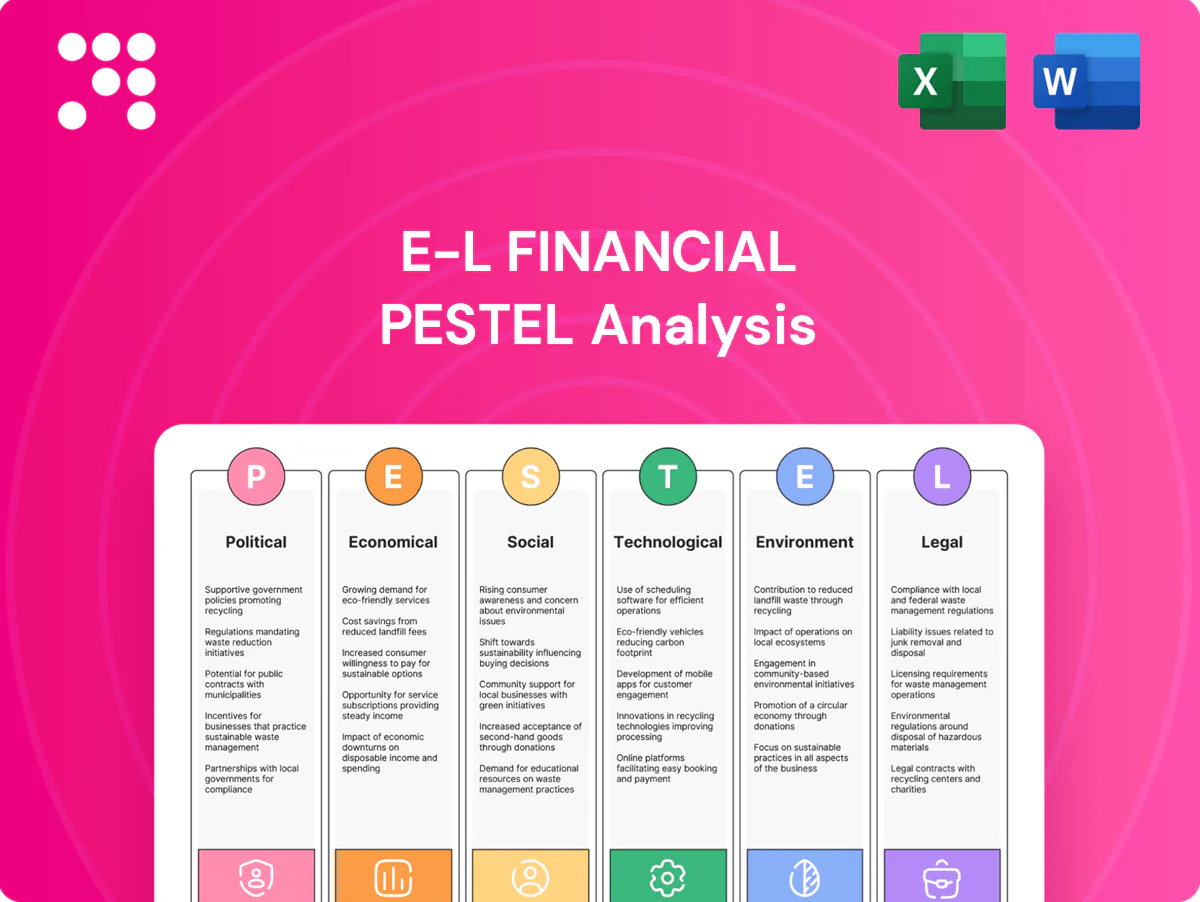
E-L Financial PESTLE Analysis

Your Shortcut to Market Insight Starts Here
Unlock strategic clarity with our PESTLE analysis of E-L Financial — concise, research-driven insights into political, economic, social, technological, legal and environmental forces shaping its future. Ideal for investors and strategists; purchase the full report for actionable, board-ready intelligence.
Political factors

Regulatory stability
Canada’s financial sector has relatively stable policy regimes, enabling long-term insurance and investment strategies; OSFI’s Minimum Capital Test supervisory target of 150% provides predictable solvency guidance. This predictability helps E-L Financial plan capital and product roadmaps. Political shifts can recalibrate prudential rules and consumer protection priorities. Monitoring federal and provincial agendas remains critical.
OSFI and prudential policy
OSFI’s guidance, anchored by the LICAT minimum supervisory target of 100%, now drives capital factors, stress-testing design and insurer risk governance. Changes to factors or scenario severity materially affect dividend capacity and product pricing by altering available capital and risk margins. Post-market shocks OSFI has emphasized macroprudential buffers above the 100% floor, so E-L must align governance across its insurance and holding-company levels to ensure consistent capital and risk controls.

Federal–provincial dynamics
Federal–provincial dynamics matter because Canada has 10 provinces and 3 territories, each with distinct insurance distribution rules and health benefit frameworks, forcing firms to manage multiple provincial regulators and fee schedules; these variations raise coordination costs, slow speed-to-market and complicate advisor licensing and oversight, so provincial harmonization or divergence directly alters operating efficiency.

Tax policy direction
Corporate, investment and insurance tax rules—US federal corporate tax 21% and the OECD 15% global minimum adopted by 140+ jurisdictions—directly alter earnings quality and portfolio strategy; changes to dividend taxation (top US federal rates 0/15/20% plus 3.8% NIIT) or capital gains inclusion (Canada 50%) shift asset allocation and interest deductibility limits affect leverage economics.
- Corporate tax: US 21%, global minimum 15%
- Capital gains/dividends: US top 20%+3.8% NIIT; Canada inclusion 50%
- Registered-plan incentives drive demand for tax-deferred products
- Cross-border: treaty rates/withholding often 0–15%
Trade and geopolitical risk
Global tensions materially influence public and private portfolio valuations and liquidity, with geopolitical risk spikes since 2022 pushing equity and credit volatility higher and contributing to supply-chain disruptions that cut global merchandise trade volumes by about 1% in 2023 (WTO) and kept inflation/energy price shocks elevated into 2024–25.
Sanctions and supply-chain shifts have rippled into sectors held by E-L’s investment arm, notably energy, semiconductors and logistics, forcing repricing of political risk premia that widened credit spreads and equity volatility during 2023–24; diversification and dynamic hedging policies must reflect evolving geopolitics to protect NAV and liquidity.
- Geopolitical volatility: elevated since 2022
- Trade impact: global merchandise trade ≈ -1% in 2023 (WTO)
- Sector exposure: energy, semiconductors, logistics most affected
- Risk response: diversify, increase hedges, monitor credit spread repricing
MCT ~150%, OECD 15%, US 21%
Stable Canadian prudential targets (OSFI MCT ~150%, LICAT supervisory 100%) and multi-jurisdictional provincial rules (10 provinces, 3 territories) shape capital, distribution and go‑to‑market speed. OECD 15% global minimum (adopted by 140+ jurisdictions) and US 21% federal rate affect tax-driven product demand and asset allocation. Geopolitical shocks since 2022 raised volatility and widened spreads, cutting global trade ~1% in 2023.
| Metric | Value |
|---|---|
| OSFI targets | MCT ~150%; LICAT 100% |
| Jurisdictions | 10 provinces, 3 territories |
| Global min tax | OECD 15% (140+) |
| US corp tax | 21% |
What is included in the product
 Detailed Word Document
Explores how macro-environmental factors uniquely affect E-L Financial across Political, Economic, Social, Technological, Environmental, and Legal dimensions, with data-backed trends and region-specific regulatory context; designed to help executives, investors, and strategists identify risks, opportunities, and scenario-driven strategic responses.

 Customizable Excel Spreadsheet
Compact, visually segmented E‑L Financial PESTLE summary that can be dropped into presentations, annotated for local context or business lines, and easily shared across teams to streamline external risk discussions and align strategic planning.
Economic factors

Interest rate cycles
Interest rate cycles—with the fed funds around 5.25% and the US 10-year near 4.1% mid-2025—directly drive investment income, actuarial liabilities and product competitiveness. Higher yields boost spread earnings yet depress fixed-income marks, squeezing capital ratios. Rapid cuts or curve inversions complicate asset–liability management, so dynamic duration positioning and hedging are essential.
Inflation persistence
Inflation persistence—US CPI near 3% in 2024 while Fed funds held around 5.25%—drives higher healthcare and claims costs, pushing group benefits expense above headline inflation since medical inflation typically outpaces CPI. Elevated inflation compresses equity multiples, forcing pricing and expense discipline to offset margin erosion. Allocations to real-return and inflation-linked assets (TIPS, IL bonds) stabilize underwriting and reserve outcomes.

Market volatility
Equity and credit swings (S&P 500 fell ~19.4% in 2022 then rose ~26.9% in 2023) drive AUM-fee volatility and surplus swings for E-L Financial. Private asset valuations lag cash markets, with industry dry powder around $2.5 trillion, creating timing risk on NAVs and capital calls. Active rebalancing, maintained liquidity buffers and routine scenario testing improve resilience. Under market stress policyholder behavior—surrenders and lapses—tends to rise, pressuring liquidity.

Employment and income trends
Housing and household leverage
- Leverage pressure: higher lapse risk
- Mortgage resets: cashflow squeeze
- Protection gap widens; term life demand rises
- Retention tools: targeted underwriting, affordability options
MCT ~150%, OECD 15%, US 21%
Fed funds ~5.25% and US 10-year ~4.1% mid-2025 drive investment income, duration risk and capital pressure, requiring dynamic hedging.
Inflation ~3% (2024) and medical inflation above CPI raise claims and compress margins; TIPS/IL allocations mitigate reserve risk.
Equity/corporate swings (S&P -19.4% 2022, +26.9% 2023) and $2.5T private dry powder create NAV and liquidity timing risks.
US unemployment ~3.9% and household debt $17.8T (2024) raise lapse risk as 30y mortgage ~7% squeezes cashflow.
| Metric | Value |
|---|---|
| Fed funds | ~5.25% |
| US 10Y | ~4.1% |
| CPI (2024) | ~3% |
| Unemployment (2024) | ~3.9% |
| Household debt (2024) | $17.8T |
| 30y mortgage | ~7% |
| S&P 2022/23 | -19.4% / +26.9% |
| Private dry powder | $2.5T |
Same Document Delivered
E-L Financial PESTLE Analysis
The E-L Financial PESTLE Analysis preview shown here is the exact document you’ll receive after purchase—fully formatted and ready to use. It covers political, economic, social, technological, legal and environmental factors specific to E-L Financial. No placeholders or teasers; this is the final file. You’ll be able to download it immediately after checkout.

Your Shortcut to Market Insight Starts Here
Unlock strategic clarity with our PESTLE analysis of E-L Financial — concise, research-driven insights into political, economic, social, technological, legal and environmental forces shaping its future. Ideal for investors and strategists; purchase the full report for actionable, board-ready intelligence.
Political factors
Regulatory stability
Canada’s financial sector has relatively stable policy regimes, enabling long-term insurance and investment strategies; OSFI’s Minimum Capital Test supervisory target of 150% provides predictable solvency guidance. This predictability helps E-L Financial plan capital and product roadmaps. Political shifts can recalibrate prudential rules and consumer protection priorities. Monitoring federal and provincial agendas remains critical.
OSFI and prudential policy
OSFI’s guidance, anchored by the LICAT minimum supervisory target of 100%, now drives capital factors, stress-testing design and insurer risk governance. Changes to factors or scenario severity materially affect dividend capacity and product pricing by altering available capital and risk margins. Post-market shocks OSFI has emphasized macroprudential buffers above the 100% floor, so E-L must align governance across its insurance and holding-company levels to ensure consistent capital and risk controls.
Federal–provincial dynamics
Federal–provincial dynamics matter because Canada has 10 provinces and 3 territories, each with distinct insurance distribution rules and health benefit frameworks, forcing firms to manage multiple provincial regulators and fee schedules; these variations raise coordination costs, slow speed-to-market and complicate advisor licensing and oversight, so provincial harmonization or divergence directly alters operating efficiency.
Tax policy direction
Corporate, investment and insurance tax rules—US federal corporate tax 21% and the OECD 15% global minimum adopted by 140+ jurisdictions—directly alter earnings quality and portfolio strategy; changes to dividend taxation (top US federal rates 0/15/20% plus 3.8% NIIT) or capital gains inclusion (Canada 50%) shift asset allocation and interest deductibility limits affect leverage economics.
- Corporate tax: US 21%, global minimum 15%
- Capital gains/dividends: US top 20%+3.8% NIIT; Canada inclusion 50%
- Registered-plan incentives drive demand for tax-deferred products
- Cross-border: treaty rates/withholding often 0–15%
Trade and geopolitical risk
Global tensions materially influence public and private portfolio valuations and liquidity, with geopolitical risk spikes since 2022 pushing equity and credit volatility higher and contributing to supply-chain disruptions that cut global merchandise trade volumes by about 1% in 2023 (WTO) and kept inflation/energy price shocks elevated into 2024–25.
Sanctions and supply-chain shifts have rippled into sectors held by E-L’s investment arm, notably energy, semiconductors and logistics, forcing repricing of political risk premia that widened credit spreads and equity volatility during 2023–24; diversification and dynamic hedging policies must reflect evolving geopolitics to protect NAV and liquidity.
- Geopolitical volatility: elevated since 2022
- Trade impact: global merchandise trade ≈ -1% in 2023 (WTO)
- Sector exposure: energy, semiconductors, logistics most affected
- Risk response: diversify, increase hedges, monitor credit spread repricing
MCT ~150%, OECD 15%, US 21%
Stable Canadian prudential targets (OSFI MCT ~150%, LICAT supervisory 100%) and multi-jurisdictional provincial rules (10 provinces, 3 territories) shape capital, distribution and go‑to‑market speed. OECD 15% global minimum (adopted by 140+ jurisdictions) and US 21% federal rate affect tax-driven product demand and asset allocation. Geopolitical shocks since 2022 raised volatility and widened spreads, cutting global trade ~1% in 2023.
| Metric | Value |
|---|---|
| OSFI targets | MCT ~150%; LICAT 100% |
| Jurisdictions | 10 provinces, 3 territories |
| Global min tax | OECD 15% (140+) |
| US corp tax | 21% |
What is included in the product
Detailed Word Document
Explores how macro-environmental factors uniquely affect E-L Financial across Political, Economic, Social, Technological, Environmental, and Legal dimensions, with data-backed trends and region-specific regulatory context; designed to help executives, investors, and strategists identify risks, opportunities, and scenario-driven strategic responses.
Customizable Excel Spreadsheet
Compact, visually segmented E‑L Financial PESTLE summary that can be dropped into presentations, annotated for local context or business lines, and easily shared across teams to streamline external risk discussions and align strategic planning.
Economic factors
Interest rate cycles
Interest rate cycles—with the fed funds around 5.25% and the US 10-year near 4.1% mid-2025—directly drive investment income, actuarial liabilities and product competitiveness. Higher yields boost spread earnings yet depress fixed-income marks, squeezing capital ratios. Rapid cuts or curve inversions complicate asset–liability management, so dynamic duration positioning and hedging are essential.
Inflation persistence
Inflation persistence—US CPI near 3% in 2024 while Fed funds held around 5.25%—drives higher healthcare and claims costs, pushing group benefits expense above headline inflation since medical inflation typically outpaces CPI. Elevated inflation compresses equity multiples, forcing pricing and expense discipline to offset margin erosion. Allocations to real-return and inflation-linked assets (TIPS, IL bonds) stabilize underwriting and reserve outcomes.
Market volatility
Equity and credit swings (S&P 500 fell ~19.4% in 2022 then rose ~26.9% in 2023) drive AUM-fee volatility and surplus swings for E-L Financial. Private asset valuations lag cash markets, with industry dry powder around $2.5 trillion, creating timing risk on NAVs and capital calls. Active rebalancing, maintained liquidity buffers and routine scenario testing improve resilience. Under market stress policyholder behavior—surrenders and lapses—tends to rise, pressuring liquidity.
Employment and income trends
Housing and household leverage
- Leverage pressure: higher lapse risk
- Mortgage resets: cashflow squeeze
- Protection gap widens; term life demand rises
- Retention tools: targeted underwriting, affordability options
MCT ~150%, OECD 15%, US 21%
Fed funds ~5.25% and US 10-year ~4.1% mid-2025 drive investment income, duration risk and capital pressure, requiring dynamic hedging.
Inflation ~3% (2024) and medical inflation above CPI raise claims and compress margins; TIPS/IL allocations mitigate reserve risk.
Equity/corporate swings (S&P -19.4% 2022, +26.9% 2023) and $2.5T private dry powder create NAV and liquidity timing risks.
US unemployment ~3.9% and household debt $17.8T (2024) raise lapse risk as 30y mortgage ~7% squeezes cashflow.
| Metric | Value |
|---|---|
| Fed funds | ~5.25% |
| US 10Y | ~4.1% |
| CPI (2024) | ~3% |
| Unemployment (2024) | ~3.9% |
| Household debt (2024) | $17.8T |
| 30y mortgage | ~7% |
| S&P 2022/23 | -19.4% / +26.9% |
| Private dry powder | $2.5T |
Same Document Delivered
E-L Financial PESTLE Analysis
The E-L Financial PESTLE Analysis preview shown here is the exact document you’ll receive after purchase—fully formatted and ready to use. It covers political, economic, social, technological, legal and environmental factors specific to E-L Financial. No placeholders or teasers; this is the final file. You’ll be able to download it immediately after checkout.
Description
Your Shortcut to Market Insight Starts Here
Unlock strategic clarity with our PESTLE analysis of E-L Financial — concise, research-driven insights into political, economic, social, technological, legal and environmental forces shaping its future. Ideal for investors and strategists; purchase the full report for actionable, board-ready intelligence.
Political factors
Regulatory stability
Canada’s financial sector has relatively stable policy regimes, enabling long-term insurance and investment strategies; OSFI’s Minimum Capital Test supervisory target of 150% provides predictable solvency guidance. This predictability helps E-L Financial plan capital and product roadmaps. Political shifts can recalibrate prudential rules and consumer protection priorities. Monitoring federal and provincial agendas remains critical.
OSFI and prudential policy
OSFI’s guidance, anchored by the LICAT minimum supervisory target of 100%, now drives capital factors, stress-testing design and insurer risk governance. Changes to factors or scenario severity materially affect dividend capacity and product pricing by altering available capital and risk margins. Post-market shocks OSFI has emphasized macroprudential buffers above the 100% floor, so E-L must align governance across its insurance and holding-company levels to ensure consistent capital and risk controls.
Federal–provincial dynamics
Federal–provincial dynamics matter because Canada has 10 provinces and 3 territories, each with distinct insurance distribution rules and health benefit frameworks, forcing firms to manage multiple provincial regulators and fee schedules; these variations raise coordination costs, slow speed-to-market and complicate advisor licensing and oversight, so provincial harmonization or divergence directly alters operating efficiency.
Tax policy direction
Corporate, investment and insurance tax rules—US federal corporate tax 21% and the OECD 15% global minimum adopted by 140+ jurisdictions—directly alter earnings quality and portfolio strategy; changes to dividend taxation (top US federal rates 0/15/20% plus 3.8% NIIT) or capital gains inclusion (Canada 50%) shift asset allocation and interest deductibility limits affect leverage economics.
- Corporate tax: US 21%, global minimum 15%
- Capital gains/dividends: US top 20%+3.8% NIIT; Canada inclusion 50%
- Registered-plan incentives drive demand for tax-deferred products
- Cross-border: treaty rates/withholding often 0–15%
Trade and geopolitical risk
Global tensions materially influence public and private portfolio valuations and liquidity, with geopolitical risk spikes since 2022 pushing equity and credit volatility higher and contributing to supply-chain disruptions that cut global merchandise trade volumes by about 1% in 2023 (WTO) and kept inflation/energy price shocks elevated into 2024–25.
Sanctions and supply-chain shifts have rippled into sectors held by E-L’s investment arm, notably energy, semiconductors and logistics, forcing repricing of political risk premia that widened credit spreads and equity volatility during 2023–24; diversification and dynamic hedging policies must reflect evolving geopolitics to protect NAV and liquidity.
- Geopolitical volatility: elevated since 2022
- Trade impact: global merchandise trade ≈ -1% in 2023 (WTO)
- Sector exposure: energy, semiconductors, logistics most affected
- Risk response: diversify, increase hedges, monitor credit spread repricing
MCT ~150%, OECD 15%, US 21%
Stable Canadian prudential targets (OSFI MCT ~150%, LICAT supervisory 100%) and multi-jurisdictional provincial rules (10 provinces, 3 territories) shape capital, distribution and go‑to‑market speed. OECD 15% global minimum (adopted by 140+ jurisdictions) and US 21% federal rate affect tax-driven product demand and asset allocation. Geopolitical shocks since 2022 raised volatility and widened spreads, cutting global trade ~1% in 2023.
| Metric | Value |
|---|---|
| OSFI targets | MCT ~150%; LICAT 100% |
| Jurisdictions | 10 provinces, 3 territories |
| Global min tax | OECD 15% (140+) |
| US corp tax | 21% |
What is included in the product
Detailed Word Document
Explores how macro-environmental factors uniquely affect E-L Financial across Political, Economic, Social, Technological, Environmental, and Legal dimensions, with data-backed trends and region-specific regulatory context; designed to help executives, investors, and strategists identify risks, opportunities, and scenario-driven strategic responses.
Customizable Excel Spreadsheet
Compact, visually segmented E‑L Financial PESTLE summary that can be dropped into presentations, annotated for local context or business lines, and easily shared across teams to streamline external risk discussions and align strategic planning.
Economic factors
Interest rate cycles
Interest rate cycles—with the fed funds around 5.25% and the US 10-year near 4.1% mid-2025—directly drive investment income, actuarial liabilities and product competitiveness. Higher yields boost spread earnings yet depress fixed-income marks, squeezing capital ratios. Rapid cuts or curve inversions complicate asset–liability management, so dynamic duration positioning and hedging are essential.
Inflation persistence
Inflation persistence—US CPI near 3% in 2024 while Fed funds held around 5.25%—drives higher healthcare and claims costs, pushing group benefits expense above headline inflation since medical inflation typically outpaces CPI. Elevated inflation compresses equity multiples, forcing pricing and expense discipline to offset margin erosion. Allocations to real-return and inflation-linked assets (TIPS, IL bonds) stabilize underwriting and reserve outcomes.
Market volatility
Equity and credit swings (S&P 500 fell ~19.4% in 2022 then rose ~26.9% in 2023) drive AUM-fee volatility and surplus swings for E-L Financial. Private asset valuations lag cash markets, with industry dry powder around $2.5 trillion, creating timing risk on NAVs and capital calls. Active rebalancing, maintained liquidity buffers and routine scenario testing improve resilience. Under market stress policyholder behavior—surrenders and lapses—tends to rise, pressuring liquidity.
Employment and income trends
Housing and household leverage
- Leverage pressure: higher lapse risk
- Mortgage resets: cashflow squeeze
- Protection gap widens; term life demand rises
- Retention tools: targeted underwriting, affordability options
MCT ~150%, OECD 15%, US 21%
Fed funds ~5.25% and US 10-year ~4.1% mid-2025 drive investment income, duration risk and capital pressure, requiring dynamic hedging.
Inflation ~3% (2024) and medical inflation above CPI raise claims and compress margins; TIPS/IL allocations mitigate reserve risk.
Equity/corporate swings (S&P -19.4% 2022, +26.9% 2023) and $2.5T private dry powder create NAV and liquidity timing risks.
US unemployment ~3.9% and household debt $17.8T (2024) raise lapse risk as 30y mortgage ~7% squeezes cashflow.
| Metric | Value |
|---|---|
| Fed funds | ~5.25% |
| US 10Y | ~4.1% |
| CPI (2024) | ~3% |
| Unemployment (2024) | ~3.9% |
| Household debt (2024) | $17.8T |
| 30y mortgage | ~7% |
| S&P 2022/23 | -19.4% / +26.9% |
| Private dry powder | $2.5T |
Same Document Delivered
E-L Financial PESTLE Analysis
The E-L Financial PESTLE Analysis preview shown here is the exact document you’ll receive after purchase—fully formatted and ready to use. It covers political, economic, social, technological, legal and environmental factors specific to E-L Financial. No placeholders or teasers; this is the final file. You’ll be able to download it immediately after checkout.











