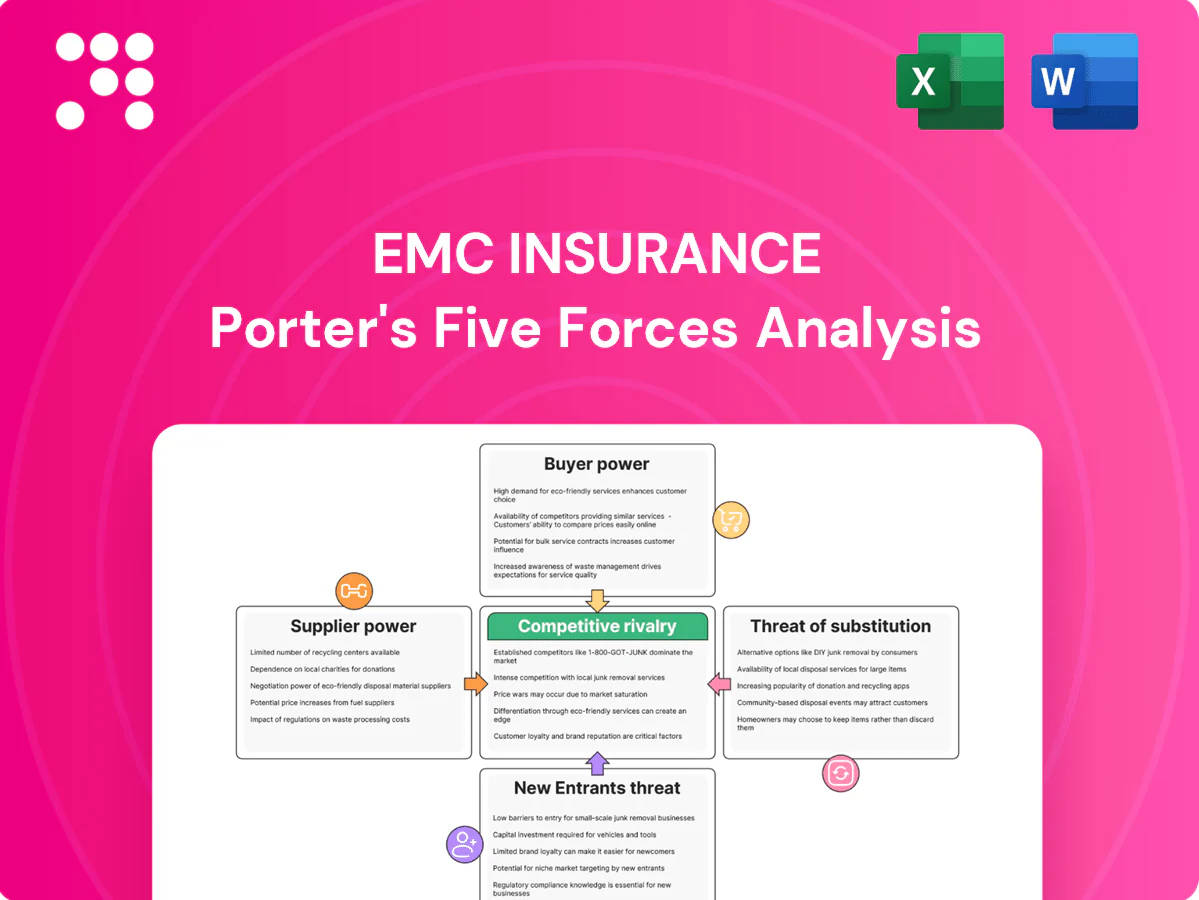
EMC Insurance Porter's Five Forces Analysis

From Overview to Strategy Blueprint
EMC Insurance faces moderate buyer power, fragmented suppliers, and steady competitive rivalry shaped by regional underwriting strength. Regulatory and capital barriers limit new entrants while substitutes remain low for commercial lines. This snapshot highlights key pressures and strategic levers. Unlock the full Porter's Five Forces Analysis for detailed ratings, visuals, and action-ready insights.
Suppliers Bargaining Power

Reliance on reinsurers
EMC cedes material risk to reinsurers for capital relief and catastrophe protection, creating dependence on external capacity. Concentrated global reinsurance markets tighten pricing and terms in hard markets, amplifying supplier power. This cyclicality increases reinsurance costs and retained limits, pressuring underwriting margins. Diversifying panels and securing multi‑year treaties can mitigate that leverage.
Data, modeling, and analytics vendors
Data, modeling, and analytics vendors—cat models, credit scores, telematics and third-party data—are central to EMCs pricing and underwriting. RMS and AIR together hold over 70% share of catastrophe modeling, raising switching costs and vendor leverage. Model updates or vendor price hikes can materially shift loss picks and reinsurance/capital needs (reinsurance ROL rose ~20% in 2023–24). Building in-house analytics and running multiple models reduces dependency and exposure.

Claims repair and medical networks
Auto/body shops, parts suppliers, TPAs and medical networks drive severity trends as rising labor and parts tightness push repair times and costs higher; parts lead times narrowed in 2024 but shop wage pressure kept rates rising. Medical inflation ran about 4–5% in 2024, increasing claim medical severity and provider bargaining. Preferred networks and DRP agreements standardize rates and service, while EMC scale and steerage improve terms; smaller regional carriers retain less leverage.

Core systems and cloud providers
Core policy/claims cores, cloud and cybersecurity are sticky, high‑switching‑cost inputs allowing vendors to command premium pricing and charge for customizations and upgrades; Synergy Research (2024) shows AWS 32%, Microsoft 23%, Google 11% cloud share, concentrating supplier power. Outages or cyber incidents create measurable operational risk for insurers, while modular architectures and negotiated SLAs help curb that power.
- High switching costs
- Premium pricing & custom fees
- Concentrated cloud share (2024)
- Outage/cyber risk
- Modularity & SLAs reduce leverage
Capital markets and rating agencies
Access to capital and strong ratings remain essential for EMC’s growth and distribution; Fed funds held at 5.25–5.50% in 2024 and higher market yields raised capital costs, increasing supplier leverage.
In stressed markets covenants tighten and rating-methodology shifts can force reallocation of capital and heavier capital buffers.
Conservative reserving and diversified underwriting and investment income preserve EMC’s negotiating position with capital providers.
- Capital cost pressure: Fed funds 5.25–5.50% (2024)
- Rating sensitivity: methodology shifts force capital moves
- Mitigant: conservative reserves + diversified earnings
Cat-model and cloud concentration plus higher rates amplify supplier leverage; diversify capacity
Reinsurer concentration and cyclic pricing give suppliers high leverage; EMC relies on external capacity for capital relief. Cat-model duopoly (RMS+AIR >70% share, 2024) and cloud concentration (AWS 32%, Microsoft 23%, Google 11%, Synergy 2024) raise switching costs; Fed funds 5.25–5.50% (2024) increases capital cost. Diversified panels, multi‑year treaties, in‑house models and SLAs reduce exposure.
| Metric | 2024 Value |
|---|---|
| RMS+AIR cat model share | >70% |
| Cloud share (AWS/MS/Google) | 32% / 23% / 11% |
| Fed funds rate | 5.25–5.50% |
What is included in the product
 Detailed Word Document
Uncovers key competitive drivers, buyer and supplier influence, entry barriers, substitute threats, and regulatory pressures specific to EMC Insurance, evaluating how these forces shape pricing power, profitability, and strategic positioning in its insurance markets.

 Customizable Excel Spreadsheet
A concise one-sheet Porter's Five Forces for EMC Insurance that maps regulatory, underwriting and competitive pressures for quick decisions—customizable for scenario stress-tests and ready to drop into pitch decks or board materials.
Customers Bargaining Power

Commercial middle market clients
Commercial middle market clients frequently compare rates, coverage breadth and value‑added risk services across carriers; larger accounts and group programs exert strong bargaining power on price and contract terms. Loss‑sensitive plans and higher deductibles shift premium leverage to buyers and can reduce carrier margin. EMC reported roughly $1.2 billion of direct premiums in 2024 and defends pricing with specialized industry niches, service depth and risk engineering.
Personal lines shoppers
In 2024 roughly 65% of personal‑lines shoppers used online aggregators or agent panels to compare premiums, increasing buyer leverage. Low switching costs and transparent pricing intensify pressure on margins, while bundle discounts and telematics-based pricing cut churn by an estimated 10–15%. Brand trust and smooth claims handling remain key retention drivers despite strong price sensitivity.

Independent agents and brokers
Independent agents control customer access and can re‑market accounts annually, with independent channels placing about 60% of U.S. property‑casualty premium in 2024 (IIABA), amplifying their leverage over EMC. They negotiate commissions, profit‑sharing and underwriting exceptions, forcing EMC to concede commercial terms. Strong relationships and ease‑of‑doing‑business drive placement decisions; EMC must compete on appetite clarity, speed and co‑marketing support to retain agents.

Loss history and data‑rich buyers
Buyers presenting clean loss runs and certified safety programs secure materially better terms, often a single-digit percentage rate advantage; in 2024 telematics adoption in commercial fleets climbed toward 30%, letting insureds prove superior risk profiles and increase leverage. Poor-risk buyers face constrained market access and weaker bargaining power. EMC can offer price concessions in exchange for verified exposure data to improve selection and loss ratios.
- Clean loss runs: single-digit rate advantage
- Telematics ~30% fleet adoption (2024)
- Data sharing increases buyer leverage
- Poor risks = limited options
- EMC trades price for verified exposure
Reinsurance buyers (for assumed business)
As a reinsurer, EMC faces cedent buyers who place panels competitively and large cedents often run auctions demanding tailored structures, which elevates buyer power. EMC’s track record, claims handling and flexible capacity provide differentiation beyond price. Writing niche treaties and specialty lines can reduce cedent leverage.
Buyers wield pricing power: 65% shop, telematics at 30%
Buyers exert strong price and contract leverage—commercial middle‑market clients and group programs push hard on terms, while EMC defends with niche appetite and service; EMC reported ~$1.2B direct premiums in 2024. Online comparison use hit ~65% (personal lines) and independent agents placed ~60% of P‑C premium (IIABA, 2024), increasing buyer power. Telematics adoption ~30% in fleets and clean loss runs yield single‑digit rate advantages.
| Metric | 2024 Value |
|---|---|
| EMC direct premiums | $1.2B |
| Personal‑line shoppers using aggregators | 65% |
| Independent agent share (P‑C) | 60% |
| Fleet telematics adoption | 30% |
| Clean loss runs advantage | <10% rate |
Full Version Awaits
EMC Insurance Porter's Five Forces Analysis
This EMC Insurance Porter's Five Forces Analysis provides a concise evaluation of industry rivalry, supplier and buyer power, threat of new entrants, and substitutes specific to EMC. This preview is the exact document you'll receive instantly after purchase—fully formatted and ready to use. No placeholders, no mockups. Use it immediately for strategic or investment decisions.

From Overview to Strategy Blueprint
EMC Insurance faces moderate buyer power, fragmented suppliers, and steady competitive rivalry shaped by regional underwriting strength. Regulatory and capital barriers limit new entrants while substitutes remain low for commercial lines. This snapshot highlights key pressures and strategic levers. Unlock the full Porter's Five Forces Analysis for detailed ratings, visuals, and action-ready insights.
Suppliers Bargaining Power
Reliance on reinsurers
EMC cedes material risk to reinsurers for capital relief and catastrophe protection, creating dependence on external capacity. Concentrated global reinsurance markets tighten pricing and terms in hard markets, amplifying supplier power. This cyclicality increases reinsurance costs and retained limits, pressuring underwriting margins. Diversifying panels and securing multi‑year treaties can mitigate that leverage.
Data, modeling, and analytics vendors
Data, modeling, and analytics vendors—cat models, credit scores, telematics and third-party data—are central to EMCs pricing and underwriting. RMS and AIR together hold over 70% share of catastrophe modeling, raising switching costs and vendor leverage. Model updates or vendor price hikes can materially shift loss picks and reinsurance/capital needs (reinsurance ROL rose ~20% in 2023–24). Building in-house analytics and running multiple models reduces dependency and exposure.
Claims repair and medical networks
Auto/body shops, parts suppliers, TPAs and medical networks drive severity trends as rising labor and parts tightness push repair times and costs higher; parts lead times narrowed in 2024 but shop wage pressure kept rates rising. Medical inflation ran about 4–5% in 2024, increasing claim medical severity and provider bargaining. Preferred networks and DRP agreements standardize rates and service, while EMC scale and steerage improve terms; smaller regional carriers retain less leverage.
Core systems and cloud providers
Core policy/claims cores, cloud and cybersecurity are sticky, high‑switching‑cost inputs allowing vendors to command premium pricing and charge for customizations and upgrades; Synergy Research (2024) shows AWS 32%, Microsoft 23%, Google 11% cloud share, concentrating supplier power. Outages or cyber incidents create measurable operational risk for insurers, while modular architectures and negotiated SLAs help curb that power.
- High switching costs
- Premium pricing & custom fees
- Concentrated cloud share (2024)
- Outage/cyber risk
- Modularity & SLAs reduce leverage
Capital markets and rating agencies
Access to capital and strong ratings remain essential for EMC’s growth and distribution; Fed funds held at 5.25–5.50% in 2024 and higher market yields raised capital costs, increasing supplier leverage.
In stressed markets covenants tighten and rating-methodology shifts can force reallocation of capital and heavier capital buffers.
Conservative reserving and diversified underwriting and investment income preserve EMC’s negotiating position with capital providers.
- Capital cost pressure: Fed funds 5.25–5.50% (2024)
- Rating sensitivity: methodology shifts force capital moves
- Mitigant: conservative reserves + diversified earnings
Cat-model and cloud concentration plus higher rates amplify supplier leverage; diversify capacity
Reinsurer concentration and cyclic pricing give suppliers high leverage; EMC relies on external capacity for capital relief. Cat-model duopoly (RMS+AIR >70% share, 2024) and cloud concentration (AWS 32%, Microsoft 23%, Google 11%, Synergy 2024) raise switching costs; Fed funds 5.25–5.50% (2024) increases capital cost. Diversified panels, multi‑year treaties, in‑house models and SLAs reduce exposure.
| Metric | 2024 Value |
|---|---|
| RMS+AIR cat model share | >70% |
| Cloud share (AWS/MS/Google) | 32% / 23% / 11% |
| Fed funds rate | 5.25–5.50% |
What is included in the product
Detailed Word Document
Uncovers key competitive drivers, buyer and supplier influence, entry barriers, substitute threats, and regulatory pressures specific to EMC Insurance, evaluating how these forces shape pricing power, profitability, and strategic positioning in its insurance markets.
Customizable Excel Spreadsheet
A concise one-sheet Porter's Five Forces for EMC Insurance that maps regulatory, underwriting and competitive pressures for quick decisions—customizable for scenario stress-tests and ready to drop into pitch decks or board materials.
Customers Bargaining Power
Commercial middle market clients
Commercial middle market clients frequently compare rates, coverage breadth and value‑added risk services across carriers; larger accounts and group programs exert strong bargaining power on price and contract terms. Loss‑sensitive plans and higher deductibles shift premium leverage to buyers and can reduce carrier margin. EMC reported roughly $1.2 billion of direct premiums in 2024 and defends pricing with specialized industry niches, service depth and risk engineering.
Personal lines shoppers
In 2024 roughly 65% of personal‑lines shoppers used online aggregators or agent panels to compare premiums, increasing buyer leverage. Low switching costs and transparent pricing intensify pressure on margins, while bundle discounts and telematics-based pricing cut churn by an estimated 10–15%. Brand trust and smooth claims handling remain key retention drivers despite strong price sensitivity.
Independent agents and brokers
Independent agents control customer access and can re‑market accounts annually, with independent channels placing about 60% of U.S. property‑casualty premium in 2024 (IIABA), amplifying their leverage over EMC. They negotiate commissions, profit‑sharing and underwriting exceptions, forcing EMC to concede commercial terms. Strong relationships and ease‑of‑doing‑business drive placement decisions; EMC must compete on appetite clarity, speed and co‑marketing support to retain agents.
Loss history and data‑rich buyers
Buyers presenting clean loss runs and certified safety programs secure materially better terms, often a single-digit percentage rate advantage; in 2024 telematics adoption in commercial fleets climbed toward 30%, letting insureds prove superior risk profiles and increase leverage. Poor-risk buyers face constrained market access and weaker bargaining power. EMC can offer price concessions in exchange for verified exposure data to improve selection and loss ratios.
- Clean loss runs: single-digit rate advantage
- Telematics ~30% fleet adoption (2024)
- Data sharing increases buyer leverage
- Poor risks = limited options
- EMC trades price for verified exposure
Reinsurance buyers (for assumed business)
As a reinsurer, EMC faces cedent buyers who place panels competitively and large cedents often run auctions demanding tailored structures, which elevates buyer power. EMC’s track record, claims handling and flexible capacity provide differentiation beyond price. Writing niche treaties and specialty lines can reduce cedent leverage.
Buyers wield pricing power: 65% shop, telematics at 30%
Buyers exert strong price and contract leverage—commercial middle‑market clients and group programs push hard on terms, while EMC defends with niche appetite and service; EMC reported ~$1.2B direct premiums in 2024. Online comparison use hit ~65% (personal lines) and independent agents placed ~60% of P‑C premium (IIABA, 2024), increasing buyer power. Telematics adoption ~30% in fleets and clean loss runs yield single‑digit rate advantages.
| Metric | 2024 Value |
|---|---|
| EMC direct premiums | $1.2B |
| Personal‑line shoppers using aggregators | 65% |
| Independent agent share (P‑C) | 60% |
| Fleet telematics adoption | 30% |
| Clean loss runs advantage | <10% rate |
Full Version Awaits
EMC Insurance Porter's Five Forces Analysis
This EMC Insurance Porter's Five Forces Analysis provides a concise evaluation of industry rivalry, supplier and buyer power, threat of new entrants, and substitutes specific to EMC. This preview is the exact document you'll receive instantly after purchase—fully formatted and ready to use. No placeholders, no mockups. Use it immediately for strategic or investment decisions.
Description
From Overview to Strategy Blueprint
EMC Insurance faces moderate buyer power, fragmented suppliers, and steady competitive rivalry shaped by regional underwriting strength. Regulatory and capital barriers limit new entrants while substitutes remain low for commercial lines. This snapshot highlights key pressures and strategic levers. Unlock the full Porter's Five Forces Analysis for detailed ratings, visuals, and action-ready insights.
Suppliers Bargaining Power
Reliance on reinsurers
EMC cedes material risk to reinsurers for capital relief and catastrophe protection, creating dependence on external capacity. Concentrated global reinsurance markets tighten pricing and terms in hard markets, amplifying supplier power. This cyclicality increases reinsurance costs and retained limits, pressuring underwriting margins. Diversifying panels and securing multi‑year treaties can mitigate that leverage.
Data, modeling, and analytics vendors
Data, modeling, and analytics vendors—cat models, credit scores, telematics and third-party data—are central to EMCs pricing and underwriting. RMS and AIR together hold over 70% share of catastrophe modeling, raising switching costs and vendor leverage. Model updates or vendor price hikes can materially shift loss picks and reinsurance/capital needs (reinsurance ROL rose ~20% in 2023–24). Building in-house analytics and running multiple models reduces dependency and exposure.
Claims repair and medical networks
Auto/body shops, parts suppliers, TPAs and medical networks drive severity trends as rising labor and parts tightness push repair times and costs higher; parts lead times narrowed in 2024 but shop wage pressure kept rates rising. Medical inflation ran about 4–5% in 2024, increasing claim medical severity and provider bargaining. Preferred networks and DRP agreements standardize rates and service, while EMC scale and steerage improve terms; smaller regional carriers retain less leverage.
Core systems and cloud providers
Core policy/claims cores, cloud and cybersecurity are sticky, high‑switching‑cost inputs allowing vendors to command premium pricing and charge for customizations and upgrades; Synergy Research (2024) shows AWS 32%, Microsoft 23%, Google 11% cloud share, concentrating supplier power. Outages or cyber incidents create measurable operational risk for insurers, while modular architectures and negotiated SLAs help curb that power.
- High switching costs
- Premium pricing & custom fees
- Concentrated cloud share (2024)
- Outage/cyber risk
- Modularity & SLAs reduce leverage
Capital markets and rating agencies
Access to capital and strong ratings remain essential for EMC’s growth and distribution; Fed funds held at 5.25–5.50% in 2024 and higher market yields raised capital costs, increasing supplier leverage.
In stressed markets covenants tighten and rating-methodology shifts can force reallocation of capital and heavier capital buffers.
Conservative reserving and diversified underwriting and investment income preserve EMC’s negotiating position with capital providers.
- Capital cost pressure: Fed funds 5.25–5.50% (2024)
- Rating sensitivity: methodology shifts force capital moves
- Mitigant: conservative reserves + diversified earnings
Cat-model and cloud concentration plus higher rates amplify supplier leverage; diversify capacity
Reinsurer concentration and cyclic pricing give suppliers high leverage; EMC relies on external capacity for capital relief. Cat-model duopoly (RMS+AIR >70% share, 2024) and cloud concentration (AWS 32%, Microsoft 23%, Google 11%, Synergy 2024) raise switching costs; Fed funds 5.25–5.50% (2024) increases capital cost. Diversified panels, multi‑year treaties, in‑house models and SLAs reduce exposure.
| Metric | 2024 Value |
|---|---|
| RMS+AIR cat model share | >70% |
| Cloud share (AWS/MS/Google) | 32% / 23% / 11% |
| Fed funds rate | 5.25–5.50% |
What is included in the product
Detailed Word Document
Uncovers key competitive drivers, buyer and supplier influence, entry barriers, substitute threats, and regulatory pressures specific to EMC Insurance, evaluating how these forces shape pricing power, profitability, and strategic positioning in its insurance markets.
Customizable Excel Spreadsheet
A concise one-sheet Porter's Five Forces for EMC Insurance that maps regulatory, underwriting and competitive pressures for quick decisions—customizable for scenario stress-tests and ready to drop into pitch decks or board materials.
Customers Bargaining Power
Commercial middle market clients
Commercial middle market clients frequently compare rates, coverage breadth and value‑added risk services across carriers; larger accounts and group programs exert strong bargaining power on price and contract terms. Loss‑sensitive plans and higher deductibles shift premium leverage to buyers and can reduce carrier margin. EMC reported roughly $1.2 billion of direct premiums in 2024 and defends pricing with specialized industry niches, service depth and risk engineering.
Personal lines shoppers
In 2024 roughly 65% of personal‑lines shoppers used online aggregators or agent panels to compare premiums, increasing buyer leverage. Low switching costs and transparent pricing intensify pressure on margins, while bundle discounts and telematics-based pricing cut churn by an estimated 10–15%. Brand trust and smooth claims handling remain key retention drivers despite strong price sensitivity.
Independent agents and brokers
Independent agents control customer access and can re‑market accounts annually, with independent channels placing about 60% of U.S. property‑casualty premium in 2024 (IIABA), amplifying their leverage over EMC. They negotiate commissions, profit‑sharing and underwriting exceptions, forcing EMC to concede commercial terms. Strong relationships and ease‑of‑doing‑business drive placement decisions; EMC must compete on appetite clarity, speed and co‑marketing support to retain agents.
Loss history and data‑rich buyers
Buyers presenting clean loss runs and certified safety programs secure materially better terms, often a single-digit percentage rate advantage; in 2024 telematics adoption in commercial fleets climbed toward 30%, letting insureds prove superior risk profiles and increase leverage. Poor-risk buyers face constrained market access and weaker bargaining power. EMC can offer price concessions in exchange for verified exposure data to improve selection and loss ratios.
- Clean loss runs: single-digit rate advantage
- Telematics ~30% fleet adoption (2024)
- Data sharing increases buyer leverage
- Poor risks = limited options
- EMC trades price for verified exposure
Reinsurance buyers (for assumed business)
As a reinsurer, EMC faces cedent buyers who place panels competitively and large cedents often run auctions demanding tailored structures, which elevates buyer power. EMC’s track record, claims handling and flexible capacity provide differentiation beyond price. Writing niche treaties and specialty lines can reduce cedent leverage.
Buyers wield pricing power: 65% shop, telematics at 30%
Buyers exert strong price and contract leverage—commercial middle‑market clients and group programs push hard on terms, while EMC defends with niche appetite and service; EMC reported ~$1.2B direct premiums in 2024. Online comparison use hit ~65% (personal lines) and independent agents placed ~60% of P‑C premium (IIABA, 2024), increasing buyer power. Telematics adoption ~30% in fleets and clean loss runs yield single‑digit rate advantages.
| Metric | 2024 Value |
|---|---|
| EMC direct premiums | $1.2B |
| Personal‑line shoppers using aggregators | 65% |
| Independent agent share (P‑C) | 60% |
| Fleet telematics adoption | 30% |
| Clean loss runs advantage | <10% rate |
Full Version Awaits
EMC Insurance Porter's Five Forces Analysis
This EMC Insurance Porter's Five Forces Analysis provides a concise evaluation of industry rivalry, supplier and buyer power, threat of new entrants, and substitutes specific to EMC. This preview is the exact document you'll receive instantly after purchase—fully formatted and ready to use. No placeholders, no mockups. Use it immediately for strategic or investment decisions.











