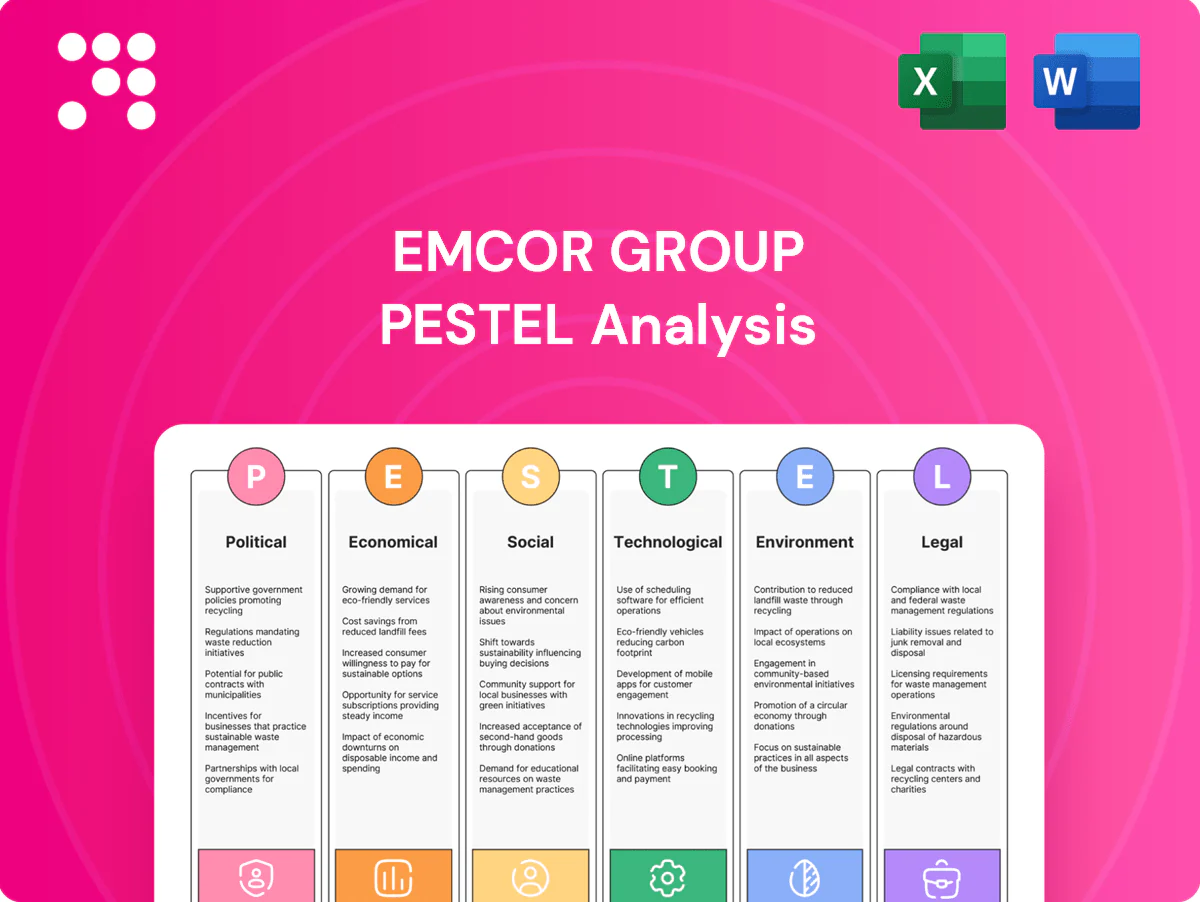
EMCOR Group PESTLE Analysis

Make Smarter Strategic Decisions with a Complete PESTEL View
Unlock strategic advantage with our targeted PESTLE Analysis of EMCOR Group. Learn how political shifts, economic trends, and technological advances will affect operations and margins. Ideal for investors and strategists seeking fast, actionable intelligence. Buy the full report to access the complete, editable breakdown and start making smarter decisions today.
Political factors

Infrastructure and public spending cycles
EMCOR’s pipeline is driven by federal, state and municipal capital budgets for infrastructure, healthcare, education and defense, with the 2021 Bipartisan Infrastructure Law committing roughly 550 billion dollars in new federal investment that can accelerate project starts. Appropriations and targeted grant programs fast‑track awards, while continuing resolutions or shutdown threats (seen in multiple FY cycles) pause contract awards and cash flow. Regional political priorities produce uneven demand across states, concentrating opportunities in districts with active transportation, healthcare and public works funding.
Energy and decarbonization policy incentives
Tax credits and grants embedded in the Inflation Reduction Act, totaling roughly $369 billion in clean energy incentives, directly stimulate demand for EMCOR’s electrical, mechanical and energy services by lowering project ROI hurdles for clients. Policy stability increases client confidence to greenlight retrofits and long-term service contracts, expanding backlog visibility. Shifts in administration priorities can reweight incentives across technologies, while utility regulation shapes adoption of distributed energy and microgrids.

Government procurement rules and preferences
Government rules like Buy American, small-business set-asides and local-content rules shape EMCOR bidding and sourcing strategies. Small-business federal contracting goal of 23%, the Simplified Acquisition Threshold at $250,000 and micro-purchase level $10,000 drive prime/sub teaming and supplier selection. IDIQs, design-build and performance-based contracts shift risk and cash timing, favoring experienced contractors with compliance systems. Changes to thresholds or audit rigor raise back-office overhead.

Labor and immigration policies
- EMCOR FY2024 revenue ~11.2B affecting scale of labor absorption
- IIJA $1.2T supports trades demand
- Stricter E-Verify/visa rules limit workforce flexibility
- Prevailing wage/union focus increases public project costs
Geopolitical supply chain exposure
Tariffs (Section 301 tariffs up to 25%) and sanctions drive higher input costs and intermittent shortages for electrical gear, switchgear, HVAC components and semiconductors; transformers and control lead times have stretched as high as 52 weeks, elongating EMCOR project schedules. US reshoring incentives such as the CHIPS Act (roughly $52 billion) are shifting supplier bases and raising component costs and risk premiums on critical infrastructure jobs.
- Tariffs: Section 301 up to 25%
- Transformers: lead times up to 52 weeks
- CHIPS Act: ~$52 billion reshoring support
- Outcome: higher supplier costs and elevated risk premiums
Public-works pipeline boosted by IIJA/IRA; tariffs and 52-week transformer lead times raise costs
EMCOR’s pipeline depends on federal, state and municipal capital budgets, with IIJA/Infrastructure Law ~$1.2T and IRA clean‑energy incentives ~$369B boosting projects and services. FY2024 revenue ≈ $11.2B supports labor absorption but stricter E‑Verify/visa rules and prevailing wage enforcement constrain flexibility and raise public-project costs. Tariffs (Section 301 up to 25%), transformer lead times up to 52 weeks and CHIPS ~$52B reshoring funds increase input costs and schedule risk.
| Metric | Value |
|---|---|
| FY2024 Revenue | $11.2B |
| IIJA | $1.2T |
| IRA | $369B |
| CHIPS | $52B |
| Tariffs | Up to 25% |
| Transformer lead time | Up to 52 weeks |
What is included in the product
 Detailed Word Document
Explores how Political, Economic, Social, Technological, Environmental, and Legal forces uniquely impact EMCOR Group—backed by current data and industry trends—to identify risks, strategic opportunities, and scenario-driven insights tailored for executives, investors, and consultants and ready for integration into plans and reports.

 Customizable Excel Spreadsheet
A concise, visually segmented PESTLE summary of EMCOR Group for quick meeting reference, editable for region or business-line notes and easily dropped into PowerPoints or shared across teams to speed alignment on external risks and market positioning.
Economic factors

Interest rates and client capex
Higher interest rates—with the US policy rate around 5.25–5.50% in mid‑2025—raise financing costs for commercial real estate and industrial expansions, delaying MEP‑intensive projects and slowing backlog conversion. Lower rates can quickly revive project starts and backlog turnover. Public sector and utilities are less rate‑sensitive but face budget constraints, and EMCOR’s diversified mix helps smooth these cyclical swings.
Construction cycle and backlog health
Non-residential construction trends in 2024 directly influenced EMCOR bookings and utilization, with strong backlog providing revenue visibility and supporting pricing discipline while project cancellations compressed margins.

Labor availability and wage inflation
Tight labor markets push wages for electricians, plumbers, HVAC techs and project managers higher (BLS projects about 6% growth for electricians 2022–32), and many contractors reported persistent hiring difficulty in 2024. Productivity programs and prefabrication (McKinsey/industry studies show offsite methods can cut onsite labor hours substantially) can offset wage inflation. Contract escalation clauses and indexation help protect margins, but prolonged shortages may cap EMCOR’s revenue growth despite healthy demand.

Materials and equipment costs
Volatile copper (~$9,200/tonne in H1 2025), steel HRC (~$850/tonne) and refrigerant price swings plus expensive electrical gear erode bid accuracy for EMCOR; long lead times for switchgear and transformers (20–40 weeks) force contingency pricing. Strategic procurement and supplier alliances can flatten cost curves, while fixed-price contracts raise exposure if price spikes are not hedged.
- copper ~$9,200/tonne H1 2025
- steel HRC ~$850/tonne
- lead times 20–40 weeks
- hedging/alliances reduce margin risk
Client end-market health
Industrial reshoring plus the CHIPS Act (52 billion USD) and heavy EV plant investment are boosting specialized MEP demand; semiconductor and EV supply chains drive electrical and clean-energy work. US office vacancy near 18% in 2024 (CBRE) weakens tenant improvements, while data center and life-sciences construction (data center CAGR ~6.5% to 2028) offsets. Federal grid funds (~60+ billion USD) sustain steady utility work; facilities services add recurring revenue through downturns.
- CHIPS Act 52 billion USD
- US office vacancy ~18% (2024)
- Data center CAGR ~6.5% to 2028
- Federal grid funding ~60+ billion USD
- Facilities services = recurring downside protection
Public-works pipeline boosted by IIJA/IRA; tariffs and 52-week transformer lead times raise costs
Higher rates (~5.25–5.50% mid‑2025) raise financing costs and slow MEP project starts; strong backlog and public utility spending moderate cyclicality. Tight labor (electrician wages +~6% 2022–32) and volatile materials (copper ~9,200/t; HRC steel ~850/t) squeeze margins; prefabrication, escalation clauses and supplier alliances mitigate risk.
| Metric | Value |
|---|---|
| Fed funds | 5.25–5.50% (mid‑2025) |
| Copper | ~9,200 USD/tonne H1 2025 |
| Steel HRC | ~850 USD/tonne |
| Electrician wage growth | ~6% (2022–32) |
What You See Is What You Get
EMCOR Group PESTLE Analysis
The preview shown here is the exact EMCOR Group PESTLE Analysis you’ll receive after purchase—fully formatted and ready to use. It contains the complete political, economic, social, technological, legal, and environmental assessment with professional layout and sourced insights. No placeholders or surprises; you’ll download this identical file immediately after checkout.

Make Smarter Strategic Decisions with a Complete PESTEL View
Unlock strategic advantage with our targeted PESTLE Analysis of EMCOR Group. Learn how political shifts, economic trends, and technological advances will affect operations and margins. Ideal for investors and strategists seeking fast, actionable intelligence. Buy the full report to access the complete, editable breakdown and start making smarter decisions today.
Political factors
Infrastructure and public spending cycles
EMCOR’s pipeline is driven by federal, state and municipal capital budgets for infrastructure, healthcare, education and defense, with the 2021 Bipartisan Infrastructure Law committing roughly 550 billion dollars in new federal investment that can accelerate project starts. Appropriations and targeted grant programs fast‑track awards, while continuing resolutions or shutdown threats (seen in multiple FY cycles) pause contract awards and cash flow. Regional political priorities produce uneven demand across states, concentrating opportunities in districts with active transportation, healthcare and public works funding.
Energy and decarbonization policy incentives
Tax credits and grants embedded in the Inflation Reduction Act, totaling roughly $369 billion in clean energy incentives, directly stimulate demand for EMCOR’s electrical, mechanical and energy services by lowering project ROI hurdles for clients. Policy stability increases client confidence to greenlight retrofits and long-term service contracts, expanding backlog visibility. Shifts in administration priorities can reweight incentives across technologies, while utility regulation shapes adoption of distributed energy and microgrids.
Government procurement rules and preferences
Government rules like Buy American, small-business set-asides and local-content rules shape EMCOR bidding and sourcing strategies. Small-business federal contracting goal of 23%, the Simplified Acquisition Threshold at $250,000 and micro-purchase level $10,000 drive prime/sub teaming and supplier selection. IDIQs, design-build and performance-based contracts shift risk and cash timing, favoring experienced contractors with compliance systems. Changes to thresholds or audit rigor raise back-office overhead.
Labor and immigration policies
- EMCOR FY2024 revenue ~11.2B affecting scale of labor absorption
- IIJA $1.2T supports trades demand
- Stricter E-Verify/visa rules limit workforce flexibility
- Prevailing wage/union focus increases public project costs
Geopolitical supply chain exposure
Tariffs (Section 301 tariffs up to 25%) and sanctions drive higher input costs and intermittent shortages for electrical gear, switchgear, HVAC components and semiconductors; transformers and control lead times have stretched as high as 52 weeks, elongating EMCOR project schedules. US reshoring incentives such as the CHIPS Act (roughly $52 billion) are shifting supplier bases and raising component costs and risk premiums on critical infrastructure jobs.
- Tariffs: Section 301 up to 25%
- Transformers: lead times up to 52 weeks
- CHIPS Act: ~$52 billion reshoring support
- Outcome: higher supplier costs and elevated risk premiums
Public-works pipeline boosted by IIJA/IRA; tariffs and 52-week transformer lead times raise costs
EMCOR’s pipeline depends on federal, state and municipal capital budgets, with IIJA/Infrastructure Law ~$1.2T and IRA clean‑energy incentives ~$369B boosting projects and services. FY2024 revenue ≈ $11.2B supports labor absorption but stricter E‑Verify/visa rules and prevailing wage enforcement constrain flexibility and raise public-project costs. Tariffs (Section 301 up to 25%), transformer lead times up to 52 weeks and CHIPS ~$52B reshoring funds increase input costs and schedule risk.
| Metric | Value |
|---|---|
| FY2024 Revenue | $11.2B |
| IIJA | $1.2T |
| IRA | $369B |
| CHIPS | $52B |
| Tariffs | Up to 25% |
| Transformer lead time | Up to 52 weeks |
What is included in the product
Detailed Word Document
Explores how Political, Economic, Social, Technological, Environmental, and Legal forces uniquely impact EMCOR Group—backed by current data and industry trends—to identify risks, strategic opportunities, and scenario-driven insights tailored for executives, investors, and consultants and ready for integration into plans and reports.
Customizable Excel Spreadsheet
A concise, visually segmented PESTLE summary of EMCOR Group for quick meeting reference, editable for region or business-line notes and easily dropped into PowerPoints or shared across teams to speed alignment on external risks and market positioning.
Economic factors
Interest rates and client capex
Higher interest rates—with the US policy rate around 5.25–5.50% in mid‑2025—raise financing costs for commercial real estate and industrial expansions, delaying MEP‑intensive projects and slowing backlog conversion. Lower rates can quickly revive project starts and backlog turnover. Public sector and utilities are less rate‑sensitive but face budget constraints, and EMCOR’s diversified mix helps smooth these cyclical swings.
Construction cycle and backlog health
Non-residential construction trends in 2024 directly influenced EMCOR bookings and utilization, with strong backlog providing revenue visibility and supporting pricing discipline while project cancellations compressed margins.
Labor availability and wage inflation
Tight labor markets push wages for electricians, plumbers, HVAC techs and project managers higher (BLS projects about 6% growth for electricians 2022–32), and many contractors reported persistent hiring difficulty in 2024. Productivity programs and prefabrication (McKinsey/industry studies show offsite methods can cut onsite labor hours substantially) can offset wage inflation. Contract escalation clauses and indexation help protect margins, but prolonged shortages may cap EMCOR’s revenue growth despite healthy demand.
Materials and equipment costs
Volatile copper (~$9,200/tonne in H1 2025), steel HRC (~$850/tonne) and refrigerant price swings plus expensive electrical gear erode bid accuracy for EMCOR; long lead times for switchgear and transformers (20–40 weeks) force contingency pricing. Strategic procurement and supplier alliances can flatten cost curves, while fixed-price contracts raise exposure if price spikes are not hedged.
- copper ~$9,200/tonne H1 2025
- steel HRC ~$850/tonne
- lead times 20–40 weeks
- hedging/alliances reduce margin risk
Client end-market health
Industrial reshoring plus the CHIPS Act (52 billion USD) and heavy EV plant investment are boosting specialized MEP demand; semiconductor and EV supply chains drive electrical and clean-energy work. US office vacancy near 18% in 2024 (CBRE) weakens tenant improvements, while data center and life-sciences construction (data center CAGR ~6.5% to 2028) offsets. Federal grid funds (~60+ billion USD) sustain steady utility work; facilities services add recurring revenue through downturns.
- CHIPS Act 52 billion USD
- US office vacancy ~18% (2024)
- Data center CAGR ~6.5% to 2028
- Federal grid funding ~60+ billion USD
- Facilities services = recurring downside protection
Public-works pipeline boosted by IIJA/IRA; tariffs and 52-week transformer lead times raise costs
Higher rates (~5.25–5.50% mid‑2025) raise financing costs and slow MEP project starts; strong backlog and public utility spending moderate cyclicality. Tight labor (electrician wages +~6% 2022–32) and volatile materials (copper ~9,200/t; HRC steel ~850/t) squeeze margins; prefabrication, escalation clauses and supplier alliances mitigate risk.
| Metric | Value |
|---|---|
| Fed funds | 5.25–5.50% (mid‑2025) |
| Copper | ~9,200 USD/tonne H1 2025 |
| Steel HRC | ~850 USD/tonne |
| Electrician wage growth | ~6% (2022–32) |
What You See Is What You Get
EMCOR Group PESTLE Analysis
The preview shown here is the exact EMCOR Group PESTLE Analysis you’ll receive after purchase—fully formatted and ready to use. It contains the complete political, economic, social, technological, legal, and environmental assessment with professional layout and sourced insights. No placeholders or surprises; you’ll download this identical file immediately after checkout.
Description
Make Smarter Strategic Decisions with a Complete PESTEL View
Unlock strategic advantage with our targeted PESTLE Analysis of EMCOR Group. Learn how political shifts, economic trends, and technological advances will affect operations and margins. Ideal for investors and strategists seeking fast, actionable intelligence. Buy the full report to access the complete, editable breakdown and start making smarter decisions today.
Political factors
Infrastructure and public spending cycles
EMCOR’s pipeline is driven by federal, state and municipal capital budgets for infrastructure, healthcare, education and defense, with the 2021 Bipartisan Infrastructure Law committing roughly 550 billion dollars in new federal investment that can accelerate project starts. Appropriations and targeted grant programs fast‑track awards, while continuing resolutions or shutdown threats (seen in multiple FY cycles) pause contract awards and cash flow. Regional political priorities produce uneven demand across states, concentrating opportunities in districts with active transportation, healthcare and public works funding.
Energy and decarbonization policy incentives
Tax credits and grants embedded in the Inflation Reduction Act, totaling roughly $369 billion in clean energy incentives, directly stimulate demand for EMCOR’s electrical, mechanical and energy services by lowering project ROI hurdles for clients. Policy stability increases client confidence to greenlight retrofits and long-term service contracts, expanding backlog visibility. Shifts in administration priorities can reweight incentives across technologies, while utility regulation shapes adoption of distributed energy and microgrids.
Government procurement rules and preferences
Government rules like Buy American, small-business set-asides and local-content rules shape EMCOR bidding and sourcing strategies. Small-business federal contracting goal of 23%, the Simplified Acquisition Threshold at $250,000 and micro-purchase level $10,000 drive prime/sub teaming and supplier selection. IDIQs, design-build and performance-based contracts shift risk and cash timing, favoring experienced contractors with compliance systems. Changes to thresholds or audit rigor raise back-office overhead.
Labor and immigration policies
- EMCOR FY2024 revenue ~11.2B affecting scale of labor absorption
- IIJA $1.2T supports trades demand
- Stricter E-Verify/visa rules limit workforce flexibility
- Prevailing wage/union focus increases public project costs
Geopolitical supply chain exposure
Tariffs (Section 301 tariffs up to 25%) and sanctions drive higher input costs and intermittent shortages for electrical gear, switchgear, HVAC components and semiconductors; transformers and control lead times have stretched as high as 52 weeks, elongating EMCOR project schedules. US reshoring incentives such as the CHIPS Act (roughly $52 billion) are shifting supplier bases and raising component costs and risk premiums on critical infrastructure jobs.
- Tariffs: Section 301 up to 25%
- Transformers: lead times up to 52 weeks
- CHIPS Act: ~$52 billion reshoring support
- Outcome: higher supplier costs and elevated risk premiums
Public-works pipeline boosted by IIJA/IRA; tariffs and 52-week transformer lead times raise costs
EMCOR’s pipeline depends on federal, state and municipal capital budgets, with IIJA/Infrastructure Law ~$1.2T and IRA clean‑energy incentives ~$369B boosting projects and services. FY2024 revenue ≈ $11.2B supports labor absorption but stricter E‑Verify/visa rules and prevailing wage enforcement constrain flexibility and raise public-project costs. Tariffs (Section 301 up to 25%), transformer lead times up to 52 weeks and CHIPS ~$52B reshoring funds increase input costs and schedule risk.
| Metric | Value |
|---|---|
| FY2024 Revenue | $11.2B |
| IIJA | $1.2T |
| IRA | $369B |
| CHIPS | $52B |
| Tariffs | Up to 25% |
| Transformer lead time | Up to 52 weeks |
What is included in the product
Detailed Word Document
Explores how Political, Economic, Social, Technological, Environmental, and Legal forces uniquely impact EMCOR Group—backed by current data and industry trends—to identify risks, strategic opportunities, and scenario-driven insights tailored for executives, investors, and consultants and ready for integration into plans and reports.
Customizable Excel Spreadsheet
A concise, visually segmented PESTLE summary of EMCOR Group for quick meeting reference, editable for region or business-line notes and easily dropped into PowerPoints or shared across teams to speed alignment on external risks and market positioning.
Economic factors
Interest rates and client capex
Higher interest rates—with the US policy rate around 5.25–5.50% in mid‑2025—raise financing costs for commercial real estate and industrial expansions, delaying MEP‑intensive projects and slowing backlog conversion. Lower rates can quickly revive project starts and backlog turnover. Public sector and utilities are less rate‑sensitive but face budget constraints, and EMCOR’s diversified mix helps smooth these cyclical swings.
Construction cycle and backlog health
Non-residential construction trends in 2024 directly influenced EMCOR bookings and utilization, with strong backlog providing revenue visibility and supporting pricing discipline while project cancellations compressed margins.
Labor availability and wage inflation
Tight labor markets push wages for electricians, plumbers, HVAC techs and project managers higher (BLS projects about 6% growth for electricians 2022–32), and many contractors reported persistent hiring difficulty in 2024. Productivity programs and prefabrication (McKinsey/industry studies show offsite methods can cut onsite labor hours substantially) can offset wage inflation. Contract escalation clauses and indexation help protect margins, but prolonged shortages may cap EMCOR’s revenue growth despite healthy demand.
Materials and equipment costs
Volatile copper (~$9,200/tonne in H1 2025), steel HRC (~$850/tonne) and refrigerant price swings plus expensive electrical gear erode bid accuracy for EMCOR; long lead times for switchgear and transformers (20–40 weeks) force contingency pricing. Strategic procurement and supplier alliances can flatten cost curves, while fixed-price contracts raise exposure if price spikes are not hedged.
- copper ~$9,200/tonne H1 2025
- steel HRC ~$850/tonne
- lead times 20–40 weeks
- hedging/alliances reduce margin risk
Client end-market health
Industrial reshoring plus the CHIPS Act (52 billion USD) and heavy EV plant investment are boosting specialized MEP demand; semiconductor and EV supply chains drive electrical and clean-energy work. US office vacancy near 18% in 2024 (CBRE) weakens tenant improvements, while data center and life-sciences construction (data center CAGR ~6.5% to 2028) offsets. Federal grid funds (~60+ billion USD) sustain steady utility work; facilities services add recurring revenue through downturns.
- CHIPS Act 52 billion USD
- US office vacancy ~18% (2024)
- Data center CAGR ~6.5% to 2028
- Federal grid funding ~60+ billion USD
- Facilities services = recurring downside protection
Public-works pipeline boosted by IIJA/IRA; tariffs and 52-week transformer lead times raise costs
Higher rates (~5.25–5.50% mid‑2025) raise financing costs and slow MEP project starts; strong backlog and public utility spending moderate cyclicality. Tight labor (electrician wages +~6% 2022–32) and volatile materials (copper ~9,200/t; HRC steel ~850/t) squeeze margins; prefabrication, escalation clauses and supplier alliances mitigate risk.
| Metric | Value |
|---|---|
| Fed funds | 5.25–5.50% (mid‑2025) |
| Copper | ~9,200 USD/tonne H1 2025 |
| Steel HRC | ~850 USD/tonne |
| Electrician wage growth | ~6% (2022–32) |
What You See Is What You Get
EMCOR Group PESTLE Analysis
The preview shown here is the exact EMCOR Group PESTLE Analysis you’ll receive after purchase—fully formatted and ready to use. It contains the complete political, economic, social, technological, legal, and environmental assessment with professional layout and sourced insights. No placeholders or surprises; you’ll download this identical file immediately after checkout.











