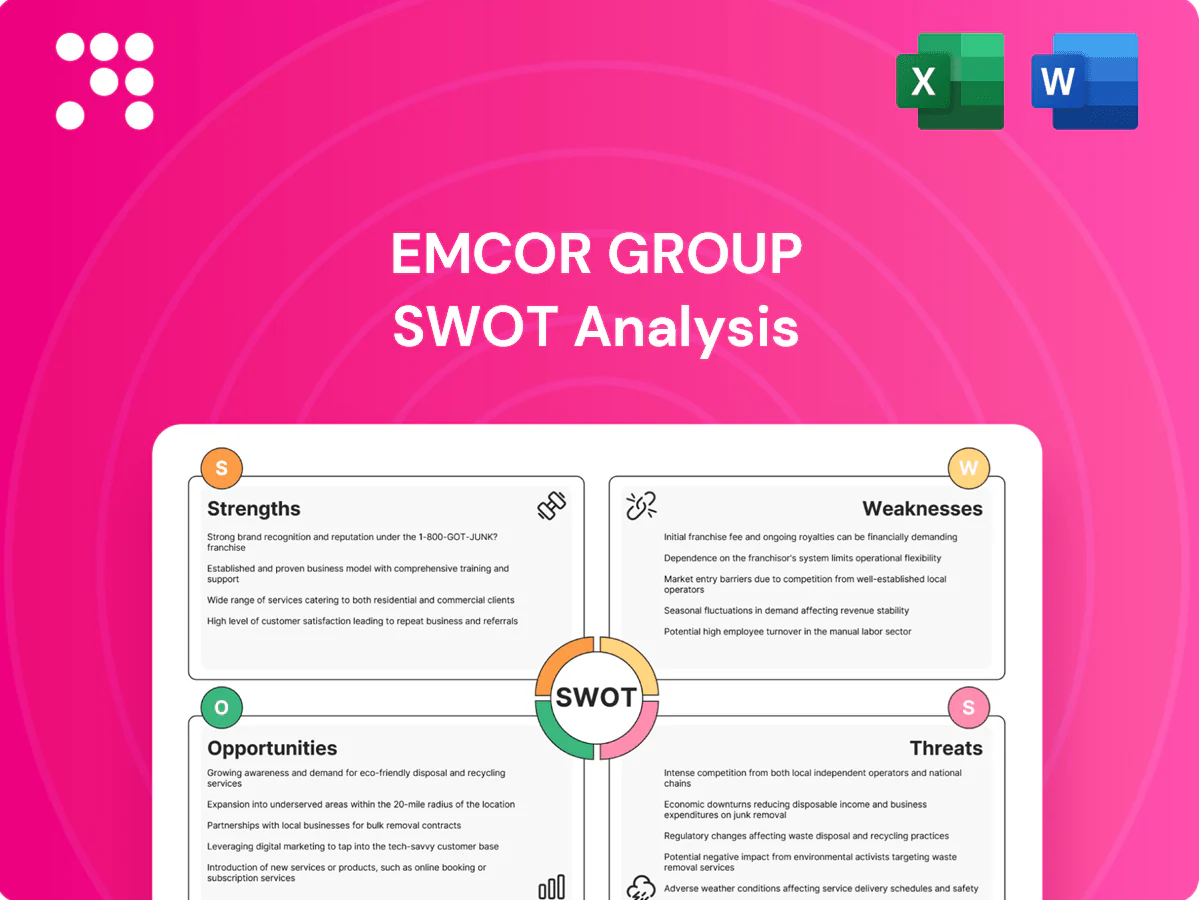
EMCOR Group SWOT Analysis

Your Strategic Toolkit Starts Here
EMCOR Group’s SWOT highlights robust scale and diversified service lines but also exposure to construction cyclicality and margin pressure; opportunities include tech-driven services and sustainable infrastructure. Want the full strategic picture with editable Word and Excel deliverables? Purchase the complete SWOT analysis to plan, pitch, or invest with confidence.
Strengths

Diversified service portfolio
EMCOR’s diversified portfolio across electrical, mechanical, facilities and energy infrastructure—driving over $10 billion in annual revenue—reduces reliance on any single stream and smooths cyclicality. Cross-disciplinary capability allows turnkey delivery on complex projects, differentiating EMCOR from niche contractors. This breadth enables effective cross-selling and deeper, multi-year client relationships.
End-market and client diversity
Serving commercial, industrial, utility and government sectors smooths demand volatility for EMCOR; government and utility work helped offset private-cycle softness during 2024. EMCOR reported 2024 revenue of $12.9 billion and a backlog near $6.1 billion, reducing concentration risk across clients. The broad client base enhances regional bid pipelines and supports stability across cycles.

Full lifecycle delivery
EMCORs design, install, operate and maintain model converts one-off construction into recurring revenue streams, leveraging the global facilities management market, valued at about 1.6 trillion USD in 2024, to expand O&M backlog. Lifecycle engagement raises switching costs and supports multi-year client retention. Stable O&M contracts smooth utilization and margins, while operational feedback loops improve delivery speed and reliability.

Scale and execution track record
EMCOR’s scale and execution track record suit large, complex MEP projects that demand tight coordination, safety and regulatory compliance; as a Fortune 500, publicly traded (NYSE: EME) contractor with national footprint, its proven delivery raises win rates on mission-critical work and lets it negotiate preferred vendor terms to improve cost and schedule performance.
- National footprint
- Fortune 500 / NYSE: EME
- Higher win rates on mission-critical bids
- Vendor leverage improves cost/schedule
- Brand credibility vs low-bid tenders
Safety and compliance culture
EMCORs entrenched safety and compliance culture reduces incident costs and project risk, making bids more competitive on high-stakes regulated and government work; consistent compliance improves insurability and bonding capacity and acts as a client selection differentiator for critical facilities.
- Lower project risk
- Enhanced insurability and bonding
- Competitive edge in regulated/government contracts
- Client preference for strong safety performance
Diversified MEP/FM: 2024 revenue $12.9B, backlog $6.1B
EMCOR’s diversified MEP and FM portfolio drove 2024 revenue of $12.9B with a backlog near $6.1B, reducing single-market risk. Turnkey lifecycle services convert projects into stable O&M revenue within the $1.6T global facilities market. Scale and safety culture boost win rates on mission-critical, regulated contracts and improve insurability and vendor leverage.
| Metric | 2024 |
|---|---|
| Revenue | $12.9B |
| Backlog | $6.1B |
| FM market | $1.6T |
What is included in the product
 Detailed Word Document
Provides a concise SWOT overview of EMCOR Group, highlighting internal strengths and weaknesses along with external opportunities and threats to inform strategic decision-making and assess competitive positioning.

 Customizable Excel Spreadsheet
Provides a concise SWOT matrix tailored to EMCOR Group for rapid strategic alignment, streamlined stakeholder presentations, and quick edits to reflect shifting operational priorities.
Weaknesses

Project cyclicality and backlog visibility
Construction revenues at EMCOR are lumpy, creating timing risk where project delays or cancellations can sharply reduce utilization and compress operating margins. Backlog provides partial visibility but does not fully hedge macro shocks or supply-chain disruptions. Large, multi-year contracts challenge forecasting precision, increasing quarter-to-quarter earnings volatility for the group.
Labor intensity and skilled-trades constraints
EMCOR's scale (≈$12.7B revenue in 2023) hinges on access to licensed electricians, HVAC techs and pipefitters. Tight U.S. construction labor markets—job openings near 400,000 in 2024—drove skilled-trades wage growth (~6%), raising turnover risk. Staffing gaps can delay schedules and erode quality, while certification and upskilling requirements increase overhead and add weeks to project ramp-up.

Margin pressure in competitive bidding
MEP scopes in hard-bid markets are highly price-sensitive and often commoditized, leaving EMCOR vulnerable to margin erosion when competitors undercut bids. Cost overruns and change-order disputes further compress margins and increase working capital needs. Where differentiation exists, clients do not always pay a premium, and a mix shift toward lower-margin service and small commercial projects depresses overall profitability.

Working capital and cash flow timing
Long pay cycles (commonly 60–90 days) and industry retainage (typically 5–10%) strain EMCOR’s working capital, while upfront mobilization and supplier payments precede collections. Fixed-price contracts amplify timing mismatches and margin risk. During revenue ramps the company increasingly leans on credit lines to bridge these gaps.
- pay-cycle:60–90 days
- retainage:5–10%
- upfront costs:mobilization & supply
- risk:greater reliance on credit lines
Supply chain and subcontractor dependencies
Supply chain bottlenecks—switchgear lead times of 16–30 weeks and chillers 12–26 weeks—can delay EMCOR schedules; controls lead times are also extended. Heavy reliance on subcontractors (commonly 50–70% of project cost) raises execution risk. Material price volatility (short-term swings up to ±15%) complicates estimating and hedging, and contract terms may not fully recover spikes.
- Lead times: switchgear 16–30w, chillers 12–26w
- Subcontractor exposure: ~50–70% of cost
- Material volatility: ±15% swings
- Contracts may not pass through short-term spikes
Lumpy revenue, trades shortages & subcontractor reliance press margins and cash flow
EMCOR's revenue (≈$12.7B in 2023) is lumpy, creating pronounced quarter-to-quarter earnings volatility from project delays or cancellations. Tight labor markets (U.S. skilled-trades openings ≈400,000 in 2024; wage inflation ~6%) and heavy subcontractor reliance raise execution and margin risk. Long pay cycles (60–90 days) and extended equipment lead times amplify working-capital strain and credit reliance.
| Metric | Value |
|---|---|
| Revenue (2023) | $12.7B |
| Skilled-trades openings (2024) | ≈400,000 |
| Pay cycle / Retainage | 60–90 days / 5–10% |
| Subcontractor % of cost | 50–70% |
| Switchgear / Chiller lead times | 16–30w / 12–26w |
Preview the Actual Deliverable
EMCOR Group SWOT Analysis
This is the actual EMCOR Group SWOT analysis document you’ll receive upon purchase—no surprises, just professional quality. The preview below is taken directly from the full SWOT report you'll get. Purchase unlocks the complete, editable version with in-depth strengths, weaknesses, opportunities and threats. The file shown is the real report available immediately after checkout.

Your Strategic Toolkit Starts Here
EMCOR Group’s SWOT highlights robust scale and diversified service lines but also exposure to construction cyclicality and margin pressure; opportunities include tech-driven services and sustainable infrastructure. Want the full strategic picture with editable Word and Excel deliverables? Purchase the complete SWOT analysis to plan, pitch, or invest with confidence.
Strengths
Diversified service portfolio
EMCOR’s diversified portfolio across electrical, mechanical, facilities and energy infrastructure—driving over $10 billion in annual revenue—reduces reliance on any single stream and smooths cyclicality. Cross-disciplinary capability allows turnkey delivery on complex projects, differentiating EMCOR from niche contractors. This breadth enables effective cross-selling and deeper, multi-year client relationships.
End-market and client diversity
Serving commercial, industrial, utility and government sectors smooths demand volatility for EMCOR; government and utility work helped offset private-cycle softness during 2024. EMCOR reported 2024 revenue of $12.9 billion and a backlog near $6.1 billion, reducing concentration risk across clients. The broad client base enhances regional bid pipelines and supports stability across cycles.
Full lifecycle delivery
EMCORs design, install, operate and maintain model converts one-off construction into recurring revenue streams, leveraging the global facilities management market, valued at about 1.6 trillion USD in 2024, to expand O&M backlog. Lifecycle engagement raises switching costs and supports multi-year client retention. Stable O&M contracts smooth utilization and margins, while operational feedback loops improve delivery speed and reliability.
Scale and execution track record
EMCOR’s scale and execution track record suit large, complex MEP projects that demand tight coordination, safety and regulatory compliance; as a Fortune 500, publicly traded (NYSE: EME) contractor with national footprint, its proven delivery raises win rates on mission-critical work and lets it negotiate preferred vendor terms to improve cost and schedule performance.
- National footprint
- Fortune 500 / NYSE: EME
- Higher win rates on mission-critical bids
- Vendor leverage improves cost/schedule
- Brand credibility vs low-bid tenders
Safety and compliance culture
EMCORs entrenched safety and compliance culture reduces incident costs and project risk, making bids more competitive on high-stakes regulated and government work; consistent compliance improves insurability and bonding capacity and acts as a client selection differentiator for critical facilities.
- Lower project risk
- Enhanced insurability and bonding
- Competitive edge in regulated/government contracts
- Client preference for strong safety performance
Diversified MEP/FM: 2024 revenue $12.9B, backlog $6.1B
EMCOR’s diversified MEP and FM portfolio drove 2024 revenue of $12.9B with a backlog near $6.1B, reducing single-market risk. Turnkey lifecycle services convert projects into stable O&M revenue within the $1.6T global facilities market. Scale and safety culture boost win rates on mission-critical, regulated contracts and improve insurability and vendor leverage.
| Metric | 2024 |
|---|---|
| Revenue | $12.9B |
| Backlog | $6.1B |
| FM market | $1.6T |
What is included in the product
Detailed Word Document
Provides a concise SWOT overview of EMCOR Group, highlighting internal strengths and weaknesses along with external opportunities and threats to inform strategic decision-making and assess competitive positioning.
Customizable Excel Spreadsheet
Provides a concise SWOT matrix tailored to EMCOR Group for rapid strategic alignment, streamlined stakeholder presentations, and quick edits to reflect shifting operational priorities.
Weaknesses
Project cyclicality and backlog visibility
Construction revenues at EMCOR are lumpy, creating timing risk where project delays or cancellations can sharply reduce utilization and compress operating margins. Backlog provides partial visibility but does not fully hedge macro shocks or supply-chain disruptions. Large, multi-year contracts challenge forecasting precision, increasing quarter-to-quarter earnings volatility for the group.
Labor intensity and skilled-trades constraints
EMCOR's scale (≈$12.7B revenue in 2023) hinges on access to licensed electricians, HVAC techs and pipefitters. Tight U.S. construction labor markets—job openings near 400,000 in 2024—drove skilled-trades wage growth (~6%), raising turnover risk. Staffing gaps can delay schedules and erode quality, while certification and upskilling requirements increase overhead and add weeks to project ramp-up.
Margin pressure in competitive bidding
MEP scopes in hard-bid markets are highly price-sensitive and often commoditized, leaving EMCOR vulnerable to margin erosion when competitors undercut bids. Cost overruns and change-order disputes further compress margins and increase working capital needs. Where differentiation exists, clients do not always pay a premium, and a mix shift toward lower-margin service and small commercial projects depresses overall profitability.
Working capital and cash flow timing
Long pay cycles (commonly 60–90 days) and industry retainage (typically 5–10%) strain EMCOR’s working capital, while upfront mobilization and supplier payments precede collections. Fixed-price contracts amplify timing mismatches and margin risk. During revenue ramps the company increasingly leans on credit lines to bridge these gaps.
- pay-cycle:60–90 days
- retainage:5–10%
- upfront costs:mobilization & supply
- risk:greater reliance on credit lines
Supply chain and subcontractor dependencies
Supply chain bottlenecks—switchgear lead times of 16–30 weeks and chillers 12–26 weeks—can delay EMCOR schedules; controls lead times are also extended. Heavy reliance on subcontractors (commonly 50–70% of project cost) raises execution risk. Material price volatility (short-term swings up to ±15%) complicates estimating and hedging, and contract terms may not fully recover spikes.
- Lead times: switchgear 16–30w, chillers 12–26w
- Subcontractor exposure: ~50–70% of cost
- Material volatility: ±15% swings
- Contracts may not pass through short-term spikes
Lumpy revenue, trades shortages & subcontractor reliance press margins and cash flow
EMCOR's revenue (≈$12.7B in 2023) is lumpy, creating pronounced quarter-to-quarter earnings volatility from project delays or cancellations. Tight labor markets (U.S. skilled-trades openings ≈400,000 in 2024; wage inflation ~6%) and heavy subcontractor reliance raise execution and margin risk. Long pay cycles (60–90 days) and extended equipment lead times amplify working-capital strain and credit reliance.
| Metric | Value |
|---|---|
| Revenue (2023) | $12.7B |
| Skilled-trades openings (2024) | ≈400,000 |
| Pay cycle / Retainage | 60–90 days / 5–10% |
| Subcontractor % of cost | 50–70% |
| Switchgear / Chiller lead times | 16–30w / 12–26w |
Preview the Actual Deliverable
EMCOR Group SWOT Analysis
This is the actual EMCOR Group SWOT analysis document you’ll receive upon purchase—no surprises, just professional quality. The preview below is taken directly from the full SWOT report you'll get. Purchase unlocks the complete, editable version with in-depth strengths, weaknesses, opportunities and threats. The file shown is the real report available immediately after checkout.
Original: $10.00
-65%$10.00
$3.50Description
Your Strategic Toolkit Starts Here
EMCOR Group’s SWOT highlights robust scale and diversified service lines but also exposure to construction cyclicality and margin pressure; opportunities include tech-driven services and sustainable infrastructure. Want the full strategic picture with editable Word and Excel deliverables? Purchase the complete SWOT analysis to plan, pitch, or invest with confidence.
Strengths
Diversified service portfolio
EMCOR’s diversified portfolio across electrical, mechanical, facilities and energy infrastructure—driving over $10 billion in annual revenue—reduces reliance on any single stream and smooths cyclicality. Cross-disciplinary capability allows turnkey delivery on complex projects, differentiating EMCOR from niche contractors. This breadth enables effective cross-selling and deeper, multi-year client relationships.
End-market and client diversity
Serving commercial, industrial, utility and government sectors smooths demand volatility for EMCOR; government and utility work helped offset private-cycle softness during 2024. EMCOR reported 2024 revenue of $12.9 billion and a backlog near $6.1 billion, reducing concentration risk across clients. The broad client base enhances regional bid pipelines and supports stability across cycles.
Full lifecycle delivery
EMCORs design, install, operate and maintain model converts one-off construction into recurring revenue streams, leveraging the global facilities management market, valued at about 1.6 trillion USD in 2024, to expand O&M backlog. Lifecycle engagement raises switching costs and supports multi-year client retention. Stable O&M contracts smooth utilization and margins, while operational feedback loops improve delivery speed and reliability.
Scale and execution track record
EMCOR’s scale and execution track record suit large, complex MEP projects that demand tight coordination, safety and regulatory compliance; as a Fortune 500, publicly traded (NYSE: EME) contractor with national footprint, its proven delivery raises win rates on mission-critical work and lets it negotiate preferred vendor terms to improve cost and schedule performance.
- National footprint
- Fortune 500 / NYSE: EME
- Higher win rates on mission-critical bids
- Vendor leverage improves cost/schedule
- Brand credibility vs low-bid tenders
Safety and compliance culture
EMCORs entrenched safety and compliance culture reduces incident costs and project risk, making bids more competitive on high-stakes regulated and government work; consistent compliance improves insurability and bonding capacity and acts as a client selection differentiator for critical facilities.
- Lower project risk
- Enhanced insurability and bonding
- Competitive edge in regulated/government contracts
- Client preference for strong safety performance
Diversified MEP/FM: 2024 revenue $12.9B, backlog $6.1B
EMCOR’s diversified MEP and FM portfolio drove 2024 revenue of $12.9B with a backlog near $6.1B, reducing single-market risk. Turnkey lifecycle services convert projects into stable O&M revenue within the $1.6T global facilities market. Scale and safety culture boost win rates on mission-critical, regulated contracts and improve insurability and vendor leverage.
| Metric | 2024 |
|---|---|
| Revenue | $12.9B |
| Backlog | $6.1B |
| FM market | $1.6T |
What is included in the product
Detailed Word Document
Provides a concise SWOT overview of EMCOR Group, highlighting internal strengths and weaknesses along with external opportunities and threats to inform strategic decision-making and assess competitive positioning.
Customizable Excel Spreadsheet
Provides a concise SWOT matrix tailored to EMCOR Group for rapid strategic alignment, streamlined stakeholder presentations, and quick edits to reflect shifting operational priorities.
Weaknesses
Project cyclicality and backlog visibility
Construction revenues at EMCOR are lumpy, creating timing risk where project delays or cancellations can sharply reduce utilization and compress operating margins. Backlog provides partial visibility but does not fully hedge macro shocks or supply-chain disruptions. Large, multi-year contracts challenge forecasting precision, increasing quarter-to-quarter earnings volatility for the group.
Labor intensity and skilled-trades constraints
EMCOR's scale (≈$12.7B revenue in 2023) hinges on access to licensed electricians, HVAC techs and pipefitters. Tight U.S. construction labor markets—job openings near 400,000 in 2024—drove skilled-trades wage growth (~6%), raising turnover risk. Staffing gaps can delay schedules and erode quality, while certification and upskilling requirements increase overhead and add weeks to project ramp-up.
Margin pressure in competitive bidding
MEP scopes in hard-bid markets are highly price-sensitive and often commoditized, leaving EMCOR vulnerable to margin erosion when competitors undercut bids. Cost overruns and change-order disputes further compress margins and increase working capital needs. Where differentiation exists, clients do not always pay a premium, and a mix shift toward lower-margin service and small commercial projects depresses overall profitability.
Working capital and cash flow timing
Long pay cycles (commonly 60–90 days) and industry retainage (typically 5–10%) strain EMCOR’s working capital, while upfront mobilization and supplier payments precede collections. Fixed-price contracts amplify timing mismatches and margin risk. During revenue ramps the company increasingly leans on credit lines to bridge these gaps.
- pay-cycle:60–90 days
- retainage:5–10%
- upfront costs:mobilization & supply
- risk:greater reliance on credit lines
Supply chain and subcontractor dependencies
Supply chain bottlenecks—switchgear lead times of 16–30 weeks and chillers 12–26 weeks—can delay EMCOR schedules; controls lead times are also extended. Heavy reliance on subcontractors (commonly 50–70% of project cost) raises execution risk. Material price volatility (short-term swings up to ±15%) complicates estimating and hedging, and contract terms may not fully recover spikes.
- Lead times: switchgear 16–30w, chillers 12–26w
- Subcontractor exposure: ~50–70% of cost
- Material volatility: ±15% swings
- Contracts may not pass through short-term spikes
Lumpy revenue, trades shortages & subcontractor reliance press margins and cash flow
EMCOR's revenue (≈$12.7B in 2023) is lumpy, creating pronounced quarter-to-quarter earnings volatility from project delays or cancellations. Tight labor markets (U.S. skilled-trades openings ≈400,000 in 2024; wage inflation ~6%) and heavy subcontractor reliance raise execution and margin risk. Long pay cycles (60–90 days) and extended equipment lead times amplify working-capital strain and credit reliance.
| Metric | Value |
|---|---|
| Revenue (2023) | $12.7B |
| Skilled-trades openings (2024) | ≈400,000 |
| Pay cycle / Retainage | 60–90 days / 5–10% |
| Subcontractor % of cost | 50–70% |
| Switchgear / Chiller lead times | 16–30w / 12–26w |
Preview the Actual Deliverable
EMCOR Group SWOT Analysis
This is the actual EMCOR Group SWOT analysis document you’ll receive upon purchase—no surprises, just professional quality. The preview below is taken directly from the full SWOT report you'll get. Purchase unlocks the complete, editable version with in-depth strengths, weaknesses, opportunities and threats. The file shown is the real report available immediately after checkout.











