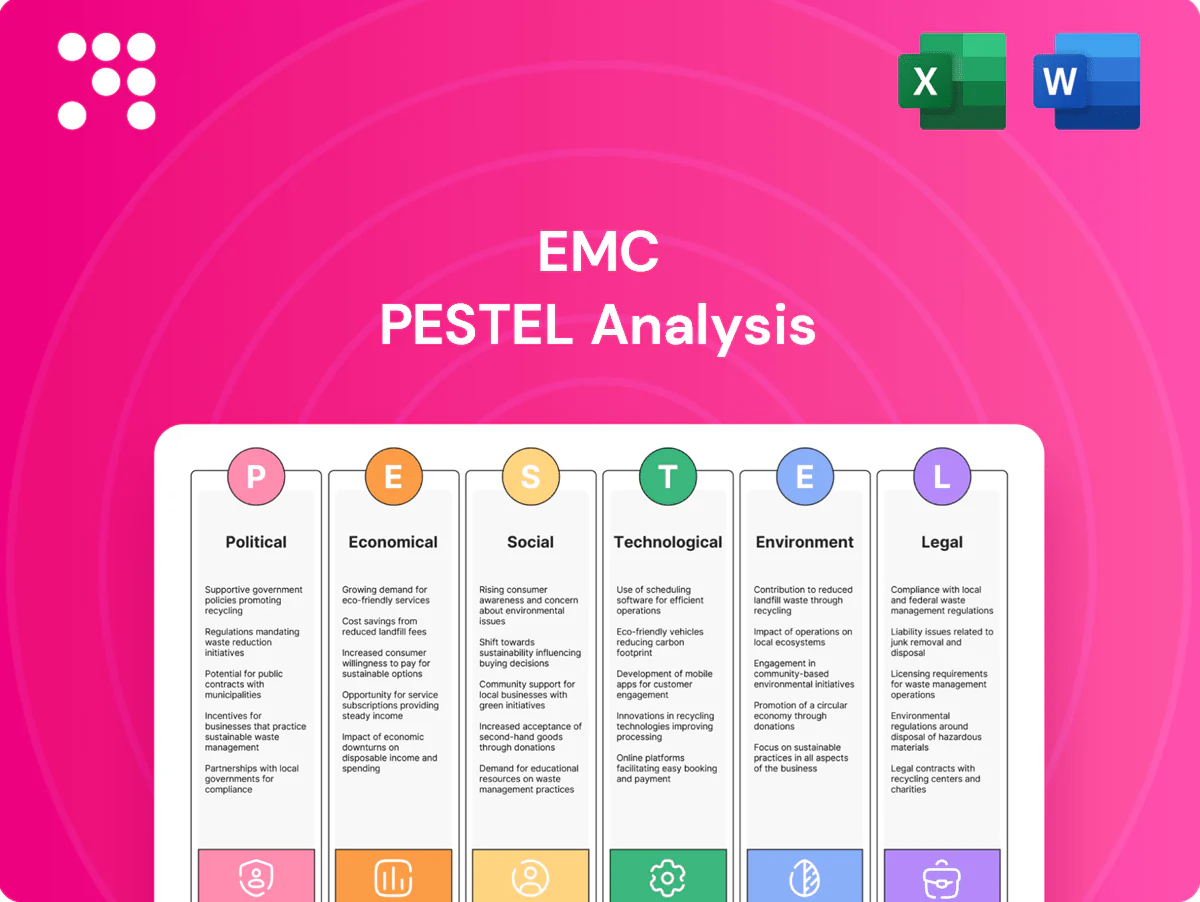
EMC PESTLE Analysis

Skip the Research. Get the Strategy.
Unlock how political, economic, social, technological, legal, and environmental forces are shaping EMC’s strategic outlook with our concise PESTLE snapshot—perfect for investors and strategists. Purchase the full, fully sourced analysis to access actionable insights, risk forecasts, and ready-to-use slides for decision-making.
Political factors

Taiwan geopolitics
Heightened cross-strait tensions threaten logistics, raise insurance premia and damp buyer risk appetite given Taiwan supplies roughly 60% of global advanced semiconductor capacity and TSMC holds >50% foundry market share. Contingency planning and multi-site production reduce single-point shocks and are increasingly adopted by OEMs. Taiwan raised its 2025 defense budget to about NT$695 billion (≈US$22.8B), while transparent communication and government alliances partially offset investor concerns.
Trade policy shifts
US export controls tightened in Oct 2022 and were expanded in Aug 2023 to cover advanced semiconductors and RF components, forcing licenses or market exits; tariffs from the 2018–19 US-China measures still impose rates up to 25% on many electronics, raising input and final pricing. Proactive HS classification, origin planning and bonded warehouses (EU average VAT ~21%) preserve margin by deferring duties and VAT. Diversifying end markets lowers reliance on any single regime and reduces policy concentration risk.

Industrial subsidies
Taiwan and partner governments offer targeted subsidies for advanced manufacturing, testing labs and R&D; the US CHIPS Act alone provides $52.7 billion in semiconductor incentives that accelerates capacity expansions and new EMC product lines. Capturing grants can cut capital timelines and de-risk launches, while compliance and local content rules (eligibility, sourcing thresholds) materially shape where investments land. Public-private projects and funded consortia drive EMC standardization leadership and interoperability adoption across supply chains.

Standards diplomacy
Participation in IEC/CISPR and regional EMC committees directly shapes future norms and lets firms influence technical requirements that affect products and supply chains.
Early insight from standards work shortens time-to-compliance for new filters and chokes, easing certification workflows and reducing redesign cycles; alignment with partner-country standards streamlines market entry across 27 EU member states. Thought leadership in standards development strengthens credibility with regulators and procurement bodies.
- Standards diplomacy: direct influence on technical norms
- Early insight: faster compliance, fewer redesigns
- Alignment: smoother entry into 27 EU markets
- Thought leadership: higher regulator credibility
Regional FTAs
Cross-strait tensions endanger supply of ~60% advanced semiconductors
Cross-strait tensions threaten logistics and insurance as Taiwan supplies ~60% of advanced semiconductors and TSMC >50% foundry share; Taiwan raised its 2025 defense budget to NT$695bn (~US$22.8bn). US export controls (Oct 2022, Aug 2023) and tariffs raise compliance costs while the CHIPS Act offers $52.7bn in incentives; RCEP covers ~30% global GDP.
| Item | Value |
|---|---|
| Taiwan advanced share | ~60% |
| TSMC foundry | >50% |
| Taiwan defense 2025 | NT$695bn (US$22.8bn) |
| CHIPS Act | $52.7bn |
| RCEP GDP | ~30% |
What is included in the product
 Detailed Word Document
Explores how external macro-environmental factors uniquely affect EMC across six dimensions—Political, Economic, Social, Technological, Environmental, and Legal—each backed by relevant data and current trends to reflect regional market and regulatory dynamics. Designed for executives and investors, the analysis is formatted for easy insertion into plans and includes forward-looking insights for scenario planning.

 Customizable Excel Spreadsheet
EMC PESTLE Analysis condenses external risks into a visually segmented, easy-to-share summary that speeds alignment across teams and supports risk discussions during planning; editable notes let users tailor insights to specific regions or business lines for immediate use in presentations and strategy sessions.
Economic factors

Semiconductor cycle
EMI/RF component demand closely tracks semiconductor production, with the global chip market recovering to roughly $600B in 2024, so downcycles compress pricing and inventory turns while upcycles pushed lead times above 20 weeks for many SKUs. Flexible capacity and VMI programs cut stockouts and working capital needs, often lowering inventory by ~20-30%. Diversified vertical exposure smooths revenue swings and reduces volatility.
FX exposure
Revenue invoiced in USD/EUR while costs sit in TWD/JPY/CNY drives material margin swings during FX moves, particularly when USD or EUR shift versus Asian currencies. Active hedging programs and natural offsets from regional sales reduce realized volatility. Index-linked pricing clauses (eg CPI or commodity indices) preserve gross margins in volatile months. Supplier contracts should align currency billing with sales mix to minimize translation and transaction risk.

Input costs
Copper, ferrites and specialty polymers drive BOM variability—LME copper averaged about $9,500/t in 2024, while ferrite and polymer spot shortages pushed component price swings of 8–15% in 2024–25. Long-term contracts and dual-sourcing have reduced input-price volatility for many EMC suppliers by roughly half year-over-year. Value engineering trimmed unit costs 5–12% without performance loss, and localization cut freight and tariff expenses by up to 30% for regional plants.

Customer capex
OEM investments in 5G, EVs and IoT lifted demand for EMC parts, with OEM capex across those segments up roughly 15% YoY in 2024 and EV sales near 14 million units, driving higher subsystem content per vehicle.
Intermittent budget freezes in 2024 delayed design-ins and NPI ramps, so design-win pipelines must broaden to absorb slippage and maintain revenue visibility.
Deeper co-development and supplier integration have raised attachment rates across programs, boosting per-program content but increasing exposure to single-program delays.
- OEM capex +15% YoY (2024)
- EV sales ~14M (2024)
- Wider design-win pipeline needed
- Co-development increases attachment rates
Price competition
High-volume commoditized parts face aggressive pricing from regional rivals, driving ASP erosion of roughly 10–18% YoY in 2024 for power/passive components. Differentiation via low DCR, higher current and compact footprints sustains ASPs with 8–20% premiums. Service levels and lab support justify 5–12% premium tiers. Cost roadmaps must outpace ~15% market erosion.
- ASPs down 10–18% YoY (2024)
- Differentiation premium 8–20%
- Service/lab premium 5–12%
- Target cost reduction >15% annually
Cross-strait tensions endanger supply of ~60% advanced semiconductors
Demand ties to semiconductor cycles (global chip market ~600B in 2024) causing lead-time and pricing swings; VMI/flexible capacity cut inventory ~20–30%. FX between USD/EUR and TWD/JPY/CNY drives margin volatility; hedging and index-linked clauses mitigate risk. Copper ~9,500/t (2024) and component spot swings 8–15% raised BOM pressure; ASPs fell 10–18% YoY, differentiation premiums 8–20%.
| Metric | 2024 | Impact |
|---|---|---|
| Global chip market | $600B | Demand driver |
| OEM capex | +15% YoY | Higher design-ins |
| EV sales | 14M units | More EMC content |
| LME copper | $9,500/t | BOM cost pressure |
| ASP erosion | 10–18% YoY | Margin risk |
| VMI inventory | −20–30% | Lower WC |
Full Version Awaits
EMC PESTLE Analysis
The preview shown here is the exact EMC PESTLE Analysis you’ll receive after purchase—fully formatted and ready to use. This file contains the complete political, economic, social, technological, legal, and environmental assessment as displayed, with no placeholders or teasers. After checkout you’ll be able to download this same finished document instantly. What you see is what you’ll own.

Skip the Research. Get the Strategy.
Unlock how political, economic, social, technological, legal, and environmental forces are shaping EMC’s strategic outlook with our concise PESTLE snapshot—perfect for investors and strategists. Purchase the full, fully sourced analysis to access actionable insights, risk forecasts, and ready-to-use slides for decision-making.
Political factors
Taiwan geopolitics
Heightened cross-strait tensions threaten logistics, raise insurance premia and damp buyer risk appetite given Taiwan supplies roughly 60% of global advanced semiconductor capacity and TSMC holds >50% foundry market share. Contingency planning and multi-site production reduce single-point shocks and are increasingly adopted by OEMs. Taiwan raised its 2025 defense budget to about NT$695 billion (≈US$22.8B), while transparent communication and government alliances partially offset investor concerns.
Trade policy shifts
US export controls tightened in Oct 2022 and were expanded in Aug 2023 to cover advanced semiconductors and RF components, forcing licenses or market exits; tariffs from the 2018–19 US-China measures still impose rates up to 25% on many electronics, raising input and final pricing. Proactive HS classification, origin planning and bonded warehouses (EU average VAT ~21%) preserve margin by deferring duties and VAT. Diversifying end markets lowers reliance on any single regime and reduces policy concentration risk.
Industrial subsidies
Taiwan and partner governments offer targeted subsidies for advanced manufacturing, testing labs and R&D; the US CHIPS Act alone provides $52.7 billion in semiconductor incentives that accelerates capacity expansions and new EMC product lines. Capturing grants can cut capital timelines and de-risk launches, while compliance and local content rules (eligibility, sourcing thresholds) materially shape where investments land. Public-private projects and funded consortia drive EMC standardization leadership and interoperability adoption across supply chains.
Standards diplomacy
Participation in IEC/CISPR and regional EMC committees directly shapes future norms and lets firms influence technical requirements that affect products and supply chains.
Early insight from standards work shortens time-to-compliance for new filters and chokes, easing certification workflows and reducing redesign cycles; alignment with partner-country standards streamlines market entry across 27 EU member states. Thought leadership in standards development strengthens credibility with regulators and procurement bodies.
- Standards diplomacy: direct influence on technical norms
- Early insight: faster compliance, fewer redesigns
- Alignment: smoother entry into 27 EU markets
- Thought leadership: higher regulator credibility
Regional FTAs
Cross-strait tensions endanger supply of ~60% advanced semiconductors
Cross-strait tensions threaten logistics and insurance as Taiwan supplies ~60% of advanced semiconductors and TSMC >50% foundry share; Taiwan raised its 2025 defense budget to NT$695bn (~US$22.8bn). US export controls (Oct 2022, Aug 2023) and tariffs raise compliance costs while the CHIPS Act offers $52.7bn in incentives; RCEP covers ~30% global GDP.
| Item | Value |
|---|---|
| Taiwan advanced share | ~60% |
| TSMC foundry | >50% |
| Taiwan defense 2025 | NT$695bn (US$22.8bn) |
| CHIPS Act | $52.7bn |
| RCEP GDP | ~30% |
What is included in the product
Detailed Word Document
Explores how external macro-environmental factors uniquely affect EMC across six dimensions—Political, Economic, Social, Technological, Environmental, and Legal—each backed by relevant data and current trends to reflect regional market and regulatory dynamics. Designed for executives and investors, the analysis is formatted for easy insertion into plans and includes forward-looking insights for scenario planning.
Customizable Excel Spreadsheet
EMC PESTLE Analysis condenses external risks into a visually segmented, easy-to-share summary that speeds alignment across teams and supports risk discussions during planning; editable notes let users tailor insights to specific regions or business lines for immediate use in presentations and strategy sessions.
Economic factors
Semiconductor cycle
EMI/RF component demand closely tracks semiconductor production, with the global chip market recovering to roughly $600B in 2024, so downcycles compress pricing and inventory turns while upcycles pushed lead times above 20 weeks for many SKUs. Flexible capacity and VMI programs cut stockouts and working capital needs, often lowering inventory by ~20-30%. Diversified vertical exposure smooths revenue swings and reduces volatility.
FX exposure
Revenue invoiced in USD/EUR while costs sit in TWD/JPY/CNY drives material margin swings during FX moves, particularly when USD or EUR shift versus Asian currencies. Active hedging programs and natural offsets from regional sales reduce realized volatility. Index-linked pricing clauses (eg CPI or commodity indices) preserve gross margins in volatile months. Supplier contracts should align currency billing with sales mix to minimize translation and transaction risk.
Input costs
Copper, ferrites and specialty polymers drive BOM variability—LME copper averaged about $9,500/t in 2024, while ferrite and polymer spot shortages pushed component price swings of 8–15% in 2024–25. Long-term contracts and dual-sourcing have reduced input-price volatility for many EMC suppliers by roughly half year-over-year. Value engineering trimmed unit costs 5–12% without performance loss, and localization cut freight and tariff expenses by up to 30% for regional plants.
Customer capex
OEM investments in 5G, EVs and IoT lifted demand for EMC parts, with OEM capex across those segments up roughly 15% YoY in 2024 and EV sales near 14 million units, driving higher subsystem content per vehicle.
Intermittent budget freezes in 2024 delayed design-ins and NPI ramps, so design-win pipelines must broaden to absorb slippage and maintain revenue visibility.
Deeper co-development and supplier integration have raised attachment rates across programs, boosting per-program content but increasing exposure to single-program delays.
- OEM capex +15% YoY (2024)
- EV sales ~14M (2024)
- Wider design-win pipeline needed
- Co-development increases attachment rates
Price competition
High-volume commoditized parts face aggressive pricing from regional rivals, driving ASP erosion of roughly 10–18% YoY in 2024 for power/passive components. Differentiation via low DCR, higher current and compact footprints sustains ASPs with 8–20% premiums. Service levels and lab support justify 5–12% premium tiers. Cost roadmaps must outpace ~15% market erosion.
- ASPs down 10–18% YoY (2024)
- Differentiation premium 8–20%
- Service/lab premium 5–12%
- Target cost reduction >15% annually
Cross-strait tensions endanger supply of ~60% advanced semiconductors
Demand ties to semiconductor cycles (global chip market ~600B in 2024) causing lead-time and pricing swings; VMI/flexible capacity cut inventory ~20–30%. FX between USD/EUR and TWD/JPY/CNY drives margin volatility; hedging and index-linked clauses mitigate risk. Copper ~9,500/t (2024) and component spot swings 8–15% raised BOM pressure; ASPs fell 10–18% YoY, differentiation premiums 8–20%.
| Metric | 2024 | Impact |
|---|---|---|
| Global chip market | $600B | Demand driver |
| OEM capex | +15% YoY | Higher design-ins |
| EV sales | 14M units | More EMC content |
| LME copper | $9,500/t | BOM cost pressure |
| ASP erosion | 10–18% YoY | Margin risk |
| VMI inventory | −20–30% | Lower WC |
Full Version Awaits
EMC PESTLE Analysis
The preview shown here is the exact EMC PESTLE Analysis you’ll receive after purchase—fully formatted and ready to use. This file contains the complete political, economic, social, technological, legal, and environmental assessment as displayed, with no placeholders or teasers. After checkout you’ll be able to download this same finished document instantly. What you see is what you’ll own.
Original: $10.00
-65%$10.00
$3.50Description
Skip the Research. Get the Strategy.
Unlock how political, economic, social, technological, legal, and environmental forces are shaping EMC’s strategic outlook with our concise PESTLE snapshot—perfect for investors and strategists. Purchase the full, fully sourced analysis to access actionable insights, risk forecasts, and ready-to-use slides for decision-making.
Political factors
Taiwan geopolitics
Heightened cross-strait tensions threaten logistics, raise insurance premia and damp buyer risk appetite given Taiwan supplies roughly 60% of global advanced semiconductor capacity and TSMC holds >50% foundry market share. Contingency planning and multi-site production reduce single-point shocks and are increasingly adopted by OEMs. Taiwan raised its 2025 defense budget to about NT$695 billion (≈US$22.8B), while transparent communication and government alliances partially offset investor concerns.
Trade policy shifts
US export controls tightened in Oct 2022 and were expanded in Aug 2023 to cover advanced semiconductors and RF components, forcing licenses or market exits; tariffs from the 2018–19 US-China measures still impose rates up to 25% on many electronics, raising input and final pricing. Proactive HS classification, origin planning and bonded warehouses (EU average VAT ~21%) preserve margin by deferring duties and VAT. Diversifying end markets lowers reliance on any single regime and reduces policy concentration risk.
Industrial subsidies
Taiwan and partner governments offer targeted subsidies for advanced manufacturing, testing labs and R&D; the US CHIPS Act alone provides $52.7 billion in semiconductor incentives that accelerates capacity expansions and new EMC product lines. Capturing grants can cut capital timelines and de-risk launches, while compliance and local content rules (eligibility, sourcing thresholds) materially shape where investments land. Public-private projects and funded consortia drive EMC standardization leadership and interoperability adoption across supply chains.
Standards diplomacy
Participation in IEC/CISPR and regional EMC committees directly shapes future norms and lets firms influence technical requirements that affect products and supply chains.
Early insight from standards work shortens time-to-compliance for new filters and chokes, easing certification workflows and reducing redesign cycles; alignment with partner-country standards streamlines market entry across 27 EU member states. Thought leadership in standards development strengthens credibility with regulators and procurement bodies.
- Standards diplomacy: direct influence on technical norms
- Early insight: faster compliance, fewer redesigns
- Alignment: smoother entry into 27 EU markets
- Thought leadership: higher regulator credibility
Regional FTAs
Cross-strait tensions endanger supply of ~60% advanced semiconductors
Cross-strait tensions threaten logistics and insurance as Taiwan supplies ~60% of advanced semiconductors and TSMC >50% foundry share; Taiwan raised its 2025 defense budget to NT$695bn (~US$22.8bn). US export controls (Oct 2022, Aug 2023) and tariffs raise compliance costs while the CHIPS Act offers $52.7bn in incentives; RCEP covers ~30% global GDP.
| Item | Value |
|---|---|
| Taiwan advanced share | ~60% |
| TSMC foundry | >50% |
| Taiwan defense 2025 | NT$695bn (US$22.8bn) |
| CHIPS Act | $52.7bn |
| RCEP GDP | ~30% |
What is included in the product
Detailed Word Document
Explores how external macro-environmental factors uniquely affect EMC across six dimensions—Political, Economic, Social, Technological, Environmental, and Legal—each backed by relevant data and current trends to reflect regional market and regulatory dynamics. Designed for executives and investors, the analysis is formatted for easy insertion into plans and includes forward-looking insights for scenario planning.
Customizable Excel Spreadsheet
EMC PESTLE Analysis condenses external risks into a visually segmented, easy-to-share summary that speeds alignment across teams and supports risk discussions during planning; editable notes let users tailor insights to specific regions or business lines for immediate use in presentations and strategy sessions.
Economic factors
Semiconductor cycle
EMI/RF component demand closely tracks semiconductor production, with the global chip market recovering to roughly $600B in 2024, so downcycles compress pricing and inventory turns while upcycles pushed lead times above 20 weeks for many SKUs. Flexible capacity and VMI programs cut stockouts and working capital needs, often lowering inventory by ~20-30%. Diversified vertical exposure smooths revenue swings and reduces volatility.
FX exposure
Revenue invoiced in USD/EUR while costs sit in TWD/JPY/CNY drives material margin swings during FX moves, particularly when USD or EUR shift versus Asian currencies. Active hedging programs and natural offsets from regional sales reduce realized volatility. Index-linked pricing clauses (eg CPI or commodity indices) preserve gross margins in volatile months. Supplier contracts should align currency billing with sales mix to minimize translation and transaction risk.
Input costs
Copper, ferrites and specialty polymers drive BOM variability—LME copper averaged about $9,500/t in 2024, while ferrite and polymer spot shortages pushed component price swings of 8–15% in 2024–25. Long-term contracts and dual-sourcing have reduced input-price volatility for many EMC suppliers by roughly half year-over-year. Value engineering trimmed unit costs 5–12% without performance loss, and localization cut freight and tariff expenses by up to 30% for regional plants.
Customer capex
OEM investments in 5G, EVs and IoT lifted demand for EMC parts, with OEM capex across those segments up roughly 15% YoY in 2024 and EV sales near 14 million units, driving higher subsystem content per vehicle.
Intermittent budget freezes in 2024 delayed design-ins and NPI ramps, so design-win pipelines must broaden to absorb slippage and maintain revenue visibility.
Deeper co-development and supplier integration have raised attachment rates across programs, boosting per-program content but increasing exposure to single-program delays.
- OEM capex +15% YoY (2024)
- EV sales ~14M (2024)
- Wider design-win pipeline needed
- Co-development increases attachment rates
Price competition
High-volume commoditized parts face aggressive pricing from regional rivals, driving ASP erosion of roughly 10–18% YoY in 2024 for power/passive components. Differentiation via low DCR, higher current and compact footprints sustains ASPs with 8–20% premiums. Service levels and lab support justify 5–12% premium tiers. Cost roadmaps must outpace ~15% market erosion.
- ASPs down 10–18% YoY (2024)
- Differentiation premium 8–20%
- Service/lab premium 5–12%
- Target cost reduction >15% annually
Cross-strait tensions endanger supply of ~60% advanced semiconductors
Demand ties to semiconductor cycles (global chip market ~600B in 2024) causing lead-time and pricing swings; VMI/flexible capacity cut inventory ~20–30%. FX between USD/EUR and TWD/JPY/CNY drives margin volatility; hedging and index-linked clauses mitigate risk. Copper ~9,500/t (2024) and component spot swings 8–15% raised BOM pressure; ASPs fell 10–18% YoY, differentiation premiums 8–20%.
| Metric | 2024 | Impact |
|---|---|---|
| Global chip market | $600B | Demand driver |
| OEM capex | +15% YoY | Higher design-ins |
| EV sales | 14M units | More EMC content |
| LME copper | $9,500/t | BOM cost pressure |
| ASP erosion | 10–18% YoY | Margin risk |
| VMI inventory | −20–30% | Lower WC |
Full Version Awaits
EMC PESTLE Analysis
The preview shown here is the exact EMC PESTLE Analysis you’ll receive after purchase—fully formatted and ready to use. This file contains the complete political, economic, social, technological, legal, and environmental assessment as displayed, with no placeholders or teasers. After checkout you’ll be able to download this same finished document instantly. What you see is what you’ll own.











