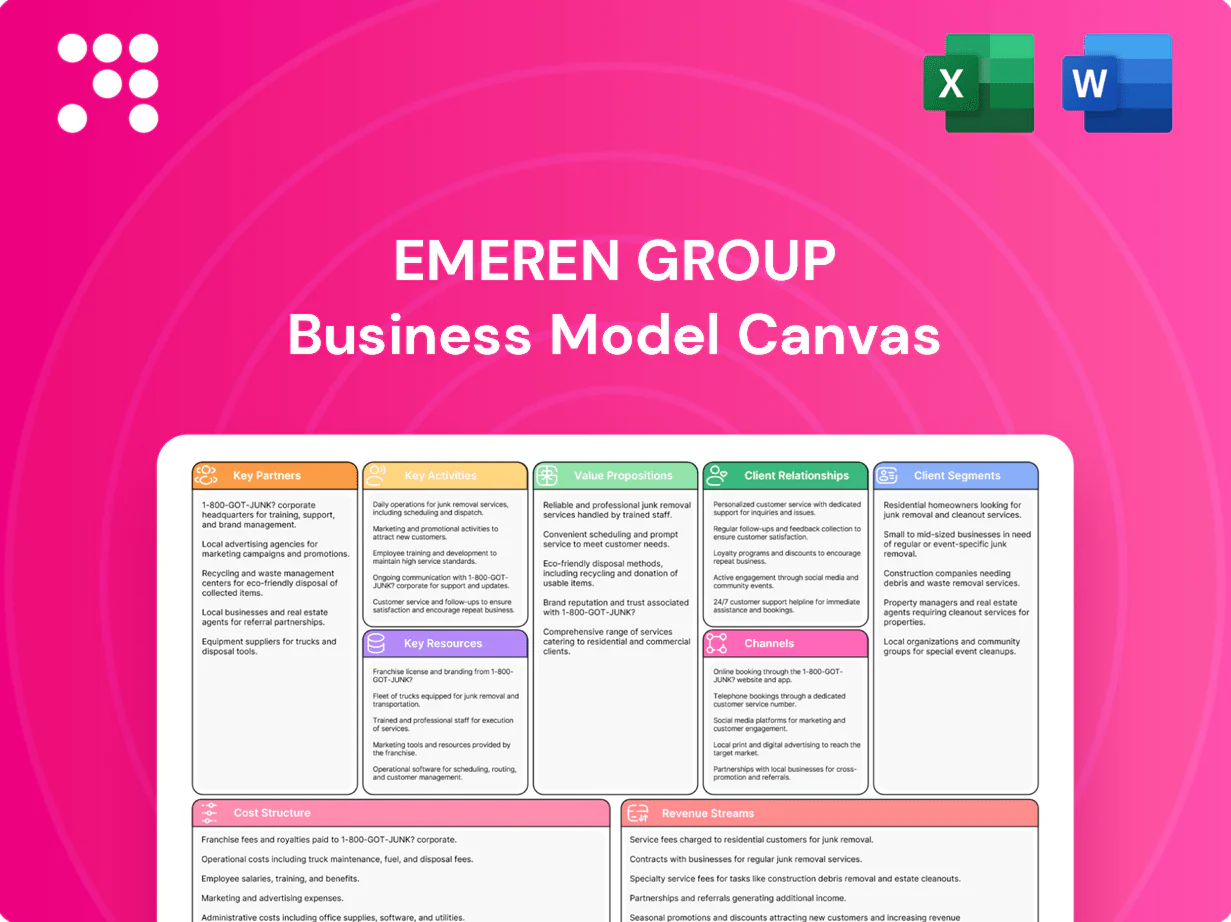
Emeren Group Business Model Canvas

Unlock the Business Model Canvas: value propositions, customers, partners, revenue
Unlock the full strategic blueprint behind Emeren Group’s Business Model Canvas—3–5 sentence snapshot revealing value propositions, customer segments, key partners, and revenue drivers. Perfect for investors and strategists, the downloadable Word & Excel files let you benchmark, adapt, and act—purchase the complete Canvas to access company-specific insights and tactical next steps.
Partnerships

Utility and grid operators
Partnering with transmission system operators and local utilities secures grid connection approvals and interconnection studies, addressing grid connection lead times that in some markets exceed 24 months (industry 2024 surveys).
These relationships enable curtailment management and grid stability for utility-scale plants, where curtailment in high-penetration regions has been measured in double digits (2024 reports).
They also facilitate PPAs and balancing services, and long-term cooperation demonstrably reduces grid access risk and timelines, often cutting permitting delays by months through coordinated planning (2024 industry data).
Landowners and real estate firms
Securing 20–25 year leases or purchase options is essential for project bankability and lender comfort; real estate partners source parcels with irradiance typically >5 kWh/m2/day and favourable permitting. Early land engagement cuts development risk, can lower interconnection delays (US queues averaged 2+ years in 2024) and supports clear land rights for financing and EPC execution.

EPC and O&M contractors
EPC partners deliver cost-effective builds on schedule, leveraging standardized design-to-delivery processes and 2024 procurement benchmarks. O&M providers ensure high availability, typically >98% uptime, with continuous performance monitoring and preventive maintenance. Standardized contracts improve quality and warranty outcomes and reduce disputes. Strategic alliances capture volume pricing and embed technical best practices across projects.

Equipment suppliers and OEMs
Tier-1 module, inverter and tracker suppliers provide bankable 25-year performance warranties and warranty-backed O&M frameworks; 2024 module ASPs averaged about 0.18 USD/W, stabilizing CAPEX forecasts for Emeren projects.
Framework agreements reduce procurement volatility, technology partners enable higher yields (bifacial+tracker lifts energy 10–20%), and joint pilots cut commissioning risk and speed adoption.
- Warranties: 25-year module power warranty
- Module ASP (2024): ~0.18 USD/W
- Yield uplift: bifacial+tracker 10–20%
- Inverter warranties: typically 10–12 years
Financiers and PPA offtakers
Banks, infrastructure funds and tax equity investors supply construction and long-term capital, with US tax equity supported by the 30% ITC (2024) framework; corporate and utility offtakers secure cash flows via PPAs and virtual PPAs. Structured finance can lower WACC by up to ~200 basis points and boost equity returns, while partner relationships broaden pipeline monetization across regions.
- Tax equity yields: 6–8% (market range)
- ITC: 30% (2024)
- WACC reduction: up to ~200 bps
- Monetization: PPAs, virtual PPAs, securitization, green bonds
Alliances de-risk interconnection, shorten US queues to 24+ months
Emeren's key partnerships with TSOs/utilities, landowners, EPCs, tier-1 suppliers and financiers de-risk interconnection, permitting and financing, cutting lead times (US queues 2024: ~24+ months) and stabilizing CAPEX (module ASP 2024: 0.18 USD/W). These alliances enable 20–25y leases, >98% availability and WACC reduction up to ~200 bps.
| Metric | 2024 |
|---|---|
| Module ASP | 0.18 USD/W |
| US queue | 24+ months |
| Availability | >98% |
| WACC cut | ~200 bps |
What is included in the product
 Detailed Word Document
A concise, pre-written Business Model Canvas for Emeren Group detailing nine BMC blocks—customer segments, value propositions, channels, customer relationships, revenue streams, key resources, key activities, key partners, and cost structure—with actionable insights and competitive analysis. Ideal for investor presentations, strategic planning, and validating growth opportunities using real-world operational context.

 Customizable Excel Spreadsheet
High-level view of Emeren Group’s business model with editable cells, quickly identifying core components to relieve the pain of scattered strategy documents and save hours of formatting and structuring your own model.
Activities

Project development and permitting
Sourcing sites, conducting feasibility and securing land rights underpin Emeren Group projects, with targeted site control ahead of permitting; US interconnection queues exceeded about 1.2 TW in 2024, highlighting queue risk. Environmental, interconnection and planning permits are coordinated across jurisdictions, often spanning 6–24 months. Proactive stakeholder engagement de-risks approval timelines and optimized layouts can boost energy yield and bankability by several percent.
Financing and capital structuring
Arranging construction loans, tax equity (US tax-equity market ~15 billion USD in 2023) and long-term project debt aligns risk and return by matching tenor and cashflow profiles to asset life.
Hedging strategies (forward power and commodity collars) stabilize revenues and input costs against market swings while financial modeling (sensitivity, Monte Carlo) drives go/no-go thresholds.
Active capital recycling—selling operational assets into yield-focused buyers—releases capital to fund new growth and improve portfolio IRR.

EPC oversight and construction
Managing EPC partners ensures quality, cost and schedule control through strict KPIs and progress monitoring; owner’s engineering validates designs and equipment selection to meet specifications; on-site HSE compliance enforces LTIFR and permit-to-work regimes; commissioning verifies performance guarantees (eg availability and output benchmarks, commonly >95%) in 2024 project handovers.

Asset management and O&M
Monitoring plant performance maximizes availability and energy yield, supporting industry targets above 98% availability; predictive maintenance and active warranty management preserve uptime using 25-year module performance warranties and OEM service agreements; revenue assurance handles invoicing, market settlements and curtailment claims to protect cashflows; lifecycle optimization informs repowering and CAPEX timing decisions.
- Monitoring: availability >98%
- Predictive maintenance: uptime protection
- Warranty management: 25-year module warranties
- Revenue assurance: invoicing, settlements, curtailment claims
- Lifecycle optimization: repowering decisions
PPA origination and energy sales
Negotiating PPAs with utilities and corporates secures long-term cash flows via typical tenors of 10–15 years; merchant exposure is managed through financial hedges or short-term market sales; rigorous credit vetting reduces counterparty risk; contracts are structured to meet financing metrics such as DSCR targets around 1.2–1.4 and tenor alignment with lenders.
- Long-term cash: 10–15y PPAs
- Merchant mitigants: hedges/market sales
- Credit vetting: lowers counterparty default risk
- Financing fit: DSCR ~1.2–1.4, tenor alignment
Secure sites in US queues >1.2 TW; permits 6–24 months; PPAs 10–15y
Sourcing, permitting and stakeholder engagement secure sites amid US interconnection queues >1.2 TW (2024); feasibility and land rights precede permits (6–24 months). Capital structuring uses construction loans, tax equity (~15bn USD market 2023) and long-term debt; PPAs 10–15y with DSCR targets ~1.2–1.4. O&M focuses on >98% availability, predictive maintenance, 25-year warranties and active revenue assurance.
| Metric | Value |
|---|---|
| Interconnection queue (US) | >1.2 TW (2024) |
| Tax-equity market | ~15 bn USD (2023) |
| Availability target | >98% |
| PPA tenor | 10–15 years |
| DSCR target | 1.2–1.4 |
Preview Before You Purchase
Business Model Canvas
The document you're previewing is the exact Emeren Group Business Model Canvas you'll receive after purchase. It's not a mockup—it's a complete, professionally formatted canvas ready for editing and presentation. After payment you'll get this same file in Word and Excel formats with all content included, no surprises.

Unlock the Business Model Canvas: value propositions, customers, partners, revenue
Unlock the full strategic blueprint behind Emeren Group’s Business Model Canvas—3–5 sentence snapshot revealing value propositions, customer segments, key partners, and revenue drivers. Perfect for investors and strategists, the downloadable Word & Excel files let you benchmark, adapt, and act—purchase the complete Canvas to access company-specific insights and tactical next steps.
Partnerships
Utility and grid operators
Partnering with transmission system operators and local utilities secures grid connection approvals and interconnection studies, addressing grid connection lead times that in some markets exceed 24 months (industry 2024 surveys).
These relationships enable curtailment management and grid stability for utility-scale plants, where curtailment in high-penetration regions has been measured in double digits (2024 reports).
They also facilitate PPAs and balancing services, and long-term cooperation demonstrably reduces grid access risk and timelines, often cutting permitting delays by months through coordinated planning (2024 industry data).
Landowners and real estate firms
Securing 20–25 year leases or purchase options is essential for project bankability and lender comfort; real estate partners source parcels with irradiance typically >5 kWh/m2/day and favourable permitting. Early land engagement cuts development risk, can lower interconnection delays (US queues averaged 2+ years in 2024) and supports clear land rights for financing and EPC execution.
EPC and O&M contractors
EPC partners deliver cost-effective builds on schedule, leveraging standardized design-to-delivery processes and 2024 procurement benchmarks. O&M providers ensure high availability, typically >98% uptime, with continuous performance monitoring and preventive maintenance. Standardized contracts improve quality and warranty outcomes and reduce disputes. Strategic alliances capture volume pricing and embed technical best practices across projects.
Equipment suppliers and OEMs
Tier-1 module, inverter and tracker suppliers provide bankable 25-year performance warranties and warranty-backed O&M frameworks; 2024 module ASPs averaged about 0.18 USD/W, stabilizing CAPEX forecasts for Emeren projects.
Framework agreements reduce procurement volatility, technology partners enable higher yields (bifacial+tracker lifts energy 10–20%), and joint pilots cut commissioning risk and speed adoption.
- Warranties: 25-year module power warranty
- Module ASP (2024): ~0.18 USD/W
- Yield uplift: bifacial+tracker 10–20%
- Inverter warranties: typically 10–12 years
Financiers and PPA offtakers
Banks, infrastructure funds and tax equity investors supply construction and long-term capital, with US tax equity supported by the 30% ITC (2024) framework; corporate and utility offtakers secure cash flows via PPAs and virtual PPAs. Structured finance can lower WACC by up to ~200 basis points and boost equity returns, while partner relationships broaden pipeline monetization across regions.
- Tax equity yields: 6–8% (market range)
- ITC: 30% (2024)
- WACC reduction: up to ~200 bps
- Monetization: PPAs, virtual PPAs, securitization, green bonds
Alliances de-risk interconnection, shorten US queues to 24+ months
Emeren's key partnerships with TSOs/utilities, landowners, EPCs, tier-1 suppliers and financiers de-risk interconnection, permitting and financing, cutting lead times (US queues 2024: ~24+ months) and stabilizing CAPEX (module ASP 2024: 0.18 USD/W). These alliances enable 20–25y leases, >98% availability and WACC reduction up to ~200 bps.
| Metric | 2024 |
|---|---|
| Module ASP | 0.18 USD/W |
| US queue | 24+ months |
| Availability | >98% |
| WACC cut | ~200 bps |
What is included in the product
Detailed Word Document
A concise, pre-written Business Model Canvas for Emeren Group detailing nine BMC blocks—customer segments, value propositions, channels, customer relationships, revenue streams, key resources, key activities, key partners, and cost structure—with actionable insights and competitive analysis. Ideal for investor presentations, strategic planning, and validating growth opportunities using real-world operational context.
Customizable Excel Spreadsheet
High-level view of Emeren Group’s business model with editable cells, quickly identifying core components to relieve the pain of scattered strategy documents and save hours of formatting and structuring your own model.
Activities
Project development and permitting
Sourcing sites, conducting feasibility and securing land rights underpin Emeren Group projects, with targeted site control ahead of permitting; US interconnection queues exceeded about 1.2 TW in 2024, highlighting queue risk. Environmental, interconnection and planning permits are coordinated across jurisdictions, often spanning 6–24 months. Proactive stakeholder engagement de-risks approval timelines and optimized layouts can boost energy yield and bankability by several percent.
Financing and capital structuring
Arranging construction loans, tax equity (US tax-equity market ~15 billion USD in 2023) and long-term project debt aligns risk and return by matching tenor and cashflow profiles to asset life.
Hedging strategies (forward power and commodity collars) stabilize revenues and input costs against market swings while financial modeling (sensitivity, Monte Carlo) drives go/no-go thresholds.
Active capital recycling—selling operational assets into yield-focused buyers—releases capital to fund new growth and improve portfolio IRR.
EPC oversight and construction
Managing EPC partners ensures quality, cost and schedule control through strict KPIs and progress monitoring; owner’s engineering validates designs and equipment selection to meet specifications; on-site HSE compliance enforces LTIFR and permit-to-work regimes; commissioning verifies performance guarantees (eg availability and output benchmarks, commonly >95%) in 2024 project handovers.
Asset management and O&M
Monitoring plant performance maximizes availability and energy yield, supporting industry targets above 98% availability; predictive maintenance and active warranty management preserve uptime using 25-year module performance warranties and OEM service agreements; revenue assurance handles invoicing, market settlements and curtailment claims to protect cashflows; lifecycle optimization informs repowering and CAPEX timing decisions.
- Monitoring: availability >98%
- Predictive maintenance: uptime protection
- Warranty management: 25-year module warranties
- Revenue assurance: invoicing, settlements, curtailment claims
- Lifecycle optimization: repowering decisions
PPA origination and energy sales
Negotiating PPAs with utilities and corporates secures long-term cash flows via typical tenors of 10–15 years; merchant exposure is managed through financial hedges or short-term market sales; rigorous credit vetting reduces counterparty risk; contracts are structured to meet financing metrics such as DSCR targets around 1.2–1.4 and tenor alignment with lenders.
- Long-term cash: 10–15y PPAs
- Merchant mitigants: hedges/market sales
- Credit vetting: lowers counterparty default risk
- Financing fit: DSCR ~1.2–1.4, tenor alignment
Secure sites in US queues >1.2 TW; permits 6–24 months; PPAs 10–15y
Sourcing, permitting and stakeholder engagement secure sites amid US interconnection queues >1.2 TW (2024); feasibility and land rights precede permits (6–24 months). Capital structuring uses construction loans, tax equity (~15bn USD market 2023) and long-term debt; PPAs 10–15y with DSCR targets ~1.2–1.4. O&M focuses on >98% availability, predictive maintenance, 25-year warranties and active revenue assurance.
| Metric | Value |
|---|---|
| Interconnection queue (US) | >1.2 TW (2024) |
| Tax-equity market | ~15 bn USD (2023) |
| Availability target | >98% |
| PPA tenor | 10–15 years |
| DSCR target | 1.2–1.4 |
Preview Before You Purchase
Business Model Canvas
The document you're previewing is the exact Emeren Group Business Model Canvas you'll receive after purchase. It's not a mockup—it's a complete, professionally formatted canvas ready for editing and presentation. After payment you'll get this same file in Word and Excel formats with all content included, no surprises.
Original: $10.00
-65%$10.00
$3.50Description
Unlock the Business Model Canvas: value propositions, customers, partners, revenue
Unlock the full strategic blueprint behind Emeren Group’s Business Model Canvas—3–5 sentence snapshot revealing value propositions, customer segments, key partners, and revenue drivers. Perfect for investors and strategists, the downloadable Word & Excel files let you benchmark, adapt, and act—purchase the complete Canvas to access company-specific insights and tactical next steps.
Partnerships
Utility and grid operators
Partnering with transmission system operators and local utilities secures grid connection approvals and interconnection studies, addressing grid connection lead times that in some markets exceed 24 months (industry 2024 surveys).
These relationships enable curtailment management and grid stability for utility-scale plants, where curtailment in high-penetration regions has been measured in double digits (2024 reports).
They also facilitate PPAs and balancing services, and long-term cooperation demonstrably reduces grid access risk and timelines, often cutting permitting delays by months through coordinated planning (2024 industry data).
Landowners and real estate firms
Securing 20–25 year leases or purchase options is essential for project bankability and lender comfort; real estate partners source parcels with irradiance typically >5 kWh/m2/day and favourable permitting. Early land engagement cuts development risk, can lower interconnection delays (US queues averaged 2+ years in 2024) and supports clear land rights for financing and EPC execution.
EPC and O&M contractors
EPC partners deliver cost-effective builds on schedule, leveraging standardized design-to-delivery processes and 2024 procurement benchmarks. O&M providers ensure high availability, typically >98% uptime, with continuous performance monitoring and preventive maintenance. Standardized contracts improve quality and warranty outcomes and reduce disputes. Strategic alliances capture volume pricing and embed technical best practices across projects.
Equipment suppliers and OEMs
Tier-1 module, inverter and tracker suppliers provide bankable 25-year performance warranties and warranty-backed O&M frameworks; 2024 module ASPs averaged about 0.18 USD/W, stabilizing CAPEX forecasts for Emeren projects.
Framework agreements reduce procurement volatility, technology partners enable higher yields (bifacial+tracker lifts energy 10–20%), and joint pilots cut commissioning risk and speed adoption.
- Warranties: 25-year module power warranty
- Module ASP (2024): ~0.18 USD/W
- Yield uplift: bifacial+tracker 10–20%
- Inverter warranties: typically 10–12 years
Financiers and PPA offtakers
Banks, infrastructure funds and tax equity investors supply construction and long-term capital, with US tax equity supported by the 30% ITC (2024) framework; corporate and utility offtakers secure cash flows via PPAs and virtual PPAs. Structured finance can lower WACC by up to ~200 basis points and boost equity returns, while partner relationships broaden pipeline monetization across regions.
- Tax equity yields: 6–8% (market range)
- ITC: 30% (2024)
- WACC reduction: up to ~200 bps
- Monetization: PPAs, virtual PPAs, securitization, green bonds
Alliances de-risk interconnection, shorten US queues to 24+ months
Emeren's key partnerships with TSOs/utilities, landowners, EPCs, tier-1 suppliers and financiers de-risk interconnection, permitting and financing, cutting lead times (US queues 2024: ~24+ months) and stabilizing CAPEX (module ASP 2024: 0.18 USD/W). These alliances enable 20–25y leases, >98% availability and WACC reduction up to ~200 bps.
| Metric | 2024 |
|---|---|
| Module ASP | 0.18 USD/W |
| US queue | 24+ months |
| Availability | >98% |
| WACC cut | ~200 bps |
What is included in the product
Detailed Word Document
A concise, pre-written Business Model Canvas for Emeren Group detailing nine BMC blocks—customer segments, value propositions, channels, customer relationships, revenue streams, key resources, key activities, key partners, and cost structure—with actionable insights and competitive analysis. Ideal for investor presentations, strategic planning, and validating growth opportunities using real-world operational context.
Customizable Excel Spreadsheet
High-level view of Emeren Group’s business model with editable cells, quickly identifying core components to relieve the pain of scattered strategy documents and save hours of formatting and structuring your own model.
Activities
Project development and permitting
Sourcing sites, conducting feasibility and securing land rights underpin Emeren Group projects, with targeted site control ahead of permitting; US interconnection queues exceeded about 1.2 TW in 2024, highlighting queue risk. Environmental, interconnection and planning permits are coordinated across jurisdictions, often spanning 6–24 months. Proactive stakeholder engagement de-risks approval timelines and optimized layouts can boost energy yield and bankability by several percent.
Financing and capital structuring
Arranging construction loans, tax equity (US tax-equity market ~15 billion USD in 2023) and long-term project debt aligns risk and return by matching tenor and cashflow profiles to asset life.
Hedging strategies (forward power and commodity collars) stabilize revenues and input costs against market swings while financial modeling (sensitivity, Monte Carlo) drives go/no-go thresholds.
Active capital recycling—selling operational assets into yield-focused buyers—releases capital to fund new growth and improve portfolio IRR.
EPC oversight and construction
Managing EPC partners ensures quality, cost and schedule control through strict KPIs and progress monitoring; owner’s engineering validates designs and equipment selection to meet specifications; on-site HSE compliance enforces LTIFR and permit-to-work regimes; commissioning verifies performance guarantees (eg availability and output benchmarks, commonly >95%) in 2024 project handovers.
Asset management and O&M
Monitoring plant performance maximizes availability and energy yield, supporting industry targets above 98% availability; predictive maintenance and active warranty management preserve uptime using 25-year module performance warranties and OEM service agreements; revenue assurance handles invoicing, market settlements and curtailment claims to protect cashflows; lifecycle optimization informs repowering and CAPEX timing decisions.
- Monitoring: availability >98%
- Predictive maintenance: uptime protection
- Warranty management: 25-year module warranties
- Revenue assurance: invoicing, settlements, curtailment claims
- Lifecycle optimization: repowering decisions
PPA origination and energy sales
Negotiating PPAs with utilities and corporates secures long-term cash flows via typical tenors of 10–15 years; merchant exposure is managed through financial hedges or short-term market sales; rigorous credit vetting reduces counterparty risk; contracts are structured to meet financing metrics such as DSCR targets around 1.2–1.4 and tenor alignment with lenders.
- Long-term cash: 10–15y PPAs
- Merchant mitigants: hedges/market sales
- Credit vetting: lowers counterparty default risk
- Financing fit: DSCR ~1.2–1.4, tenor alignment
Secure sites in US queues >1.2 TW; permits 6–24 months; PPAs 10–15y
Sourcing, permitting and stakeholder engagement secure sites amid US interconnection queues >1.2 TW (2024); feasibility and land rights precede permits (6–24 months). Capital structuring uses construction loans, tax equity (~15bn USD market 2023) and long-term debt; PPAs 10–15y with DSCR targets ~1.2–1.4. O&M focuses on >98% availability, predictive maintenance, 25-year warranties and active revenue assurance.
| Metric | Value |
|---|---|
| Interconnection queue (US) | >1.2 TW (2024) |
| Tax-equity market | ~15 bn USD (2023) |
| Availability target | >98% |
| PPA tenor | 10–15 years |
| DSCR target | 1.2–1.4 |
Preview Before You Purchase
Business Model Canvas
The document you're previewing is the exact Emeren Group Business Model Canvas you'll receive after purchase. It's not a mockup—it's a complete, professionally formatted canvas ready for editing and presentation. After payment you'll get this same file in Word and Excel formats with all content included, no surprises.











