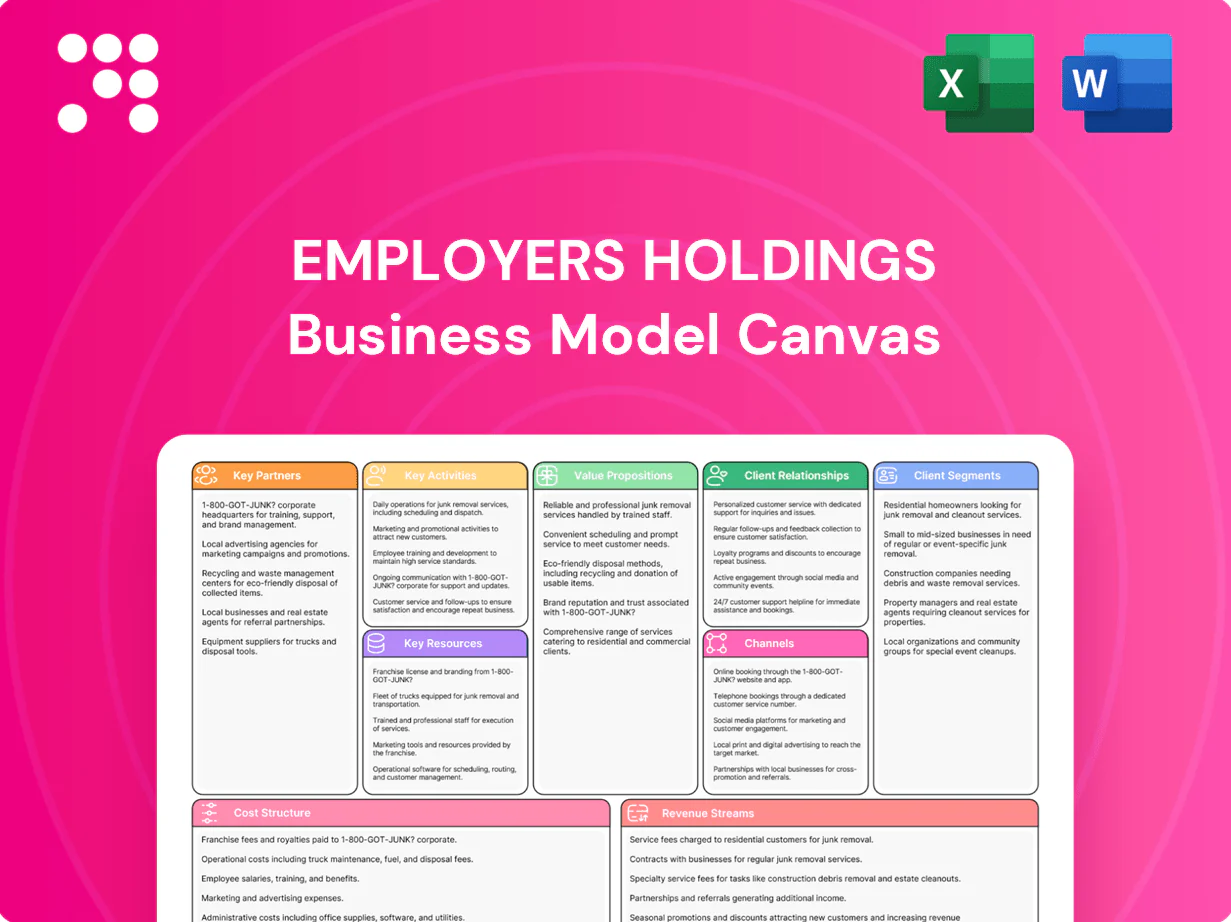
Employers Holdings Business Model Canvas

Business Model Canvas for a Specialty Insurer - Value, Customers & Revenue Mechanics
Unlock the strategic blueprint of Employers Holdings with our concise Business Model Canvas—three to five clear sentences that map value propositions, customer segments, and revenue mechanics. Dive deeper by purchasing the full Canvas to get a section-by-section breakdown, financial implications, and editable Word/Excel files. Ideal for investors, strategists, and consultants seeking actionable, ready-to-use insights.
Partnerships

Independent agents
Distribution relies on appointed independent agents and brokers who bring targeted small-business accounts, with 2024 industry data showing independent agents handle roughly 70% of small-commercial distribution.
They provide local market knowledge and pre-qualify risks, improving underwriting efficiency and lowering acquisition costs.
Strong agency relationships raise submission quality and bind ratios, driving higher retention and lower loss-adjusted expense ratios.
Tiered incentive plans align agent growth with company profitability targets, boosting profitable new business.
Reinsurers
Quota-share and excess-of-loss reinsurance partners stabilize Employers Holdings earnings and capital by ceding risk and smoothing loss volatility; the 2024 reinsurance market remained relatively tight following recent catastrophe years. These partners limit peak-loss exposure and geographic concentration, while reinsurer analytics in 2024 increasingly informed underwriting guidelines and risk selection. Contract terms determine ceded capacity and pricing flexibility, directly impacting underwriting leverage and product pricing.

Medical networks
Preferred provider organizations and pharmacy benefit managers lower medical costs—PPO discounts average 15–25% and PBMs delivered net drug savings around 20% in 2024. Network discounts and utilization controls have improved loss ratios by 5–10%. Coordinated care shortens claim duration and speeds return-to-work, reducing disability days by ~25%. Data sharing and analytics cut medical spend and improve outcomes by 10–15%.

Regulators & rating bureaus
Partnerships with state DOI offices, NCCI, and independent rating bureaus ensure Employers Holdings meets regulatory requirements and maintains market access; as of 2024 NCCI serves 38 states plus DC, supplying standardized loss-costs and class codes that underpin pricing and reserving. Collaborative filings streamline rates, rules, and forms, while proactive engagement cuts regulatory friction and approval delays.
- Compliance alignment with state DOIs and rating bureaus
- Access to NCCI loss-costs and class codes (38 states + DC)
- Filing collaboration accelerates rate/form approvals
Technology & data vendors
Technology and data vendors power Employers Holdings underwriting and claims workflows, with core systems, analytics, and external feeds (telematics, payroll, credit proxies) enhancing risk selection and pricing as of 2024. Automation partners drive straight-through processing and reduced manual touchpoints, while cybersecurity vendors secure sensitive policyholder and claimant data.
- core-systems
- analytics-data
- telematics-payroll
- automation-stp
- cybersecurity
70% agents, reinsurance stabilizes capital, PPO/PBM cut medical spend
Distribution: independent agents handle ~70% of small-commercial distribution in 2024, improving targeted acquisition and bind ratios.
Reinsurance: quota-share/excess-of-loss partners stabilize capital amid a tight 2024 market, limiting peak-loss and smoothing earnings.
Medical networks/PBMs: PPO discounts 15–25% and PBM net savings ~20% cut medical spend and improve loss ratios 5–10% in 2024.
Regulatory/tech: NCCI (38 states + DC), core systems, analytics and cybersecurity underpin pricing, underwriting and compliance.
| Metric | 2024 |
|---|---|
| Independent agents | 70% |
| NCCI coverage | 38 states + DC |
| PPO discount | 15–25% |
| PBM net savings | ~20% |
| Loss ratio improvement | 5–10% |
What is included in the product
 Detailed Word Document
A concise, pre-built Business Model Canvas for Employers Holdings detailing customer segments, channels, value propositions, revenue streams and cost structure, with competitive analysis, SWOT linkage and practical insights for investors and strategists.

 Customizable Excel Spreadsheet
One-page Business Model Canvas for Employers Holdings condenses its insurance strategy into a clear, editable snapshot that saves hours of structuring while helping teams quickly pinpoint value drivers, distribution channels, and risk controls for faster strategic decisions.
Activities

Underwriting & pricing
Underwriting and pricing drive profitability through disciplined risk selection, precise class coding, and experience rating that align premiums with loss exposure. Actuarial models calibrate rates and tier structures using 2024 NAIC workers’ comp trends (US direct written premiums ~68 billion) and company loss-cost indices. Regular audits and endorsements refine exposure mid-term, while portfolio steering balances classes, geographies, and hazard levels to optimize combined ratios.
Claims management
Triage, investigation, and medical case management control severity, cutting average claim costs by 15–25% (NCCI 2023). Return-to-work programs reduce indemnity duration by up to 30% (WCRI 2022). Subrogation and fraud detection recover roughly 8–12% of paid losses. Active litigation management can lower legal spend by about 20% (industry benchmark 2024).

Loss control
Onsite and virtual safety consultations cut claim frequency—workplace safety programs reduce injuries 20–40% (NIOSH). Training, checklists and compliance guidance drive safer practices; data-driven hazard assessments prioritize interventions using incident analytics. Continuous feedback loops feed underwriting models to refine pricing and risk selection as of 2024.

Agency distribution
Recruiting, appointing, and enabling agents expands Employers Holdings reach into niche commercial markets and small-business segments, while co-marketing and targeted training lift submission quality and bind rates; compensation plans align agent behavior to incentivize profitable growth, and defined service SLAs improve retention and cross-sell lifetime value.
- Recruiting: expands distribution
- Co-marketing/training: raises submission quality
- Comp plans: incentivize profitable growth
- Service SLAs: support retention
Regulatory & finance
Regulatory & finance functions ensure state filings, audits and statutory reporting meet requirements and support Employers Holdings’ AM Best A- rating and risk-based capital positioning. Capital and reserving management target regulatory RBC thresholds and internal solvency buffers to satisfy rating agency criteria. Investment of float drives yield contributions to earnings while enterprise risk management continuously monitors market and underwriting volatility.
- State filings, audits, statutory reporting
- RBC/reserving to meet AM Best expectations
- Float investment supports earnings
- ERM monitors volatility
Optimize WC: $68B; claims 15–25% RTW 30%
Underwriting, claims, safety, distribution and finance optimize loss ratios and capital: 2024 US WC direct premiums ~$68B, company loss-cost index adjustments, claims cost reductions 15–25%, RTW durations down 30%, subrogation recoup 8–12%.
| Metric | 2024 |
|---|---|
| US WC premiums | $68B |
| Claims cost reduction | 15–25% |
| RTW duration | -30% |
| Subrogation recovery | 8–12% |
Full Document Unlocks After Purchase
Business Model Canvas
The Employers Holdings Business Model Canvas shown here is the actual deliverable, not a mockup. This preview is a direct snapshot of the full document you’ll receive after purchase. Upon payment you’ll instantly download the identical, fully editable file ready for presentation and use in Word and Excel formats.

Business Model Canvas for a Specialty Insurer - Value, Customers & Revenue Mechanics
Unlock the strategic blueprint of Employers Holdings with our concise Business Model Canvas—three to five clear sentences that map value propositions, customer segments, and revenue mechanics. Dive deeper by purchasing the full Canvas to get a section-by-section breakdown, financial implications, and editable Word/Excel files. Ideal for investors, strategists, and consultants seeking actionable, ready-to-use insights.
Partnerships
Independent agents
Distribution relies on appointed independent agents and brokers who bring targeted small-business accounts, with 2024 industry data showing independent agents handle roughly 70% of small-commercial distribution.
They provide local market knowledge and pre-qualify risks, improving underwriting efficiency and lowering acquisition costs.
Strong agency relationships raise submission quality and bind ratios, driving higher retention and lower loss-adjusted expense ratios.
Tiered incentive plans align agent growth with company profitability targets, boosting profitable new business.
Reinsurers
Quota-share and excess-of-loss reinsurance partners stabilize Employers Holdings earnings and capital by ceding risk and smoothing loss volatility; the 2024 reinsurance market remained relatively tight following recent catastrophe years. These partners limit peak-loss exposure and geographic concentration, while reinsurer analytics in 2024 increasingly informed underwriting guidelines and risk selection. Contract terms determine ceded capacity and pricing flexibility, directly impacting underwriting leverage and product pricing.
Medical networks
Preferred provider organizations and pharmacy benefit managers lower medical costs—PPO discounts average 15–25% and PBMs delivered net drug savings around 20% in 2024. Network discounts and utilization controls have improved loss ratios by 5–10%. Coordinated care shortens claim duration and speeds return-to-work, reducing disability days by ~25%. Data sharing and analytics cut medical spend and improve outcomes by 10–15%.
Regulators & rating bureaus
Partnerships with state DOI offices, NCCI, and independent rating bureaus ensure Employers Holdings meets regulatory requirements and maintains market access; as of 2024 NCCI serves 38 states plus DC, supplying standardized loss-costs and class codes that underpin pricing and reserving. Collaborative filings streamline rates, rules, and forms, while proactive engagement cuts regulatory friction and approval delays.
- Compliance alignment with state DOIs and rating bureaus
- Access to NCCI loss-costs and class codes (38 states + DC)
- Filing collaboration accelerates rate/form approvals
Technology & data vendors
Technology and data vendors power Employers Holdings underwriting and claims workflows, with core systems, analytics, and external feeds (telematics, payroll, credit proxies) enhancing risk selection and pricing as of 2024. Automation partners drive straight-through processing and reduced manual touchpoints, while cybersecurity vendors secure sensitive policyholder and claimant data.
- core-systems
- analytics-data
- telematics-payroll
- automation-stp
- cybersecurity
70% agents, reinsurance stabilizes capital, PPO/PBM cut medical spend
Distribution: independent agents handle ~70% of small-commercial distribution in 2024, improving targeted acquisition and bind ratios.
Reinsurance: quota-share/excess-of-loss partners stabilize capital amid a tight 2024 market, limiting peak-loss and smoothing earnings.
Medical networks/PBMs: PPO discounts 15–25% and PBM net savings ~20% cut medical spend and improve loss ratios 5–10% in 2024.
Regulatory/tech: NCCI (38 states + DC), core systems, analytics and cybersecurity underpin pricing, underwriting and compliance.
| Metric | 2024 |
|---|---|
| Independent agents | 70% |
| NCCI coverage | 38 states + DC |
| PPO discount | 15–25% |
| PBM net savings | ~20% |
| Loss ratio improvement | 5–10% |
What is included in the product
Detailed Word Document
A concise, pre-built Business Model Canvas for Employers Holdings detailing customer segments, channels, value propositions, revenue streams and cost structure, with competitive analysis, SWOT linkage and practical insights for investors and strategists.
Customizable Excel Spreadsheet
One-page Business Model Canvas for Employers Holdings condenses its insurance strategy into a clear, editable snapshot that saves hours of structuring while helping teams quickly pinpoint value drivers, distribution channels, and risk controls for faster strategic decisions.
Activities
Underwriting & pricing
Underwriting and pricing drive profitability through disciplined risk selection, precise class coding, and experience rating that align premiums with loss exposure. Actuarial models calibrate rates and tier structures using 2024 NAIC workers’ comp trends (US direct written premiums ~68 billion) and company loss-cost indices. Regular audits and endorsements refine exposure mid-term, while portfolio steering balances classes, geographies, and hazard levels to optimize combined ratios.
Claims management
Triage, investigation, and medical case management control severity, cutting average claim costs by 15–25% (NCCI 2023). Return-to-work programs reduce indemnity duration by up to 30% (WCRI 2022). Subrogation and fraud detection recover roughly 8–12% of paid losses. Active litigation management can lower legal spend by about 20% (industry benchmark 2024).
Loss control
Onsite and virtual safety consultations cut claim frequency—workplace safety programs reduce injuries 20–40% (NIOSH). Training, checklists and compliance guidance drive safer practices; data-driven hazard assessments prioritize interventions using incident analytics. Continuous feedback loops feed underwriting models to refine pricing and risk selection as of 2024.
Agency distribution
Recruiting, appointing, and enabling agents expands Employers Holdings reach into niche commercial markets and small-business segments, while co-marketing and targeted training lift submission quality and bind rates; compensation plans align agent behavior to incentivize profitable growth, and defined service SLAs improve retention and cross-sell lifetime value.
- Recruiting: expands distribution
- Co-marketing/training: raises submission quality
- Comp plans: incentivize profitable growth
- Service SLAs: support retention
Regulatory & finance
Regulatory & finance functions ensure state filings, audits and statutory reporting meet requirements and support Employers Holdings’ AM Best A- rating and risk-based capital positioning. Capital and reserving management target regulatory RBC thresholds and internal solvency buffers to satisfy rating agency criteria. Investment of float drives yield contributions to earnings while enterprise risk management continuously monitors market and underwriting volatility.
- State filings, audits, statutory reporting
- RBC/reserving to meet AM Best expectations
- Float investment supports earnings
- ERM monitors volatility
Optimize WC: $68B; claims 15–25% RTW 30%
Underwriting, claims, safety, distribution and finance optimize loss ratios and capital: 2024 US WC direct premiums ~$68B, company loss-cost index adjustments, claims cost reductions 15–25%, RTW durations down 30%, subrogation recoup 8–12%.
| Metric | 2024 |
|---|---|
| US WC premiums | $68B |
| Claims cost reduction | 15–25% |
| RTW duration | -30% |
| Subrogation recovery | 8–12% |
Full Document Unlocks After Purchase
Business Model Canvas
The Employers Holdings Business Model Canvas shown here is the actual deliverable, not a mockup. This preview is a direct snapshot of the full document you’ll receive after purchase. Upon payment you’ll instantly download the identical, fully editable file ready for presentation and use in Word and Excel formats.
Description
Business Model Canvas for a Specialty Insurer - Value, Customers & Revenue Mechanics
Unlock the strategic blueprint of Employers Holdings with our concise Business Model Canvas—three to five clear sentences that map value propositions, customer segments, and revenue mechanics. Dive deeper by purchasing the full Canvas to get a section-by-section breakdown, financial implications, and editable Word/Excel files. Ideal for investors, strategists, and consultants seeking actionable, ready-to-use insights.
Partnerships
Independent agents
Distribution relies on appointed independent agents and brokers who bring targeted small-business accounts, with 2024 industry data showing independent agents handle roughly 70% of small-commercial distribution.
They provide local market knowledge and pre-qualify risks, improving underwriting efficiency and lowering acquisition costs.
Strong agency relationships raise submission quality and bind ratios, driving higher retention and lower loss-adjusted expense ratios.
Tiered incentive plans align agent growth with company profitability targets, boosting profitable new business.
Reinsurers
Quota-share and excess-of-loss reinsurance partners stabilize Employers Holdings earnings and capital by ceding risk and smoothing loss volatility; the 2024 reinsurance market remained relatively tight following recent catastrophe years. These partners limit peak-loss exposure and geographic concentration, while reinsurer analytics in 2024 increasingly informed underwriting guidelines and risk selection. Contract terms determine ceded capacity and pricing flexibility, directly impacting underwriting leverage and product pricing.
Medical networks
Preferred provider organizations and pharmacy benefit managers lower medical costs—PPO discounts average 15–25% and PBMs delivered net drug savings around 20% in 2024. Network discounts and utilization controls have improved loss ratios by 5–10%. Coordinated care shortens claim duration and speeds return-to-work, reducing disability days by ~25%. Data sharing and analytics cut medical spend and improve outcomes by 10–15%.
Regulators & rating bureaus
Partnerships with state DOI offices, NCCI, and independent rating bureaus ensure Employers Holdings meets regulatory requirements and maintains market access; as of 2024 NCCI serves 38 states plus DC, supplying standardized loss-costs and class codes that underpin pricing and reserving. Collaborative filings streamline rates, rules, and forms, while proactive engagement cuts regulatory friction and approval delays.
- Compliance alignment with state DOIs and rating bureaus
- Access to NCCI loss-costs and class codes (38 states + DC)
- Filing collaboration accelerates rate/form approvals
Technology & data vendors
Technology and data vendors power Employers Holdings underwriting and claims workflows, with core systems, analytics, and external feeds (telematics, payroll, credit proxies) enhancing risk selection and pricing as of 2024. Automation partners drive straight-through processing and reduced manual touchpoints, while cybersecurity vendors secure sensitive policyholder and claimant data.
- core-systems
- analytics-data
- telematics-payroll
- automation-stp
- cybersecurity
70% agents, reinsurance stabilizes capital, PPO/PBM cut medical spend
Distribution: independent agents handle ~70% of small-commercial distribution in 2024, improving targeted acquisition and bind ratios.
Reinsurance: quota-share/excess-of-loss partners stabilize capital amid a tight 2024 market, limiting peak-loss and smoothing earnings.
Medical networks/PBMs: PPO discounts 15–25% and PBM net savings ~20% cut medical spend and improve loss ratios 5–10% in 2024.
Regulatory/tech: NCCI (38 states + DC), core systems, analytics and cybersecurity underpin pricing, underwriting and compliance.
| Metric | 2024 |
|---|---|
| Independent agents | 70% |
| NCCI coverage | 38 states + DC |
| PPO discount | 15–25% |
| PBM net savings | ~20% |
| Loss ratio improvement | 5–10% |
What is included in the product
Detailed Word Document
A concise, pre-built Business Model Canvas for Employers Holdings detailing customer segments, channels, value propositions, revenue streams and cost structure, with competitive analysis, SWOT linkage and practical insights for investors and strategists.
Customizable Excel Spreadsheet
One-page Business Model Canvas for Employers Holdings condenses its insurance strategy into a clear, editable snapshot that saves hours of structuring while helping teams quickly pinpoint value drivers, distribution channels, and risk controls for faster strategic decisions.
Activities
Underwriting & pricing
Underwriting and pricing drive profitability through disciplined risk selection, precise class coding, and experience rating that align premiums with loss exposure. Actuarial models calibrate rates and tier structures using 2024 NAIC workers’ comp trends (US direct written premiums ~68 billion) and company loss-cost indices. Regular audits and endorsements refine exposure mid-term, while portfolio steering balances classes, geographies, and hazard levels to optimize combined ratios.
Claims management
Triage, investigation, and medical case management control severity, cutting average claim costs by 15–25% (NCCI 2023). Return-to-work programs reduce indemnity duration by up to 30% (WCRI 2022). Subrogation and fraud detection recover roughly 8–12% of paid losses. Active litigation management can lower legal spend by about 20% (industry benchmark 2024).
Loss control
Onsite and virtual safety consultations cut claim frequency—workplace safety programs reduce injuries 20–40% (NIOSH). Training, checklists and compliance guidance drive safer practices; data-driven hazard assessments prioritize interventions using incident analytics. Continuous feedback loops feed underwriting models to refine pricing and risk selection as of 2024.
Agency distribution
Recruiting, appointing, and enabling agents expands Employers Holdings reach into niche commercial markets and small-business segments, while co-marketing and targeted training lift submission quality and bind rates; compensation plans align agent behavior to incentivize profitable growth, and defined service SLAs improve retention and cross-sell lifetime value.
- Recruiting: expands distribution
- Co-marketing/training: raises submission quality
- Comp plans: incentivize profitable growth
- Service SLAs: support retention
Regulatory & finance
Regulatory & finance functions ensure state filings, audits and statutory reporting meet requirements and support Employers Holdings’ AM Best A- rating and risk-based capital positioning. Capital and reserving management target regulatory RBC thresholds and internal solvency buffers to satisfy rating agency criteria. Investment of float drives yield contributions to earnings while enterprise risk management continuously monitors market and underwriting volatility.
- State filings, audits, statutory reporting
- RBC/reserving to meet AM Best expectations
- Float investment supports earnings
- ERM monitors volatility
Optimize WC: $68B; claims 15–25% RTW 30%
Underwriting, claims, safety, distribution and finance optimize loss ratios and capital: 2024 US WC direct premiums ~$68B, company loss-cost index adjustments, claims cost reductions 15–25%, RTW durations down 30%, subrogation recoup 8–12%.
| Metric | 2024 |
|---|---|
| US WC premiums | $68B |
| Claims cost reduction | 15–25% |
| RTW duration | -30% |
| Subrogation recovery | 8–12% |
Full Document Unlocks After Purchase
Business Model Canvas
The Employers Holdings Business Model Canvas shown here is the actual deliverable, not a mockup. This preview is a direct snapshot of the full document you’ll receive after purchase. Upon payment you’ll instantly download the identical, fully editable file ready for presentation and use in Word and Excel formats.











