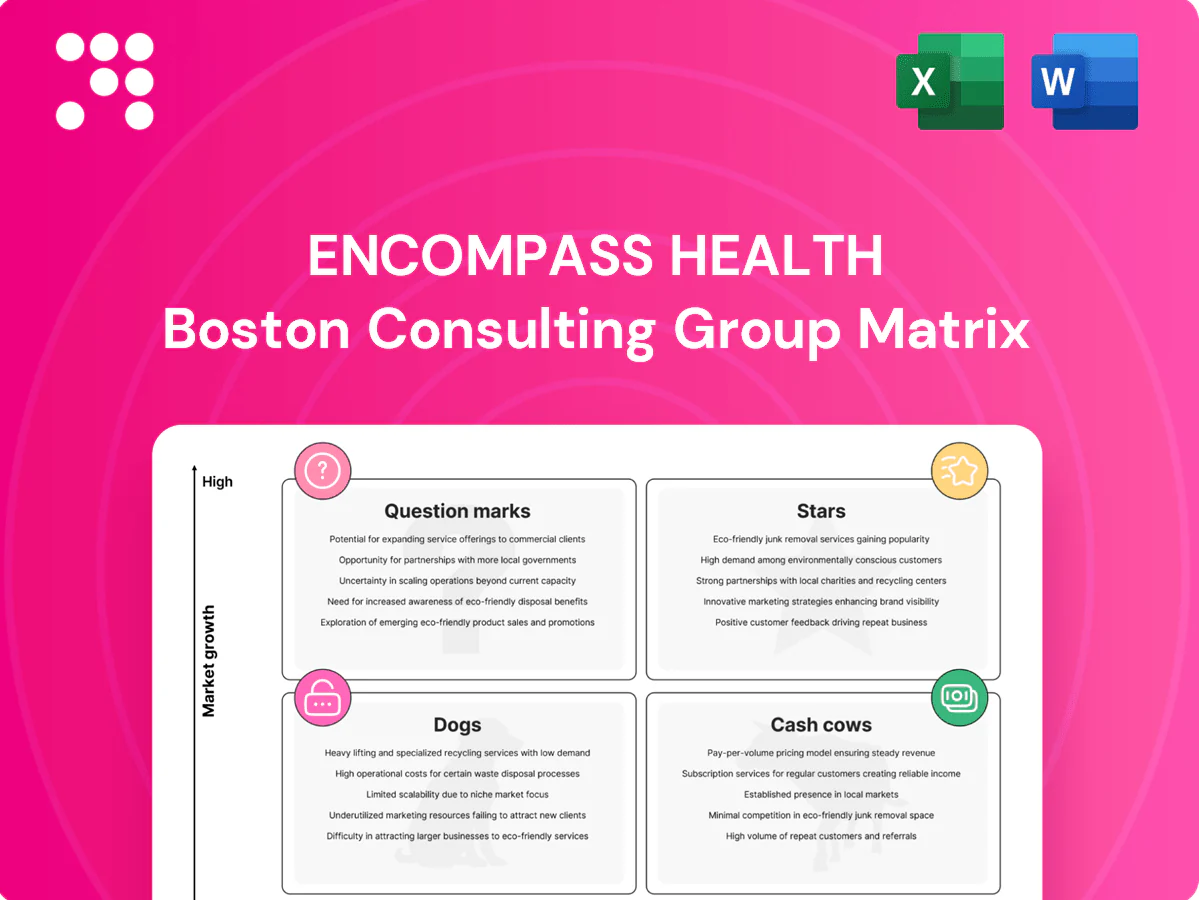
Encompass Health Boston Consulting Group Matrix

Download Your Competitive Advantage
Want a clear map of Encompass Health’s portfolio—what’s leading growth, what’s funding it, and what’s dragging you down? This preview skims the surface; buy the full BCG Matrix to get quadrant-level placements, data-driven recommendations, and a ready-to-use Word report plus an Excel summary. Get the strategic clarity to allocate capital, defend market share, and make faster, smarter decisions—purchase now for instant access.
Stars

Flagship inpatient rehabilitation hospitals
Flagship inpatient rehabilitation hospitals are Encompass Health’s core IRF facilities, comprising 136 hospitals nationwide with strong census and brand pull in growing metros. Demand for post-acute recovery is rising as the US population aged 65+ reached about 56 million in 2024 and surgical volumes have rebounded toward pre‑pandemic levels. They lead locally but require ongoing investment in clinical talent and targeted marketing to protect and grow share; continued capital and operating support will help them compound into dominant positions.
Neurologic rehab programs (stroke, brain injury)
High-acuity neuro cases are rising—about 795,000 strokes occur annually in the US (CDC), so outcomes matter most in stroke and brain injury rehab. Encompass Health’s clinical depth drives referral preference and market share, supported by its scale (2023 revenue ~$5.6 billion). Payers are pressuring faster, safer discharges, keeping growth strong; continue investing in specialized teams, outcome data analytics, and rehab technology.

Spinal cord and complex orthopedic recovery
Spinal cord and complex orthopedic recovery are Stars for Encompass Health, commanding strong reputation and high throughput in trauma and elective markets and drawing predictable surgeon and system referrals. These programs scale margins as admissions concentrate; Encompass operated about 137 inpatient rehab hospitals and 267 home health/home-based locations in 2024, enabling healthy growth. Continue expanding centers of excellence and post-discharge support to capture referral streams and improve outcomes.

Health system joint ventures
Health system joint ventures lock in referral streams and local credibility, positioning Encompass Health as a Star with high share in core markets; partners are expanding pipelines as hospitals offload capital while protecting clinical quality. The category still needs growth capital and tight governance; double down where partners bring catchment and payer access.
- JV benefit: secured referrals and brand
- Partner trend: capital-light expansion
- Needs: growth capital + governance
- Focus: partners with catchment and payer reach
Outcomes analytics and physician-led care model
Outcomes analytics and a physician-led care model drive superior LOS, readmission, and functional-gain performance, winning referrals in the expanding post-acute market; 2024 CMS reporting indicates IRFs maintain lower readmission and shorter LOS versus SNFs. The model differentiates in head-to-head SNF battles but requires ongoing investment in data infrastructure and clinical leadership and continuous publication of outcomes and decision-support integration.
- Tags: LOS; readmission; functional-gain; physician-led; data-infrastructure; outcomes-publication; decision-support
Flagship 136 IRFs capture high local share as 65+ population (~56M) and strokes rise
Flagship 136 IRF hospitals drive strong local share amid a 65+ US population of ~56M in 2024 and rebounding surgical volumes; continued capital and talent investment needed. Rising high‑acuity cases (≈795,000 US strokes/year) and Encompass Health scale (2023 revenue ~$5.6B) make these Stars high-growth, high-share opportunities.
| Metric | Value |
|---|---|
| IRF hospitals | 136 |
| US 65+ population (2024) | ~56,000,000 |
| Annual strokes (US) | ≈795,000 |
| 2023 revenue | $5.6B |
What is included in the product
 Detailed Word Document
Comprehensive BCG Matrix review of Encompass Health, identifying Stars, Cash Cows, Question Marks, Dogs with investment guidance.

 Customizable Excel Spreadsheet
One-page BCG matrix for Encompass Health, simplifying unit prioritization and speeding strategic decisions.
Cash Cows

Mature metro hospitals with stable occupancy
Mature metro hospitals operate at a steady census with optimized staffing and routines, recording roughly 66% average occupancy in 2024 and stable length-of-stay metrics; market growth is modest (around 2% annually in post-acute care), but Encompass holds entrenched share in core metros. These sites generate reliable free cash flow after maintenance capex (typically low single-digit percent of revenue), so keep operations efficient and avoid overinvestment.
Routine orthopedic and debility pathways
Encompass Health operates over 130 inpatient rehabilitation hospitals in the US; routine orthopedic and debility pathways use standardized protocols yielding predictable LOS of 12–16 days with low variability. These are cash cows—steady throughput and dependable margins with minimal promotion beyond physician relations. Maintain playbooks and squeeze cost per case to protect margin.

Established referral relationships and liaisons
Decade-long ties with discharge planners and surgeons keep beds filled for Encompass Health, which as of 2024 operates 137 inpatient rehabilitation hospitals and 255 home health and hospice locations, sustaining steady referral flow. The engine is already built and upkeep is light, producing strong free cash flow that funds newer bets while guarding continuity. Priority: refresh coverage, manage referral channels, and avoid bloat to protect margins.

Therapy operations with high productivity
Therapy operations show high productivity with group therapy blocks and tuned staffing grids; 2024 metrics indicate ~3% same-facility productivity improvement and stable float pools cutting premium labor spend. Low growth but highly repeatable cash flows; incremental tech and schedule tweaks improved cash conversion by roughly 200 basis points in 2024.
- Productivity: +3% YTD 2024
- Labor: float pools cut premium spend
- Growth: low, high repeatability
- Cash conversion: +200 bps 2024
Medicare FFS case mix in stable regions
Medicare FFS case mix in stable regions functions as a cash cow for Encompass Health because CMS IRF PPS reimbursement is predictable under the FY2024 rule, coding practices are mature, and volume patterns show limited volatility compared with newer service lines. After compliance costs, these units sustain steady operating margins and low single-digit denial rates when documentation quality and denial prevention are prioritized.
- Known reimbursement: CMS IRF PPS FY2024 rule stability
- Coding mastery: proven workflows reduce revenue leakage
- Stable volume: less whipsaw than growth lines
- Steady margin: surviving compliance costs
- Focus: documentation quality and denial prevention
Mature metro IRFs: 66% occupancy, 12–16 day LOS, reliable ~5% FCF
Mature metro IRFs (66% occupancy in 2024) deliver steady throughput, predictable LOS (12–16 days), and reliable FCF (~5% margin) while Encompass (137 IRFs, 255 HH/Hospice) leverages entrenched referrals; focus on cost-per-case, documentation, and referral coverage to protect margins and fund growth.
| Metric | 2024 |
|---|---|
| Occupancy | 66% |
| IRFs | 137 |
| FCF margin | ~5% |
| Productivity | +3% |
What You’re Viewing Is Included
Encompass Health BCG Matrix
The file you're previewing is the exact Encompass Health BCG Matrix you'll receive after purchase. No watermarks, no demo content—just a fully formatted, analysis-ready report built for strategy and clear decisions. Once purchased, the same document is immediately downloadable and editable for presentations, planning, or client delivery. Simple: what you see is what you get.

Download Your Competitive Advantage
Want a clear map of Encompass Health’s portfolio—what’s leading growth, what’s funding it, and what’s dragging you down? This preview skims the surface; buy the full BCG Matrix to get quadrant-level placements, data-driven recommendations, and a ready-to-use Word report plus an Excel summary. Get the strategic clarity to allocate capital, defend market share, and make faster, smarter decisions—purchase now for instant access.
Stars
Flagship inpatient rehabilitation hospitals
Flagship inpatient rehabilitation hospitals are Encompass Health’s core IRF facilities, comprising 136 hospitals nationwide with strong census and brand pull in growing metros. Demand for post-acute recovery is rising as the US population aged 65+ reached about 56 million in 2024 and surgical volumes have rebounded toward pre‑pandemic levels. They lead locally but require ongoing investment in clinical talent and targeted marketing to protect and grow share; continued capital and operating support will help them compound into dominant positions.
Neurologic rehab programs (stroke, brain injury)
High-acuity neuro cases are rising—about 795,000 strokes occur annually in the US (CDC), so outcomes matter most in stroke and brain injury rehab. Encompass Health’s clinical depth drives referral preference and market share, supported by its scale (2023 revenue ~$5.6 billion). Payers are pressuring faster, safer discharges, keeping growth strong; continue investing in specialized teams, outcome data analytics, and rehab technology.
Spinal cord and complex orthopedic recovery
Spinal cord and complex orthopedic recovery are Stars for Encompass Health, commanding strong reputation and high throughput in trauma and elective markets and drawing predictable surgeon and system referrals. These programs scale margins as admissions concentrate; Encompass operated about 137 inpatient rehab hospitals and 267 home health/home-based locations in 2024, enabling healthy growth. Continue expanding centers of excellence and post-discharge support to capture referral streams and improve outcomes.
Health system joint ventures
Health system joint ventures lock in referral streams and local credibility, positioning Encompass Health as a Star with high share in core markets; partners are expanding pipelines as hospitals offload capital while protecting clinical quality. The category still needs growth capital and tight governance; double down where partners bring catchment and payer access.
- JV benefit: secured referrals and brand
- Partner trend: capital-light expansion
- Needs: growth capital + governance
- Focus: partners with catchment and payer reach
Outcomes analytics and physician-led care model
Outcomes analytics and a physician-led care model drive superior LOS, readmission, and functional-gain performance, winning referrals in the expanding post-acute market; 2024 CMS reporting indicates IRFs maintain lower readmission and shorter LOS versus SNFs. The model differentiates in head-to-head SNF battles but requires ongoing investment in data infrastructure and clinical leadership and continuous publication of outcomes and decision-support integration.
- Tags: LOS; readmission; functional-gain; physician-led; data-infrastructure; outcomes-publication; decision-support
Flagship 136 IRFs capture high local share as 65+ population (~56M) and strokes rise
Flagship 136 IRF hospitals drive strong local share amid a 65+ US population of ~56M in 2024 and rebounding surgical volumes; continued capital and talent investment needed. Rising high‑acuity cases (≈795,000 US strokes/year) and Encompass Health scale (2023 revenue ~$5.6B) make these Stars high-growth, high-share opportunities.
| Metric | Value |
|---|---|
| IRF hospitals | 136 |
| US 65+ population (2024) | ~56,000,000 |
| Annual strokes (US) | ≈795,000 |
| 2023 revenue | $5.6B |
What is included in the product
Detailed Word Document
Comprehensive BCG Matrix review of Encompass Health, identifying Stars, Cash Cows, Question Marks, Dogs with investment guidance.
Customizable Excel Spreadsheet
One-page BCG matrix for Encompass Health, simplifying unit prioritization and speeding strategic decisions.
Cash Cows
Mature metro hospitals with stable occupancy
Mature metro hospitals operate at a steady census with optimized staffing and routines, recording roughly 66% average occupancy in 2024 and stable length-of-stay metrics; market growth is modest (around 2% annually in post-acute care), but Encompass holds entrenched share in core metros. These sites generate reliable free cash flow after maintenance capex (typically low single-digit percent of revenue), so keep operations efficient and avoid overinvestment.
Routine orthopedic and debility pathways
Encompass Health operates over 130 inpatient rehabilitation hospitals in the US; routine orthopedic and debility pathways use standardized protocols yielding predictable LOS of 12–16 days with low variability. These are cash cows—steady throughput and dependable margins with minimal promotion beyond physician relations. Maintain playbooks and squeeze cost per case to protect margin.
Established referral relationships and liaisons
Decade-long ties with discharge planners and surgeons keep beds filled for Encompass Health, which as of 2024 operates 137 inpatient rehabilitation hospitals and 255 home health and hospice locations, sustaining steady referral flow. The engine is already built and upkeep is light, producing strong free cash flow that funds newer bets while guarding continuity. Priority: refresh coverage, manage referral channels, and avoid bloat to protect margins.
Therapy operations with high productivity
Therapy operations show high productivity with group therapy blocks and tuned staffing grids; 2024 metrics indicate ~3% same-facility productivity improvement and stable float pools cutting premium labor spend. Low growth but highly repeatable cash flows; incremental tech and schedule tweaks improved cash conversion by roughly 200 basis points in 2024.
- Productivity: +3% YTD 2024
- Labor: float pools cut premium spend
- Growth: low, high repeatability
- Cash conversion: +200 bps 2024
Medicare FFS case mix in stable regions
Medicare FFS case mix in stable regions functions as a cash cow for Encompass Health because CMS IRF PPS reimbursement is predictable under the FY2024 rule, coding practices are mature, and volume patterns show limited volatility compared with newer service lines. After compliance costs, these units sustain steady operating margins and low single-digit denial rates when documentation quality and denial prevention are prioritized.
- Known reimbursement: CMS IRF PPS FY2024 rule stability
- Coding mastery: proven workflows reduce revenue leakage
- Stable volume: less whipsaw than growth lines
- Steady margin: surviving compliance costs
- Focus: documentation quality and denial prevention
Mature metro IRFs: 66% occupancy, 12–16 day LOS, reliable ~5% FCF
Mature metro IRFs (66% occupancy in 2024) deliver steady throughput, predictable LOS (12–16 days), and reliable FCF (~5% margin) while Encompass (137 IRFs, 255 HH/Hospice) leverages entrenched referrals; focus on cost-per-case, documentation, and referral coverage to protect margins and fund growth.
| Metric | 2024 |
|---|---|
| Occupancy | 66% |
| IRFs | 137 |
| FCF margin | ~5% |
| Productivity | +3% |
What You’re Viewing Is Included
Encompass Health BCG Matrix
The file you're previewing is the exact Encompass Health BCG Matrix you'll receive after purchase. No watermarks, no demo content—just a fully formatted, analysis-ready report built for strategy and clear decisions. Once purchased, the same document is immediately downloadable and editable for presentations, planning, or client delivery. Simple: what you see is what you get.
Original: $10.00
-65%$10.00
$3.50Description
Download Your Competitive Advantage
Want a clear map of Encompass Health’s portfolio—what’s leading growth, what’s funding it, and what’s dragging you down? This preview skims the surface; buy the full BCG Matrix to get quadrant-level placements, data-driven recommendations, and a ready-to-use Word report plus an Excel summary. Get the strategic clarity to allocate capital, defend market share, and make faster, smarter decisions—purchase now for instant access.
Stars
Flagship inpatient rehabilitation hospitals
Flagship inpatient rehabilitation hospitals are Encompass Health’s core IRF facilities, comprising 136 hospitals nationwide with strong census and brand pull in growing metros. Demand for post-acute recovery is rising as the US population aged 65+ reached about 56 million in 2024 and surgical volumes have rebounded toward pre‑pandemic levels. They lead locally but require ongoing investment in clinical talent and targeted marketing to protect and grow share; continued capital and operating support will help them compound into dominant positions.
Neurologic rehab programs (stroke, brain injury)
High-acuity neuro cases are rising—about 795,000 strokes occur annually in the US (CDC), so outcomes matter most in stroke and brain injury rehab. Encompass Health’s clinical depth drives referral preference and market share, supported by its scale (2023 revenue ~$5.6 billion). Payers are pressuring faster, safer discharges, keeping growth strong; continue investing in specialized teams, outcome data analytics, and rehab technology.
Spinal cord and complex orthopedic recovery
Spinal cord and complex orthopedic recovery are Stars for Encompass Health, commanding strong reputation and high throughput in trauma and elective markets and drawing predictable surgeon and system referrals. These programs scale margins as admissions concentrate; Encompass operated about 137 inpatient rehab hospitals and 267 home health/home-based locations in 2024, enabling healthy growth. Continue expanding centers of excellence and post-discharge support to capture referral streams and improve outcomes.
Health system joint ventures
Health system joint ventures lock in referral streams and local credibility, positioning Encompass Health as a Star with high share in core markets; partners are expanding pipelines as hospitals offload capital while protecting clinical quality. The category still needs growth capital and tight governance; double down where partners bring catchment and payer access.
- JV benefit: secured referrals and brand
- Partner trend: capital-light expansion
- Needs: growth capital + governance
- Focus: partners with catchment and payer reach
Outcomes analytics and physician-led care model
Outcomes analytics and a physician-led care model drive superior LOS, readmission, and functional-gain performance, winning referrals in the expanding post-acute market; 2024 CMS reporting indicates IRFs maintain lower readmission and shorter LOS versus SNFs. The model differentiates in head-to-head SNF battles but requires ongoing investment in data infrastructure and clinical leadership and continuous publication of outcomes and decision-support integration.
- Tags: LOS; readmission; functional-gain; physician-led; data-infrastructure; outcomes-publication; decision-support
Flagship 136 IRFs capture high local share as 65+ population (~56M) and strokes rise
Flagship 136 IRF hospitals drive strong local share amid a 65+ US population of ~56M in 2024 and rebounding surgical volumes; continued capital and talent investment needed. Rising high‑acuity cases (≈795,000 US strokes/year) and Encompass Health scale (2023 revenue ~$5.6B) make these Stars high-growth, high-share opportunities.
| Metric | Value |
|---|---|
| IRF hospitals | 136 |
| US 65+ population (2024) | ~56,000,000 |
| Annual strokes (US) | ≈795,000 |
| 2023 revenue | $5.6B |
What is included in the product
Detailed Word Document
Comprehensive BCG Matrix review of Encompass Health, identifying Stars, Cash Cows, Question Marks, Dogs with investment guidance.
Customizable Excel Spreadsheet
One-page BCG matrix for Encompass Health, simplifying unit prioritization and speeding strategic decisions.
Cash Cows
Mature metro hospitals with stable occupancy
Mature metro hospitals operate at a steady census with optimized staffing and routines, recording roughly 66% average occupancy in 2024 and stable length-of-stay metrics; market growth is modest (around 2% annually in post-acute care), but Encompass holds entrenched share in core metros. These sites generate reliable free cash flow after maintenance capex (typically low single-digit percent of revenue), so keep operations efficient and avoid overinvestment.
Routine orthopedic and debility pathways
Encompass Health operates over 130 inpatient rehabilitation hospitals in the US; routine orthopedic and debility pathways use standardized protocols yielding predictable LOS of 12–16 days with low variability. These are cash cows—steady throughput and dependable margins with minimal promotion beyond physician relations. Maintain playbooks and squeeze cost per case to protect margin.
Established referral relationships and liaisons
Decade-long ties with discharge planners and surgeons keep beds filled for Encompass Health, which as of 2024 operates 137 inpatient rehabilitation hospitals and 255 home health and hospice locations, sustaining steady referral flow. The engine is already built and upkeep is light, producing strong free cash flow that funds newer bets while guarding continuity. Priority: refresh coverage, manage referral channels, and avoid bloat to protect margins.
Therapy operations with high productivity
Therapy operations show high productivity with group therapy blocks and tuned staffing grids; 2024 metrics indicate ~3% same-facility productivity improvement and stable float pools cutting premium labor spend. Low growth but highly repeatable cash flows; incremental tech and schedule tweaks improved cash conversion by roughly 200 basis points in 2024.
- Productivity: +3% YTD 2024
- Labor: float pools cut premium spend
- Growth: low, high repeatability
- Cash conversion: +200 bps 2024
Medicare FFS case mix in stable regions
Medicare FFS case mix in stable regions functions as a cash cow for Encompass Health because CMS IRF PPS reimbursement is predictable under the FY2024 rule, coding practices are mature, and volume patterns show limited volatility compared with newer service lines. After compliance costs, these units sustain steady operating margins and low single-digit denial rates when documentation quality and denial prevention are prioritized.
- Known reimbursement: CMS IRF PPS FY2024 rule stability
- Coding mastery: proven workflows reduce revenue leakage
- Stable volume: less whipsaw than growth lines
- Steady margin: surviving compliance costs
- Focus: documentation quality and denial prevention
Mature metro IRFs: 66% occupancy, 12–16 day LOS, reliable ~5% FCF
Mature metro IRFs (66% occupancy in 2024) deliver steady throughput, predictable LOS (12–16 days), and reliable FCF (~5% margin) while Encompass (137 IRFs, 255 HH/Hospice) leverages entrenched referrals; focus on cost-per-case, documentation, and referral coverage to protect margins and fund growth.
| Metric | 2024 |
|---|---|
| Occupancy | 66% |
| IRFs | 137 |
| FCF margin | ~5% |
| Productivity | +3% |
What You’re Viewing Is Included
Encompass Health BCG Matrix
The file you're previewing is the exact Encompass Health BCG Matrix you'll receive after purchase. No watermarks, no demo content—just a fully formatted, analysis-ready report built for strategy and clear decisions. Once purchased, the same document is immediately downloadable and editable for presentations, planning, or client delivery. Simple: what you see is what you get.











