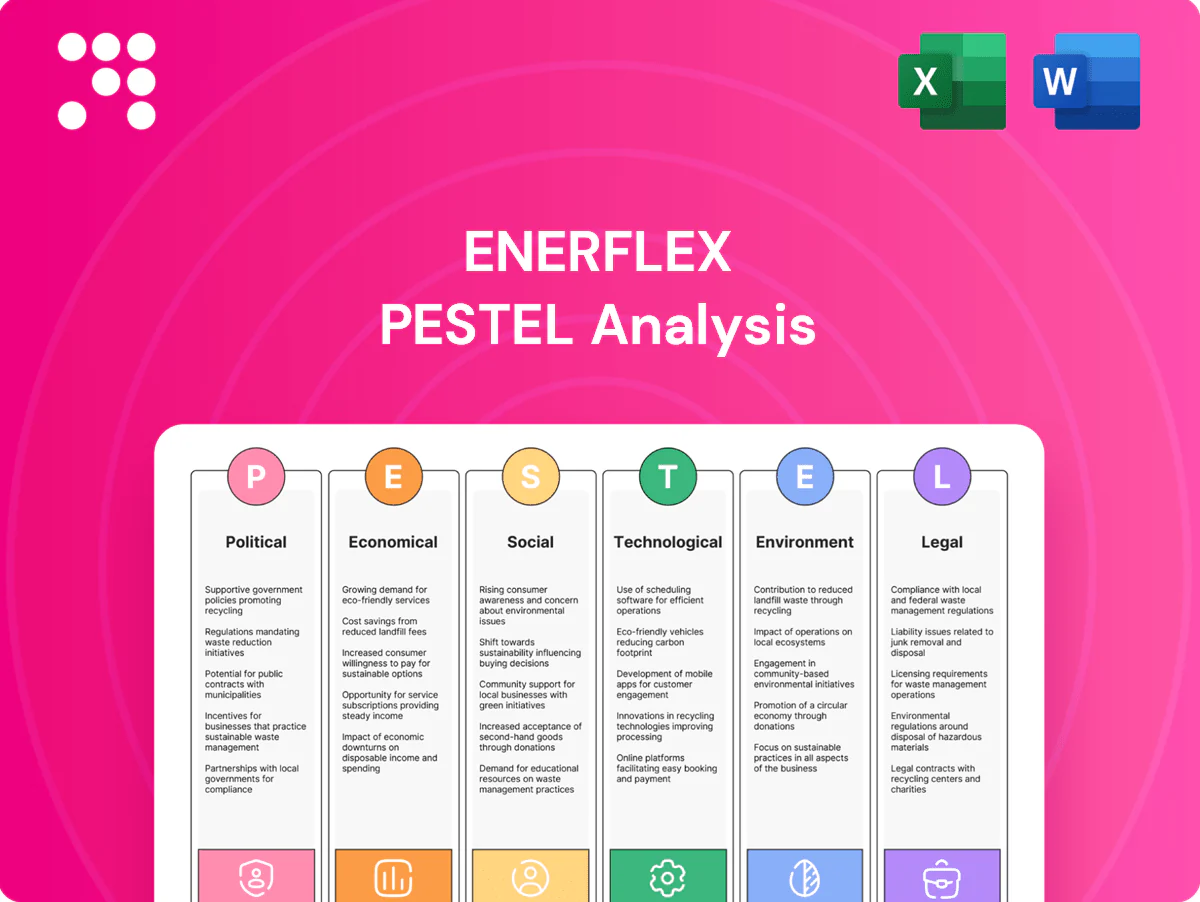
Enerflex PESTLE Analysis

Your Competitive Advantage Starts with This Report
Uncover how political, economic, social, technological, legal, and environmental forces are reshaping Enerflex’s prospects—our PESTLE synthesizes risks and growth levers into ready-made intelligence. Ideal for investors and strategists; purchase the full analysis to access the complete, actionable breakdown instantly.
Political factors

Energy policy volatility
Policy shifts across North America, MENA and LatAm can speed or stall gas infrastructure approvals, affecting project timing and backlog; approvals in 2024–25 varied widely by jurisdiction. Changes in carbon pricing (EU ETS ~€90–100/t in 2024; Canada federal CAD65/t in 2023) and tighter US EPA methane rules (2023–24) alter compression and processing economics. Enerflex must hedge exposure by diversifying geographies and end-markets and proactively engage regulators to shape standards favorable to low-emission gas solutions.
Geopolitical tensions
Geopolitical tensions — sanctions, conflicts and trade realignments — disrupt cross-border projects and parts logistics, raising delivery times and costs. Supply contracts in politically sensitive basins add counterparty and currency risks that can strain margins. Enerflex must implement robust export-control screening and diversified sourcing. Scenario planning preserves backlog delivery amid regional instability.

Local content and procurement
Rising localization mandates in markets such as Nigeria, Kazakhstan and Brazil are shifting cost structures and extending delivery timelines as tenders increasingly require local content and JV partners. Securing public-sector orders and permits now often depends on regional manufacturing or joint ventures. Enerflex must balance local sourcing with corporate quality standards and regulatory compliance. Strategic supplier development enhances resilience and bid competitiveness.

Government funding and incentives
Public support for methane reduction, CCUS and grid electrification can directly catalyze orders as governments deploy funds and incentives; the US Inflation Reduction Act allocates roughly $369 billion for clean energy and 45Q now offers up to $85/ton for CO2 sequestration. Enerflex should align offerings with eligible low-emission technologies and train sales teams to structure deals so customers capture credits and close projects faster.
- IRA ~$369B clean energy funding
- 45Q CCUS credit up to $85/ton CO2
- Align products to qualify for grants/tax credits
- Policy-aware sales shorten closing cycles
Permitting and community approval
Compression and processing sites face stringent siting approvals that can extend permitting timelines and raise working capital needs and execution risk for Enerflex projects.
Early stakeholder mapping and targeted community benefits programs have proven effective at de-risking schedules, while Enerflex modular designs allow sites to better fit permitting constraints and shorten on-site construction durations.
- Permitting complexity increases working capital and execution risk
- Early stakeholder mapping reduces timeline uncertainty
- Community benefits improve approval odds
- Modular designs align with permitting limits and speed delivery
Policy volatility, high carbon prices and IRA/45Q incentives reshape CCUS demand
Policy volatility in 2024–25 (approval timing, local content, export controls) affects Enerflex backlog and margins; EU ETS ~€90–100/t (2024) and Canada CAD65/t (2023) shift economics. US IRA ~$369B and 45Q up to $85/t boost CCUS demand; tighter EPA methane rules raise compliance costs. Geopolitical risks lengthen lead times and sourcing costs.
| Policy | 2024/25 metric | Impact |
|---|---|---|
| Carbon price | EU €90–100/t | Higher OPEX for customers |
| 45Q/IRA | $85/t; $369B | Increased CCUS orders |
| Methane rules | US tightened 2023–24 | Capex/compliance rise |
| Local content | Nigeria/Kazakh/Brazil | Longer timelines |
What is included in the product
 Detailed Word Document
Explores how Political, Economic, Social, Technological, Environmental and Legal factors uniquely affect Enerflex, with data-backed trends and region-specific regulatory context; designed by strategy professionals to support executives and investors with forward-looking insights, actionable risks/opportunities and clean, report-ready formatting.

 Customizable Excel Spreadsheet
Visually segmented by PESTLE categories and written in clear, simple language, the Enerflex PESTLE Analysis provides a concise, editable summary ideal for quick referencing in meetings or slides, enabling teams to align on external risks and market positioning fast.
Economic factors

Hydrocarbon price cycles
Hydrocarbon price cycles (Brent averaged about 86 USD/bbl in 2024) directly drive customer capex for compression and processing, with price upswings expanding midstream takeaway and gas-lift project demand while downturns shift spend to maintenance and optimization. Enerflex’s aftermarket and rentals, representing roughly 35% of FY2024 revenue, stabilize cashflow through cycles. Flexible capacity planning and modular fleets protect margins amid volatile commodity swings.
Interest rates and financing
Elevated policy rates (US Fed funds ~5.25–5.50% mid‑2025) and higher market spreads have effectively raised client WACC by roughly 100–300 bps, delaying greenfield decisions. Leasing, BOOM or service‑based models shift capex off clients’ balance sheets and can reduce approval hurdles. Enerflex can offer performance‑based contracts to link payments to output and unlock approvals, while a strong balance sheet materially boosts bid success on financed deals.

FX and inflation pressures
Multi-currency revenues and costs expose Enerflex margins to FX volatility across North America, Latin America and the Middle East, pressuring USD/CAD and local-currency profitability.
Inflation in inputs such as steel, engines and electronics has compressed fixed-price contract margins amid elevated global input costs versus the Bank of Canada 2% target.
Hedging, indexed pricing, strategic inventory and regional sourcing reduce shocks, lower freight and tariff exposure and preserve gross margins.

Global gas demand growth
Global gas demand reached about 4.0 trillion cubic meters in 2023, with LNG trade near 380 million tonnes, supporting sustained infrastructure buildout as industrial fuel-switching and LNG flows expand into 2024–25. Emerging markets drive roughly two-thirds of incremental gas demand, increasing need for scalable, reliable compression and processing. Enerflex's standardized packages and modular plants match this scale, while lifecycle services enable long-term economic value capture.
- Industrial fuel-switching and LNG trade support sustained buildout
- Emerging markets ≈66% of incremental gas demand
- Standardized packages & modular plants — Enerflex advantage
- Lifecycle services provide recurring, long-term value
Supply chain reliability
Supply chain reliability for Enerflex remains critical as compressor lead times, which spiked to 40+ weeks during 2021–23, eased to roughly 20–30 weeks by 2024, directly affecting project schedules; drivers and controls show similar multi-month variability. Dual-sourcing and rigorous vendor qualification are essential for on-time delivery, while digital supplier visibility (real-time PO/SKU tracking) improves forecasting and allocation; strategic inventory buffers protect critical programs and limit revenue disruption.
- Lead times: 20–30 weeks (2024)
- Dual-sourcing: critical for continuity
- Digital visibility: real-time PO/SKU tracking
- Inventory buffers: protect key programs
Policy volatility, high carbon prices and IRA/45Q incentives reshape CCUS demand
Hydrocarbon cycles (Brent ≈86 USD/bbl in 2024) drive capex vs maintenance; Enerflex’s aftermarket ≈35% of FY2024 revenue cushions cashflow. Global gas ~4.0 tcm (2023) and LNG ≈380 mt sustain infrastructure demand; lead times eased to 20–30 weeks (2024). Higher rates (Fed ≈5.25–5.50% mid‑2025) raise WACC, boosting appeal of leasing/BOOM models.
| Metric | Value |
|---|---|
| Brent (2024) | ≈86 USD/bbl |
| Aftermarket (FY2024) | ≈35% |
| Global gas (2023) | ≈4.0 tcm |
| LNG trade | ≈380 mt |
| Lead times (2024) | 20–30 weeks |
| Fed funds (mid‑2025) | ≈5.25–5.50% |
Same Document Delivered
Enerflex PESTLE Analysis
The preview shown here is the exact Enerflex PESTLE Analysis document you’ll receive after purchase—fully formatted, professionally structured, and ready to use. It contains the same content, layout, and insights displayed in the screenshot with no placeholders or edits. After checkout you’ll instantly download this finished file and can begin applying the analysis right away.

Your Competitive Advantage Starts with This Report
Uncover how political, economic, social, technological, legal, and environmental forces are reshaping Enerflex’s prospects—our PESTLE synthesizes risks and growth levers into ready-made intelligence. Ideal for investors and strategists; purchase the full analysis to access the complete, actionable breakdown instantly.
Political factors
Energy policy volatility
Policy shifts across North America, MENA and LatAm can speed or stall gas infrastructure approvals, affecting project timing and backlog; approvals in 2024–25 varied widely by jurisdiction. Changes in carbon pricing (EU ETS ~€90–100/t in 2024; Canada federal CAD65/t in 2023) and tighter US EPA methane rules (2023–24) alter compression and processing economics. Enerflex must hedge exposure by diversifying geographies and end-markets and proactively engage regulators to shape standards favorable to low-emission gas solutions.
Geopolitical tensions
Geopolitical tensions — sanctions, conflicts and trade realignments — disrupt cross-border projects and parts logistics, raising delivery times and costs. Supply contracts in politically sensitive basins add counterparty and currency risks that can strain margins. Enerflex must implement robust export-control screening and diversified sourcing. Scenario planning preserves backlog delivery amid regional instability.
Local content and procurement
Rising localization mandates in markets such as Nigeria, Kazakhstan and Brazil are shifting cost structures and extending delivery timelines as tenders increasingly require local content and JV partners. Securing public-sector orders and permits now often depends on regional manufacturing or joint ventures. Enerflex must balance local sourcing with corporate quality standards and regulatory compliance. Strategic supplier development enhances resilience and bid competitiveness.
Government funding and incentives
Public support for methane reduction, CCUS and grid electrification can directly catalyze orders as governments deploy funds and incentives; the US Inflation Reduction Act allocates roughly $369 billion for clean energy and 45Q now offers up to $85/ton for CO2 sequestration. Enerflex should align offerings with eligible low-emission technologies and train sales teams to structure deals so customers capture credits and close projects faster.
- IRA ~$369B clean energy funding
- 45Q CCUS credit up to $85/ton CO2
- Align products to qualify for grants/tax credits
- Policy-aware sales shorten closing cycles
Permitting and community approval
Compression and processing sites face stringent siting approvals that can extend permitting timelines and raise working capital needs and execution risk for Enerflex projects.
Early stakeholder mapping and targeted community benefits programs have proven effective at de-risking schedules, while Enerflex modular designs allow sites to better fit permitting constraints and shorten on-site construction durations.
- Permitting complexity increases working capital and execution risk
- Early stakeholder mapping reduces timeline uncertainty
- Community benefits improve approval odds
- Modular designs align with permitting limits and speed delivery
Policy volatility, high carbon prices and IRA/45Q incentives reshape CCUS demand
Policy volatility in 2024–25 (approval timing, local content, export controls) affects Enerflex backlog and margins; EU ETS ~€90–100/t (2024) and Canada CAD65/t (2023) shift economics. US IRA ~$369B and 45Q up to $85/t boost CCUS demand; tighter EPA methane rules raise compliance costs. Geopolitical risks lengthen lead times and sourcing costs.
| Policy | 2024/25 metric | Impact |
|---|---|---|
| Carbon price | EU €90–100/t | Higher OPEX for customers |
| 45Q/IRA | $85/t; $369B | Increased CCUS orders |
| Methane rules | US tightened 2023–24 | Capex/compliance rise |
| Local content | Nigeria/Kazakh/Brazil | Longer timelines |
What is included in the product
Detailed Word Document
Explores how Political, Economic, Social, Technological, Environmental and Legal factors uniquely affect Enerflex, with data-backed trends and region-specific regulatory context; designed by strategy professionals to support executives and investors with forward-looking insights, actionable risks/opportunities and clean, report-ready formatting.
Customizable Excel Spreadsheet
Visually segmented by PESTLE categories and written in clear, simple language, the Enerflex PESTLE Analysis provides a concise, editable summary ideal for quick referencing in meetings or slides, enabling teams to align on external risks and market positioning fast.
Economic factors
Hydrocarbon price cycles
Hydrocarbon price cycles (Brent averaged about 86 USD/bbl in 2024) directly drive customer capex for compression and processing, with price upswings expanding midstream takeaway and gas-lift project demand while downturns shift spend to maintenance and optimization. Enerflex’s aftermarket and rentals, representing roughly 35% of FY2024 revenue, stabilize cashflow through cycles. Flexible capacity planning and modular fleets protect margins amid volatile commodity swings.
Interest rates and financing
Elevated policy rates (US Fed funds ~5.25–5.50% mid‑2025) and higher market spreads have effectively raised client WACC by roughly 100–300 bps, delaying greenfield decisions. Leasing, BOOM or service‑based models shift capex off clients’ balance sheets and can reduce approval hurdles. Enerflex can offer performance‑based contracts to link payments to output and unlock approvals, while a strong balance sheet materially boosts bid success on financed deals.
FX and inflation pressures
Multi-currency revenues and costs expose Enerflex margins to FX volatility across North America, Latin America and the Middle East, pressuring USD/CAD and local-currency profitability.
Inflation in inputs such as steel, engines and electronics has compressed fixed-price contract margins amid elevated global input costs versus the Bank of Canada 2% target.
Hedging, indexed pricing, strategic inventory and regional sourcing reduce shocks, lower freight and tariff exposure and preserve gross margins.
Global gas demand growth
Global gas demand reached about 4.0 trillion cubic meters in 2023, with LNG trade near 380 million tonnes, supporting sustained infrastructure buildout as industrial fuel-switching and LNG flows expand into 2024–25. Emerging markets drive roughly two-thirds of incremental gas demand, increasing need for scalable, reliable compression and processing. Enerflex's standardized packages and modular plants match this scale, while lifecycle services enable long-term economic value capture.
- Industrial fuel-switching and LNG trade support sustained buildout
- Emerging markets ≈66% of incremental gas demand
- Standardized packages & modular plants — Enerflex advantage
- Lifecycle services provide recurring, long-term value
Supply chain reliability
Supply chain reliability for Enerflex remains critical as compressor lead times, which spiked to 40+ weeks during 2021–23, eased to roughly 20–30 weeks by 2024, directly affecting project schedules; drivers and controls show similar multi-month variability. Dual-sourcing and rigorous vendor qualification are essential for on-time delivery, while digital supplier visibility (real-time PO/SKU tracking) improves forecasting and allocation; strategic inventory buffers protect critical programs and limit revenue disruption.
- Lead times: 20–30 weeks (2024)
- Dual-sourcing: critical for continuity
- Digital visibility: real-time PO/SKU tracking
- Inventory buffers: protect key programs
Policy volatility, high carbon prices and IRA/45Q incentives reshape CCUS demand
Hydrocarbon cycles (Brent ≈86 USD/bbl in 2024) drive capex vs maintenance; Enerflex’s aftermarket ≈35% of FY2024 revenue cushions cashflow. Global gas ~4.0 tcm (2023) and LNG ≈380 mt sustain infrastructure demand; lead times eased to 20–30 weeks (2024). Higher rates (Fed ≈5.25–5.50% mid‑2025) raise WACC, boosting appeal of leasing/BOOM models.
| Metric | Value |
|---|---|
| Brent (2024) | ≈86 USD/bbl |
| Aftermarket (FY2024) | ≈35% |
| Global gas (2023) | ≈4.0 tcm |
| LNG trade | ≈380 mt |
| Lead times (2024) | 20–30 weeks |
| Fed funds (mid‑2025) | ≈5.25–5.50% |
Same Document Delivered
Enerflex PESTLE Analysis
The preview shown here is the exact Enerflex PESTLE Analysis document you’ll receive after purchase—fully formatted, professionally structured, and ready to use. It contains the same content, layout, and insights displayed in the screenshot with no placeholders or edits. After checkout you’ll instantly download this finished file and can begin applying the analysis right away.
Original: $10.00
-65%$10.00
$3.50Description
Your Competitive Advantage Starts with This Report
Uncover how political, economic, social, technological, legal, and environmental forces are reshaping Enerflex’s prospects—our PESTLE synthesizes risks and growth levers into ready-made intelligence. Ideal for investors and strategists; purchase the full analysis to access the complete, actionable breakdown instantly.
Political factors
Energy policy volatility
Policy shifts across North America, MENA and LatAm can speed or stall gas infrastructure approvals, affecting project timing and backlog; approvals in 2024–25 varied widely by jurisdiction. Changes in carbon pricing (EU ETS ~€90–100/t in 2024; Canada federal CAD65/t in 2023) and tighter US EPA methane rules (2023–24) alter compression and processing economics. Enerflex must hedge exposure by diversifying geographies and end-markets and proactively engage regulators to shape standards favorable to low-emission gas solutions.
Geopolitical tensions
Geopolitical tensions — sanctions, conflicts and trade realignments — disrupt cross-border projects and parts logistics, raising delivery times and costs. Supply contracts in politically sensitive basins add counterparty and currency risks that can strain margins. Enerflex must implement robust export-control screening and diversified sourcing. Scenario planning preserves backlog delivery amid regional instability.
Local content and procurement
Rising localization mandates in markets such as Nigeria, Kazakhstan and Brazil are shifting cost structures and extending delivery timelines as tenders increasingly require local content and JV partners. Securing public-sector orders and permits now often depends on regional manufacturing or joint ventures. Enerflex must balance local sourcing with corporate quality standards and regulatory compliance. Strategic supplier development enhances resilience and bid competitiveness.
Government funding and incentives
Public support for methane reduction, CCUS and grid electrification can directly catalyze orders as governments deploy funds and incentives; the US Inflation Reduction Act allocates roughly $369 billion for clean energy and 45Q now offers up to $85/ton for CO2 sequestration. Enerflex should align offerings with eligible low-emission technologies and train sales teams to structure deals so customers capture credits and close projects faster.
- IRA ~$369B clean energy funding
- 45Q CCUS credit up to $85/ton CO2
- Align products to qualify for grants/tax credits
- Policy-aware sales shorten closing cycles
Permitting and community approval
Compression and processing sites face stringent siting approvals that can extend permitting timelines and raise working capital needs and execution risk for Enerflex projects.
Early stakeholder mapping and targeted community benefits programs have proven effective at de-risking schedules, while Enerflex modular designs allow sites to better fit permitting constraints and shorten on-site construction durations.
- Permitting complexity increases working capital and execution risk
- Early stakeholder mapping reduces timeline uncertainty
- Community benefits improve approval odds
- Modular designs align with permitting limits and speed delivery
Policy volatility, high carbon prices and IRA/45Q incentives reshape CCUS demand
Policy volatility in 2024–25 (approval timing, local content, export controls) affects Enerflex backlog and margins; EU ETS ~€90–100/t (2024) and Canada CAD65/t (2023) shift economics. US IRA ~$369B and 45Q up to $85/t boost CCUS demand; tighter EPA methane rules raise compliance costs. Geopolitical risks lengthen lead times and sourcing costs.
| Policy | 2024/25 metric | Impact |
|---|---|---|
| Carbon price | EU €90–100/t | Higher OPEX for customers |
| 45Q/IRA | $85/t; $369B | Increased CCUS orders |
| Methane rules | US tightened 2023–24 | Capex/compliance rise |
| Local content | Nigeria/Kazakh/Brazil | Longer timelines |
What is included in the product
Detailed Word Document
Explores how Political, Economic, Social, Technological, Environmental and Legal factors uniquely affect Enerflex, with data-backed trends and region-specific regulatory context; designed by strategy professionals to support executives and investors with forward-looking insights, actionable risks/opportunities and clean, report-ready formatting.
Customizable Excel Spreadsheet
Visually segmented by PESTLE categories and written in clear, simple language, the Enerflex PESTLE Analysis provides a concise, editable summary ideal for quick referencing in meetings or slides, enabling teams to align on external risks and market positioning fast.
Economic factors
Hydrocarbon price cycles
Hydrocarbon price cycles (Brent averaged about 86 USD/bbl in 2024) directly drive customer capex for compression and processing, with price upswings expanding midstream takeaway and gas-lift project demand while downturns shift spend to maintenance and optimization. Enerflex’s aftermarket and rentals, representing roughly 35% of FY2024 revenue, stabilize cashflow through cycles. Flexible capacity planning and modular fleets protect margins amid volatile commodity swings.
Interest rates and financing
Elevated policy rates (US Fed funds ~5.25–5.50% mid‑2025) and higher market spreads have effectively raised client WACC by roughly 100–300 bps, delaying greenfield decisions. Leasing, BOOM or service‑based models shift capex off clients’ balance sheets and can reduce approval hurdles. Enerflex can offer performance‑based contracts to link payments to output and unlock approvals, while a strong balance sheet materially boosts bid success on financed deals.
FX and inflation pressures
Multi-currency revenues and costs expose Enerflex margins to FX volatility across North America, Latin America and the Middle East, pressuring USD/CAD and local-currency profitability.
Inflation in inputs such as steel, engines and electronics has compressed fixed-price contract margins amid elevated global input costs versus the Bank of Canada 2% target.
Hedging, indexed pricing, strategic inventory and regional sourcing reduce shocks, lower freight and tariff exposure and preserve gross margins.
Global gas demand growth
Global gas demand reached about 4.0 trillion cubic meters in 2023, with LNG trade near 380 million tonnes, supporting sustained infrastructure buildout as industrial fuel-switching and LNG flows expand into 2024–25. Emerging markets drive roughly two-thirds of incremental gas demand, increasing need for scalable, reliable compression and processing. Enerflex's standardized packages and modular plants match this scale, while lifecycle services enable long-term economic value capture.
- Industrial fuel-switching and LNG trade support sustained buildout
- Emerging markets ≈66% of incremental gas demand
- Standardized packages & modular plants — Enerflex advantage
- Lifecycle services provide recurring, long-term value
Supply chain reliability
Supply chain reliability for Enerflex remains critical as compressor lead times, which spiked to 40+ weeks during 2021–23, eased to roughly 20–30 weeks by 2024, directly affecting project schedules; drivers and controls show similar multi-month variability. Dual-sourcing and rigorous vendor qualification are essential for on-time delivery, while digital supplier visibility (real-time PO/SKU tracking) improves forecasting and allocation; strategic inventory buffers protect critical programs and limit revenue disruption.
- Lead times: 20–30 weeks (2024)
- Dual-sourcing: critical for continuity
- Digital visibility: real-time PO/SKU tracking
- Inventory buffers: protect key programs
Policy volatility, high carbon prices and IRA/45Q incentives reshape CCUS demand
Hydrocarbon cycles (Brent ≈86 USD/bbl in 2024) drive capex vs maintenance; Enerflex’s aftermarket ≈35% of FY2024 revenue cushions cashflow. Global gas ~4.0 tcm (2023) and LNG ≈380 mt sustain infrastructure demand; lead times eased to 20–30 weeks (2024). Higher rates (Fed ≈5.25–5.50% mid‑2025) raise WACC, boosting appeal of leasing/BOOM models.
| Metric | Value |
|---|---|
| Brent (2024) | ≈86 USD/bbl |
| Aftermarket (FY2024) | ≈35% |
| Global gas (2023) | ≈4.0 tcm |
| LNG trade | ≈380 mt |
| Lead times (2024) | 20–30 weeks |
| Fed funds (mid‑2025) | ≈5.25–5.50% |
Same Document Delivered
Enerflex PESTLE Analysis
The preview shown here is the exact Enerflex PESTLE Analysis document you’ll receive after purchase—fully formatted, professionally structured, and ready to use. It contains the same content, layout, and insights displayed in the screenshot with no placeholders or edits. After checkout you’ll instantly download this finished file and can begin applying the analysis right away.











