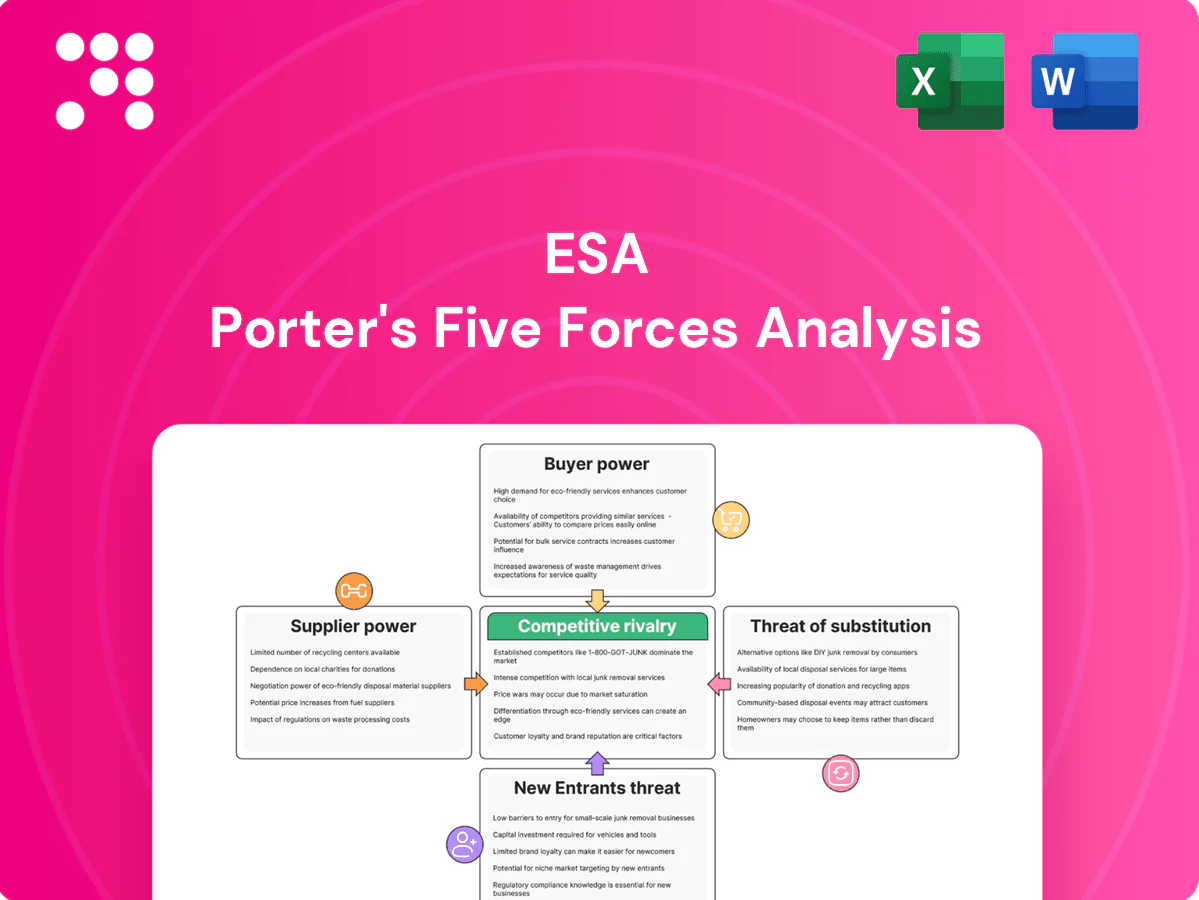
ESA Porter's Five Forces Analysis

Don't Miss the Bigger Picture
Quick snapshot of ESA’s Porter’s Five Forces highlights competitive intensity, supplier/buyer power, and threat vectors; this preview only scratches the surface—unlock the full Porter’s Five Forces Analysis to get force-by-force ratings, visuals, and actionable strategy.
Suppliers Bargaining Power

Concentrated critical equipment
ESA depends on specialized pipe, valves, transformers and HDD rigs from a narrow set of OEMs/distributors, concentrating supplier power and raising switching costs. In 2024 transformer lead times commonly run 40–52 weeks, and long steel delivery cycles strain schedules. Shortages have forced industry players to pay premiums—often up to 20%—or accept lower-spec substitutions, strengthening vendor leverage on price and contract terms.
Skilled labor and subcontractors
Union labor remains concentrated, with overall US union membership near 10% (BLS), while the American Welding Society projected a shortfall of roughly 400,000 welders by 2024, making certified welders and niche subcontractors scarce in some markets. Tight labor pools elevate wage pressure, reduce scheduling flexibility, and strict compliance/safety credentials further narrow eligible suppliers, allowing vendors to demand escalators or priority-access fees during peak demand.

Fuel, logistics, and rentals
Diesel, trucking, and equipment rentals are volatile cost inputs: U.S. average on‑highway diesel in 2024 was about $4.05/gal (EIA), and rental rates spiked ~10–20% in some regions, compressing margins on fixed‑price jobs. Fuel surges and freight constraints can erode profits, especially on remote sites that rely on local logistics providers. ESA may need fuel hedges or contract pass‑through clauses to mitigate exposure.

Supply chain reliability and lead times
Global supply disruptions from weather, geopolitical shifts and 2024 tariff changes are delaying critical materials and extending lead times, increasing ESA’s exposure to liquidated damages if milestones slip. Extended lead times force ESA to hold buffer inventory or redesign scopes when items are unavailable, raising working capital and schedule risk. Suppliers leverage this schedule risk in negotiations, effectively increasing their bargaining power.
- 2024: lead-time extensions raise working capital and LD exposure
- Buffer inventory or redesigns required when parts unavailable
- Schedule risk strengthens supplier negotiating position
Proprietary inspection tech
OEM concentration, 40–52wk leads, $7.2B NDT squeeze
ESA faces concentrated OEMs for transformers, HDD rigs and NDT tech, with 2024 transformer lead times 40–52 weeks and NDT market ~$7.2B, raising switching costs and vendor leverage. Tight skilled labor (welder shortfall ~400k) and diesel ~$4.05/gal amplify cost pressure and supplier bargaining power.
| Driver | 2024 Metric |
|---|---|
| Transformer lead time | 40–52 weeks |
| NDT market | $7.2B |
| Welder gap | ~400,000 |
| Diesel (US avg) | $4.05/gal |
What is included in the product
 Detailed Word Document
Tailored Porter's Five Forces for ESA that uncovers key drivers of competition, customer and supplier power, entry barriers and substitutes, identifies disruptive threats and strategic levers, and delivers actionable insights to protect market share and inform investor or internal strategy materials.

 Customizable Excel Spreadsheet
A one-sheet ESA Porter's Five Forces template with adjustable pressure levels and an instant spider chart—easy to copy into decks, swap in your own data, duplicate for scenario analysis, no macros required, integrates with Excel dashboards and pairs with the Word deep-dive report.
Customers Bargaining Power

Few large utility buyers
Investor-owned utilities, co-ops and pipeline operators drive demand—IOUs account for roughly 70% of US electricity sales in 2024 while rural electric co-ops serve about 13% of customers, concentrating purchasing power. Their scale and regulatory oversight secure stringent contract terms and downward price pressure. ESA often accepts master service frameworks to access steady volumes, increasing revenue dependence on a few key accounts and elevating client-concentration risk.
RFP and bid-driven procurement
Formal tenders and unit-rate bids in the roughly €2 trillion EU public procurement market (about 14% of GDP) intensify price competition and let buyers pit multiple contractors against each other to extract discounts. Transparent scoring frameworks increasingly weight cost and safety performance, shifting awards toward low-priced, compliant bidders. The result is sustained margin compression across contractors, rewarding scale and operational compliance.

Regulatory cost recovery timing
Regulatory cost-recovery timing in 2024 lets utilities time rate cases and multi-year capex cycles to influence project releases, enabling buyers to defer or re-sequence work and pressure contractor utilization and margins. Budget timing gives utilities leverage to negotiate hold-prices or extensions, forcing ESA to actively manage backlog and labor to align with buyer timetables.

Strict safety and compliance demands
Buyers enforce strict TRIR, qualifications and QA/QC thresholds—many large U.S. utilities in 2024 target TRIR below 1.0 and QA defect rates under 0.5%—and noncompliance can lead to disqualification or financial penalties, raising execution costs. Meeting these standards is a market differentiator but creates high entry barriers; utilities can shift scope to compliant rivals if performance slips.
- TRIR target: <1.0 (many 2024 utility contracts)
- QA defect tolerance: <0.5%
- Risk: disqualification/penalties raise costs
- Competitive effect: compliance as barrier/differentiator
Switching costs and MSAs
While switching is feasible, onboarding a new contractor requires mobilization, system integration and learning curves; typical MSAs run 3–5 years, and 2024 industry data show re-bid activity at renewals in roughly 30–40% of contracts. Multi-year MSAs embed processes that moderate churn, but buyers can reset pricing at renewal, so ESA must hit KPIs to protect incumbency; meeting KPIs can cut replacement risk materially.
- MSA length: 3–5 years (common range)
- Re-bid rate at renewal (2024): ~30–40%
- Onboarding cost impact: ~6–12% of first-year contract value
- KPI delivery reduces replacement risk significantly
Large buyers compress margins: US IOUs 70%, EU procurement €2tn, MSAs 3–5yr
Large buyers concentrate leverage: US IOUs ~70% electricity sales (2024) and co-ops ~13% customers, driving strict contract terms and price pressure. EU public procurement ~€2tn (~14% GDP) fuels bid-based margin compression. Regulatory timing, TRIR <1.0 and QA defect targets <0.5% give buyers operational leverage, while 3–5yr MSAs and ~30–40% re-bid rates balance churn and incumbency value.
| Metric | 2024 Value |
|---|---|
| US IOU share | ~70% |
| Co-op customer share | ~13% |
| EU public procurement | €2tn (~14% GDP) |
| TRIR target | <1.0 |
| QA defect tolerance | <0.5% |
| MSA length | 3–5 yrs |
| Re-bid at renewal | ~30–40% |
Preview the Actual Deliverable
ESA Porter's Five Forces Analysis
This preview shows the complete ESA Porter's Five Forces Analysis you'll receive after purchase—no placeholders, no edits needed. The file is fully formatted, ready for download and use immediately upon payment. You're viewing the exact deliverable included with your order.

Don't Miss the Bigger Picture
Quick snapshot of ESA’s Porter’s Five Forces highlights competitive intensity, supplier/buyer power, and threat vectors; this preview only scratches the surface—unlock the full Porter’s Five Forces Analysis to get force-by-force ratings, visuals, and actionable strategy.
Suppliers Bargaining Power
Concentrated critical equipment
ESA depends on specialized pipe, valves, transformers and HDD rigs from a narrow set of OEMs/distributors, concentrating supplier power and raising switching costs. In 2024 transformer lead times commonly run 40–52 weeks, and long steel delivery cycles strain schedules. Shortages have forced industry players to pay premiums—often up to 20%—or accept lower-spec substitutions, strengthening vendor leverage on price and contract terms.
Skilled labor and subcontractors
Union labor remains concentrated, with overall US union membership near 10% (BLS), while the American Welding Society projected a shortfall of roughly 400,000 welders by 2024, making certified welders and niche subcontractors scarce in some markets. Tight labor pools elevate wage pressure, reduce scheduling flexibility, and strict compliance/safety credentials further narrow eligible suppliers, allowing vendors to demand escalators or priority-access fees during peak demand.
Fuel, logistics, and rentals
Diesel, trucking, and equipment rentals are volatile cost inputs: U.S. average on‑highway diesel in 2024 was about $4.05/gal (EIA), and rental rates spiked ~10–20% in some regions, compressing margins on fixed‑price jobs. Fuel surges and freight constraints can erode profits, especially on remote sites that rely on local logistics providers. ESA may need fuel hedges or contract pass‑through clauses to mitigate exposure.
Supply chain reliability and lead times
Global supply disruptions from weather, geopolitical shifts and 2024 tariff changes are delaying critical materials and extending lead times, increasing ESA’s exposure to liquidated damages if milestones slip. Extended lead times force ESA to hold buffer inventory or redesign scopes when items are unavailable, raising working capital and schedule risk. Suppliers leverage this schedule risk in negotiations, effectively increasing their bargaining power.
- 2024: lead-time extensions raise working capital and LD exposure
- Buffer inventory or redesigns required when parts unavailable
- Schedule risk strengthens supplier negotiating position
Proprietary inspection tech
OEM concentration, 40–52wk leads, $7.2B NDT squeeze
ESA faces concentrated OEMs for transformers, HDD rigs and NDT tech, with 2024 transformer lead times 40–52 weeks and NDT market ~$7.2B, raising switching costs and vendor leverage. Tight skilled labor (welder shortfall ~400k) and diesel ~$4.05/gal amplify cost pressure and supplier bargaining power.
| Driver | 2024 Metric |
|---|---|
| Transformer lead time | 40–52 weeks |
| NDT market | $7.2B |
| Welder gap | ~400,000 |
| Diesel (US avg) | $4.05/gal |
What is included in the product
Detailed Word Document
Tailored Porter's Five Forces for ESA that uncovers key drivers of competition, customer and supplier power, entry barriers and substitutes, identifies disruptive threats and strategic levers, and delivers actionable insights to protect market share and inform investor or internal strategy materials.
Customizable Excel Spreadsheet
A one-sheet ESA Porter's Five Forces template with adjustable pressure levels and an instant spider chart—easy to copy into decks, swap in your own data, duplicate for scenario analysis, no macros required, integrates with Excel dashboards and pairs with the Word deep-dive report.
Customers Bargaining Power
Few large utility buyers
Investor-owned utilities, co-ops and pipeline operators drive demand—IOUs account for roughly 70% of US electricity sales in 2024 while rural electric co-ops serve about 13% of customers, concentrating purchasing power. Their scale and regulatory oversight secure stringent contract terms and downward price pressure. ESA often accepts master service frameworks to access steady volumes, increasing revenue dependence on a few key accounts and elevating client-concentration risk.
RFP and bid-driven procurement
Formal tenders and unit-rate bids in the roughly €2 trillion EU public procurement market (about 14% of GDP) intensify price competition and let buyers pit multiple contractors against each other to extract discounts. Transparent scoring frameworks increasingly weight cost and safety performance, shifting awards toward low-priced, compliant bidders. The result is sustained margin compression across contractors, rewarding scale and operational compliance.
Regulatory cost recovery timing
Regulatory cost-recovery timing in 2024 lets utilities time rate cases and multi-year capex cycles to influence project releases, enabling buyers to defer or re-sequence work and pressure contractor utilization and margins. Budget timing gives utilities leverage to negotiate hold-prices or extensions, forcing ESA to actively manage backlog and labor to align with buyer timetables.
Strict safety and compliance demands
Buyers enforce strict TRIR, qualifications and QA/QC thresholds—many large U.S. utilities in 2024 target TRIR below 1.0 and QA defect rates under 0.5%—and noncompliance can lead to disqualification or financial penalties, raising execution costs. Meeting these standards is a market differentiator but creates high entry barriers; utilities can shift scope to compliant rivals if performance slips.
- TRIR target: <1.0 (many 2024 utility contracts)
- QA defect tolerance: <0.5%
- Risk: disqualification/penalties raise costs
- Competitive effect: compliance as barrier/differentiator
Switching costs and MSAs
While switching is feasible, onboarding a new contractor requires mobilization, system integration and learning curves; typical MSAs run 3–5 years, and 2024 industry data show re-bid activity at renewals in roughly 30–40% of contracts. Multi-year MSAs embed processes that moderate churn, but buyers can reset pricing at renewal, so ESA must hit KPIs to protect incumbency; meeting KPIs can cut replacement risk materially.
- MSA length: 3–5 years (common range)
- Re-bid rate at renewal (2024): ~30–40%
- Onboarding cost impact: ~6–12% of first-year contract value
- KPI delivery reduces replacement risk significantly
Large buyers compress margins: US IOUs 70%, EU procurement €2tn, MSAs 3–5yr
Large buyers concentrate leverage: US IOUs ~70% electricity sales (2024) and co-ops ~13% customers, driving strict contract terms and price pressure. EU public procurement ~€2tn (~14% GDP) fuels bid-based margin compression. Regulatory timing, TRIR <1.0 and QA defect targets <0.5% give buyers operational leverage, while 3–5yr MSAs and ~30–40% re-bid rates balance churn and incumbency value.
| Metric | 2024 Value |
|---|---|
| US IOU share | ~70% |
| Co-op customer share | ~13% |
| EU public procurement | €2tn (~14% GDP) |
| TRIR target | <1.0 |
| QA defect tolerance | <0.5% |
| MSA length | 3–5 yrs |
| Re-bid at renewal | ~30–40% |
Preview the Actual Deliverable
ESA Porter's Five Forces Analysis
This preview shows the complete ESA Porter's Five Forces Analysis you'll receive after purchase—no placeholders, no edits needed. The file is fully formatted, ready for download and use immediately upon payment. You're viewing the exact deliverable included with your order.
Description
Don't Miss the Bigger Picture
Quick snapshot of ESA’s Porter’s Five Forces highlights competitive intensity, supplier/buyer power, and threat vectors; this preview only scratches the surface—unlock the full Porter’s Five Forces Analysis to get force-by-force ratings, visuals, and actionable strategy.
Suppliers Bargaining Power
Concentrated critical equipment
ESA depends on specialized pipe, valves, transformers and HDD rigs from a narrow set of OEMs/distributors, concentrating supplier power and raising switching costs. In 2024 transformer lead times commonly run 40–52 weeks, and long steel delivery cycles strain schedules. Shortages have forced industry players to pay premiums—often up to 20%—or accept lower-spec substitutions, strengthening vendor leverage on price and contract terms.
Skilled labor and subcontractors
Union labor remains concentrated, with overall US union membership near 10% (BLS), while the American Welding Society projected a shortfall of roughly 400,000 welders by 2024, making certified welders and niche subcontractors scarce in some markets. Tight labor pools elevate wage pressure, reduce scheduling flexibility, and strict compliance/safety credentials further narrow eligible suppliers, allowing vendors to demand escalators or priority-access fees during peak demand.
Fuel, logistics, and rentals
Diesel, trucking, and equipment rentals are volatile cost inputs: U.S. average on‑highway diesel in 2024 was about $4.05/gal (EIA), and rental rates spiked ~10–20% in some regions, compressing margins on fixed‑price jobs. Fuel surges and freight constraints can erode profits, especially on remote sites that rely on local logistics providers. ESA may need fuel hedges or contract pass‑through clauses to mitigate exposure.
Supply chain reliability and lead times
Global supply disruptions from weather, geopolitical shifts and 2024 tariff changes are delaying critical materials and extending lead times, increasing ESA’s exposure to liquidated damages if milestones slip. Extended lead times force ESA to hold buffer inventory or redesign scopes when items are unavailable, raising working capital and schedule risk. Suppliers leverage this schedule risk in negotiations, effectively increasing their bargaining power.
- 2024: lead-time extensions raise working capital and LD exposure
- Buffer inventory or redesigns required when parts unavailable
- Schedule risk strengthens supplier negotiating position
Proprietary inspection tech
OEM concentration, 40–52wk leads, $7.2B NDT squeeze
ESA faces concentrated OEMs for transformers, HDD rigs and NDT tech, with 2024 transformer lead times 40–52 weeks and NDT market ~$7.2B, raising switching costs and vendor leverage. Tight skilled labor (welder shortfall ~400k) and diesel ~$4.05/gal amplify cost pressure and supplier bargaining power.
| Driver | 2024 Metric |
|---|---|
| Transformer lead time | 40–52 weeks |
| NDT market | $7.2B |
| Welder gap | ~400,000 |
| Diesel (US avg) | $4.05/gal |
What is included in the product
Detailed Word Document
Tailored Porter's Five Forces for ESA that uncovers key drivers of competition, customer and supplier power, entry barriers and substitutes, identifies disruptive threats and strategic levers, and delivers actionable insights to protect market share and inform investor or internal strategy materials.
Customizable Excel Spreadsheet
A one-sheet ESA Porter's Five Forces template with adjustable pressure levels and an instant spider chart—easy to copy into decks, swap in your own data, duplicate for scenario analysis, no macros required, integrates with Excel dashboards and pairs with the Word deep-dive report.
Customers Bargaining Power
Few large utility buyers
Investor-owned utilities, co-ops and pipeline operators drive demand—IOUs account for roughly 70% of US electricity sales in 2024 while rural electric co-ops serve about 13% of customers, concentrating purchasing power. Their scale and regulatory oversight secure stringent contract terms and downward price pressure. ESA often accepts master service frameworks to access steady volumes, increasing revenue dependence on a few key accounts and elevating client-concentration risk.
RFP and bid-driven procurement
Formal tenders and unit-rate bids in the roughly €2 trillion EU public procurement market (about 14% of GDP) intensify price competition and let buyers pit multiple contractors against each other to extract discounts. Transparent scoring frameworks increasingly weight cost and safety performance, shifting awards toward low-priced, compliant bidders. The result is sustained margin compression across contractors, rewarding scale and operational compliance.
Regulatory cost recovery timing
Regulatory cost-recovery timing in 2024 lets utilities time rate cases and multi-year capex cycles to influence project releases, enabling buyers to defer or re-sequence work and pressure contractor utilization and margins. Budget timing gives utilities leverage to negotiate hold-prices or extensions, forcing ESA to actively manage backlog and labor to align with buyer timetables.
Strict safety and compliance demands
Buyers enforce strict TRIR, qualifications and QA/QC thresholds—many large U.S. utilities in 2024 target TRIR below 1.0 and QA defect rates under 0.5%—and noncompliance can lead to disqualification or financial penalties, raising execution costs. Meeting these standards is a market differentiator but creates high entry barriers; utilities can shift scope to compliant rivals if performance slips.
- TRIR target: <1.0 (many 2024 utility contracts)
- QA defect tolerance: <0.5%
- Risk: disqualification/penalties raise costs
- Competitive effect: compliance as barrier/differentiator
Switching costs and MSAs
While switching is feasible, onboarding a new contractor requires mobilization, system integration and learning curves; typical MSAs run 3–5 years, and 2024 industry data show re-bid activity at renewals in roughly 30–40% of contracts. Multi-year MSAs embed processes that moderate churn, but buyers can reset pricing at renewal, so ESA must hit KPIs to protect incumbency; meeting KPIs can cut replacement risk materially.
- MSA length: 3–5 years (common range)
- Re-bid rate at renewal (2024): ~30–40%
- Onboarding cost impact: ~6–12% of first-year contract value
- KPI delivery reduces replacement risk significantly
Large buyers compress margins: US IOUs 70%, EU procurement €2tn, MSAs 3–5yr
Large buyers concentrate leverage: US IOUs ~70% electricity sales (2024) and co-ops ~13% customers, driving strict contract terms and price pressure. EU public procurement ~€2tn (~14% GDP) fuels bid-based margin compression. Regulatory timing, TRIR <1.0 and QA defect targets <0.5% give buyers operational leverage, while 3–5yr MSAs and ~30–40% re-bid rates balance churn and incumbency value.
| Metric | 2024 Value |
|---|---|
| US IOU share | ~70% |
| Co-op customer share | ~13% |
| EU public procurement | €2tn (~14% GDP) |
| TRIR target | <1.0 |
| QA defect tolerance | <0.5% |
| MSA length | 3–5 yrs |
| Re-bid at renewal | ~30–40% |
Preview the Actual Deliverable
ESA Porter's Five Forces Analysis
This preview shows the complete ESA Porter's Five Forces Analysis you'll receive after purchase—no placeholders, no edits needed. The file is fully formatted, ready for download and use immediately upon payment. You're viewing the exact deliverable included with your order.











