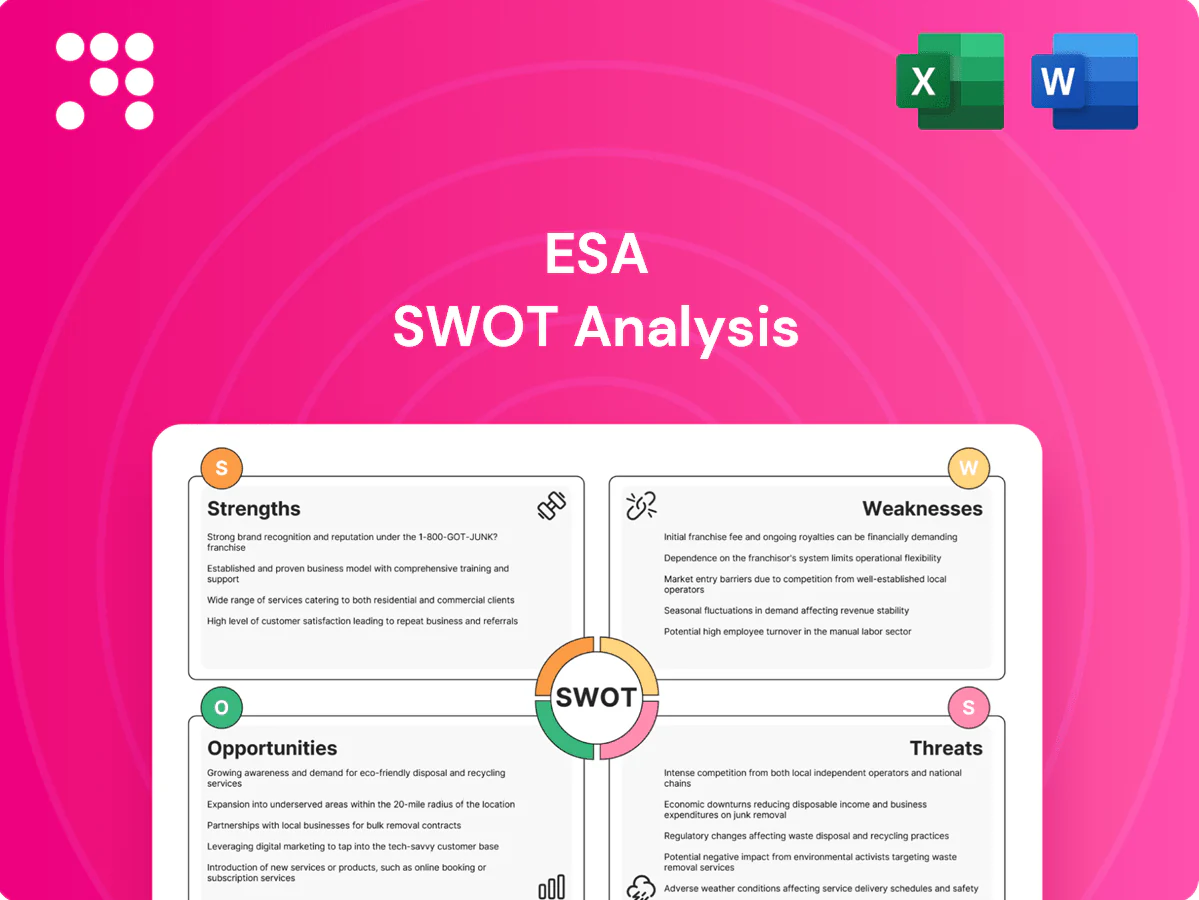
ESA SWOT Analysis

Dive Deeper Into the Company’s Strategic Blueprint
Unearth ESA’s strategic edge and hidden risks with our concise preview—then unlock the full SWOT analysis for a research-backed, investor-ready report plus editable Word and Excel deliverables to support planning, pitches, and confident decision-making.
Strengths

Essential utility services
ESA delivers mission-critical construction, maintenance and repair for natural gas and electric utilities, supporting a resilient baseline demand tied to an estimated U.S. utility transmission and distribution spend near $120 billion annually in 2024. Utilities prioritize reliability and safety, making ESA’s services largely non-discretionary even in downturns. Work is frequently mandated by integrity, safety and reliability programs, underpinning steady backlog and recurring workstreams.
Diverse infrastructure capabilities
Diverse infrastructure capabilities cover pipeline construction, electrical grid work, inspection, testing and data collection, allowing ESA to cross-sell and offer bundled contracts that lower reliance on any single service line. In 2024, bundled-offer firms reported ~12% higher client retention and smoother quarterly revenue profiles. This breadth boosts competitiveness and bid success on complex, integrated projects.

Regulatory- and compliance-driven demand
Inspection, testing and integrity services map directly to tightening safety and reliability standards, driving steady demand for ESA's technical offerings. Compliance timelines from regulators create predictable project flow and reduce cancellation risk, supporting revenue visibility. Utilities face material penalties for outages and leaks, sustaining spend on prevention and resulting in repeat programs and long-cycle planning that favor ESA's service model.

Regional footprint and relationships
ESAs focused presence across the Mid-Atlantic, Central, and Southeastern U.S. yields deep local knowledge and durable customer relationships, lowering mobilization costs and improving responsiveness; familiarity with regional terrain, permitting and utility standards accelerates execution and supports preferred-vendor positioning.
- Regional depth
- Lower mobilization
- Faster permitting
- Preferred-vendor potential
Safety culture and field execution
Specialized crews and strict safety protocols for gas and electric work lower incident rates and strengthen bid credibility; industry studies (2024) show safety-first contractors can realize up to 20% fewer claims and rework events. A consistent safety record reduces insurance costs and boosts win rates in high-risk contracts, creating a durable competitive moat.
Mission-critical T&D O&M tied to $120B 2024 spend; retention +12%
ESA provides mission-critical gas and electric construction and O&M tied to an estimated US T&D spend of $120B in 2024, making services largely non-discretionary. Bundled capabilities drive ~12% higher client retention and smoother revenue. Regional Mid-Atlantic/Central/Southeast depth lowers mobilization and speeds permitting; safety programs cut claims up to 20% (2024).
| Metric | Value | Source/Year |
|---|---|---|
| US T&D spend | $120B | 2024 |
| Bundled retention lift | ~12% | 2024 |
| Claims reduction | Up to 20% | 2024 |
What is included in the product
 Detailed Word Document
Provides a concise SWOT analysis of ESA, highlighting internal strengths and weaknesses alongside external opportunities and threats to map competitive position and strategic risks.

 Customizable Excel Spreadsheet
Delivers a clear ESA SWOT matrix to pinpoint pain points and accelerate targeted remediation and opportunity capture for faster strategic action.
Weaknesses

Geographic concentration
Operations concentrated in specific U.S. regions limit diversification across the 50 states, making ESA vulnerable to localized downturns, weather events, or state-level regulatory shifts that can disproportionately impact results. Expansion requires building new customer relationships and mobilizing assets, increasing capital and operating expenses. Near-term market entry costs can dilute margins until scale and local efficiencies are achieved.
Project-based revenue volatility
Project-based revenue causes pronounced volatility: 58% of contractors in a 2024 industry survey cited backlog timing and change orders as primary drivers of quarterly swings, and fixed-bid contracts magnify execution and margin risk. Permit delays and shifting customer schedules create idle time that compresses margins, and many firms reported cash-flow swings of up to 40% quarter-to-quarter despite steady annual demand.

Skilled labor dependency
Execution depends on experienced crews and certified technicians, and 2024 skill shortages remain acute—ManpowerGroup reported about 69% of employers struggled to fill roles. Tight labor markets drove wage inflation (BLS: average hourly earnings ~4.5% YoY in 2024) and retention challenges. Mandatory training and safety compliance increase costs and onboarding time, and persistent labor gaps can cap growth even when demand is strong.

Capital intensity and working capital
Equipment fleets, tools and staging needs force ongoing capex and refresh cycles, often representing a meaningful share of project budgets; project startups tie up cash for materials and mobilization before billing milestones hit. Receivables from large utilities commonly extend DSO into the 60–90 day range, elevating liquidity management risk and the need for working capital financing.
- High capex burden: ongoing fleet/tool investment
- Cash drag: mobilization and materials pre-billing
- Extended receivables: utilities push DSO 60–90 days
Customer concentration in utilities
Customer concentration in utilities leaves ESA with revenue skewed toward a few large buyers; as of 2024 many sector suppliers report >50% of sales from top three utility accounts, compressing pricing power and exposing margins to buyer-driven contract terms.
Loss of a key account would materially cut backlog and cashflow, and stringent vendor qualification thresholds for major utilities slow rapid customer diversification.
- Revenue concentration: >50% from top 3 accounts (2024)
- Pricing pressure: large buyers set stricter terms
- Backlog risk: single account loss materially reduces orders
- Qualification barriers: slow diversification
Concentration risk: >50% top-3 revenue, backlog swings and DSO 60-90 days
Operations concentrated regionally and >50% revenue from top three utility accounts (2024) create pricing and backlog risk; loss of a key account would materially reduce cashflow. Project-based revenue drives volatility (58% cite backlog/change-orders as main swing factor in 2024) and DSO often runs 60–90 days. 2024 labor shortages (69% employers struggled) and 4.5% wage inflation raise costs and limit scaling.
| Metric | 2024 Value |
|---|---|
| Revenue concentration (top 3) | >50% |
| Backlog volatility (survey) | 58% |
| Labor fill difficulty | 69% |
| Wage inflation (avg hourly) | ≈4.5% YoY |
| DSO (utilities) | 60–90 days |
Preview the Actual Deliverable
ESA SWOT Analysis
This is the actual ESA SWOT analysis document you’ll receive upon purchase—no surprises, just professional quality. The preview below is taken directly from the full report; purchase unlocks the complete, editable file. You’re viewing a live excerpt of the final, structured analysis, ready to use after checkout.

Dive Deeper Into the Company’s Strategic Blueprint
Unearth ESA’s strategic edge and hidden risks with our concise preview—then unlock the full SWOT analysis for a research-backed, investor-ready report plus editable Word and Excel deliverables to support planning, pitches, and confident decision-making.
Strengths
Essential utility services
ESA delivers mission-critical construction, maintenance and repair for natural gas and electric utilities, supporting a resilient baseline demand tied to an estimated U.S. utility transmission and distribution spend near $120 billion annually in 2024. Utilities prioritize reliability and safety, making ESA’s services largely non-discretionary even in downturns. Work is frequently mandated by integrity, safety and reliability programs, underpinning steady backlog and recurring workstreams.
Diverse infrastructure capabilities
Diverse infrastructure capabilities cover pipeline construction, electrical grid work, inspection, testing and data collection, allowing ESA to cross-sell and offer bundled contracts that lower reliance on any single service line. In 2024, bundled-offer firms reported ~12% higher client retention and smoother quarterly revenue profiles. This breadth boosts competitiveness and bid success on complex, integrated projects.
Regulatory- and compliance-driven demand
Inspection, testing and integrity services map directly to tightening safety and reliability standards, driving steady demand for ESA's technical offerings. Compliance timelines from regulators create predictable project flow and reduce cancellation risk, supporting revenue visibility. Utilities face material penalties for outages and leaks, sustaining spend on prevention and resulting in repeat programs and long-cycle planning that favor ESA's service model.
Regional footprint and relationships
ESAs focused presence across the Mid-Atlantic, Central, and Southeastern U.S. yields deep local knowledge and durable customer relationships, lowering mobilization costs and improving responsiveness; familiarity with regional terrain, permitting and utility standards accelerates execution and supports preferred-vendor positioning.
- Regional depth
- Lower mobilization
- Faster permitting
- Preferred-vendor potential
Safety culture and field execution
Specialized crews and strict safety protocols for gas and electric work lower incident rates and strengthen bid credibility; industry studies (2024) show safety-first contractors can realize up to 20% fewer claims and rework events. A consistent safety record reduces insurance costs and boosts win rates in high-risk contracts, creating a durable competitive moat.
Mission-critical T&D O&M tied to $120B 2024 spend; retention +12%
ESA provides mission-critical gas and electric construction and O&M tied to an estimated US T&D spend of $120B in 2024, making services largely non-discretionary. Bundled capabilities drive ~12% higher client retention and smoother revenue. Regional Mid-Atlantic/Central/Southeast depth lowers mobilization and speeds permitting; safety programs cut claims up to 20% (2024).
| Metric | Value | Source/Year |
|---|---|---|
| US T&D spend | $120B | 2024 |
| Bundled retention lift | ~12% | 2024 |
| Claims reduction | Up to 20% | 2024 |
What is included in the product
Detailed Word Document
Provides a concise SWOT analysis of ESA, highlighting internal strengths and weaknesses alongside external opportunities and threats to map competitive position and strategic risks.
Customizable Excel Spreadsheet
Delivers a clear ESA SWOT matrix to pinpoint pain points and accelerate targeted remediation and opportunity capture for faster strategic action.
Weaknesses
Geographic concentration
Operations concentrated in specific U.S. regions limit diversification across the 50 states, making ESA vulnerable to localized downturns, weather events, or state-level regulatory shifts that can disproportionately impact results. Expansion requires building new customer relationships and mobilizing assets, increasing capital and operating expenses. Near-term market entry costs can dilute margins until scale and local efficiencies are achieved.
Project-based revenue volatility
Project-based revenue causes pronounced volatility: 58% of contractors in a 2024 industry survey cited backlog timing and change orders as primary drivers of quarterly swings, and fixed-bid contracts magnify execution and margin risk. Permit delays and shifting customer schedules create idle time that compresses margins, and many firms reported cash-flow swings of up to 40% quarter-to-quarter despite steady annual demand.
Skilled labor dependency
Execution depends on experienced crews and certified technicians, and 2024 skill shortages remain acute—ManpowerGroup reported about 69% of employers struggled to fill roles. Tight labor markets drove wage inflation (BLS: average hourly earnings ~4.5% YoY in 2024) and retention challenges. Mandatory training and safety compliance increase costs and onboarding time, and persistent labor gaps can cap growth even when demand is strong.
Capital intensity and working capital
Equipment fleets, tools and staging needs force ongoing capex and refresh cycles, often representing a meaningful share of project budgets; project startups tie up cash for materials and mobilization before billing milestones hit. Receivables from large utilities commonly extend DSO into the 60–90 day range, elevating liquidity management risk and the need for working capital financing.
- High capex burden: ongoing fleet/tool investment
- Cash drag: mobilization and materials pre-billing
- Extended receivables: utilities push DSO 60–90 days
Customer concentration in utilities
Customer concentration in utilities leaves ESA with revenue skewed toward a few large buyers; as of 2024 many sector suppliers report >50% of sales from top three utility accounts, compressing pricing power and exposing margins to buyer-driven contract terms.
Loss of a key account would materially cut backlog and cashflow, and stringent vendor qualification thresholds for major utilities slow rapid customer diversification.
- Revenue concentration: >50% from top 3 accounts (2024)
- Pricing pressure: large buyers set stricter terms
- Backlog risk: single account loss materially reduces orders
- Qualification barriers: slow diversification
Concentration risk: >50% top-3 revenue, backlog swings and DSO 60-90 days
Operations concentrated regionally and >50% revenue from top three utility accounts (2024) create pricing and backlog risk; loss of a key account would materially reduce cashflow. Project-based revenue drives volatility (58% cite backlog/change-orders as main swing factor in 2024) and DSO often runs 60–90 days. 2024 labor shortages (69% employers struggled) and 4.5% wage inflation raise costs and limit scaling.
| Metric | 2024 Value |
|---|---|
| Revenue concentration (top 3) | >50% |
| Backlog volatility (survey) | 58% |
| Labor fill difficulty | 69% |
| Wage inflation (avg hourly) | ≈4.5% YoY |
| DSO (utilities) | 60–90 days |
Preview the Actual Deliverable
ESA SWOT Analysis
This is the actual ESA SWOT analysis document you’ll receive upon purchase—no surprises, just professional quality. The preview below is taken directly from the full report; purchase unlocks the complete, editable file. You’re viewing a live excerpt of the final, structured analysis, ready to use after checkout.
Description
Dive Deeper Into the Company’s Strategic Blueprint
Unearth ESA’s strategic edge and hidden risks with our concise preview—then unlock the full SWOT analysis for a research-backed, investor-ready report plus editable Word and Excel deliverables to support planning, pitches, and confident decision-making.
Strengths
Essential utility services
ESA delivers mission-critical construction, maintenance and repair for natural gas and electric utilities, supporting a resilient baseline demand tied to an estimated U.S. utility transmission and distribution spend near $120 billion annually in 2024. Utilities prioritize reliability and safety, making ESA’s services largely non-discretionary even in downturns. Work is frequently mandated by integrity, safety and reliability programs, underpinning steady backlog and recurring workstreams.
Diverse infrastructure capabilities
Diverse infrastructure capabilities cover pipeline construction, electrical grid work, inspection, testing and data collection, allowing ESA to cross-sell and offer bundled contracts that lower reliance on any single service line. In 2024, bundled-offer firms reported ~12% higher client retention and smoother quarterly revenue profiles. This breadth boosts competitiveness and bid success on complex, integrated projects.
Regulatory- and compliance-driven demand
Inspection, testing and integrity services map directly to tightening safety and reliability standards, driving steady demand for ESA's technical offerings. Compliance timelines from regulators create predictable project flow and reduce cancellation risk, supporting revenue visibility. Utilities face material penalties for outages and leaks, sustaining spend on prevention and resulting in repeat programs and long-cycle planning that favor ESA's service model.
Regional footprint and relationships
ESAs focused presence across the Mid-Atlantic, Central, and Southeastern U.S. yields deep local knowledge and durable customer relationships, lowering mobilization costs and improving responsiveness; familiarity with regional terrain, permitting and utility standards accelerates execution and supports preferred-vendor positioning.
- Regional depth
- Lower mobilization
- Faster permitting
- Preferred-vendor potential
Safety culture and field execution
Specialized crews and strict safety protocols for gas and electric work lower incident rates and strengthen bid credibility; industry studies (2024) show safety-first contractors can realize up to 20% fewer claims and rework events. A consistent safety record reduces insurance costs and boosts win rates in high-risk contracts, creating a durable competitive moat.
Mission-critical T&D O&M tied to $120B 2024 spend; retention +12%
ESA provides mission-critical gas and electric construction and O&M tied to an estimated US T&D spend of $120B in 2024, making services largely non-discretionary. Bundled capabilities drive ~12% higher client retention and smoother revenue. Regional Mid-Atlantic/Central/Southeast depth lowers mobilization and speeds permitting; safety programs cut claims up to 20% (2024).
| Metric | Value | Source/Year |
|---|---|---|
| US T&D spend | $120B | 2024 |
| Bundled retention lift | ~12% | 2024 |
| Claims reduction | Up to 20% | 2024 |
What is included in the product
Detailed Word Document
Provides a concise SWOT analysis of ESA, highlighting internal strengths and weaknesses alongside external opportunities and threats to map competitive position and strategic risks.
Customizable Excel Spreadsheet
Delivers a clear ESA SWOT matrix to pinpoint pain points and accelerate targeted remediation and opportunity capture for faster strategic action.
Weaknesses
Geographic concentration
Operations concentrated in specific U.S. regions limit diversification across the 50 states, making ESA vulnerable to localized downturns, weather events, or state-level regulatory shifts that can disproportionately impact results. Expansion requires building new customer relationships and mobilizing assets, increasing capital and operating expenses. Near-term market entry costs can dilute margins until scale and local efficiencies are achieved.
Project-based revenue volatility
Project-based revenue causes pronounced volatility: 58% of contractors in a 2024 industry survey cited backlog timing and change orders as primary drivers of quarterly swings, and fixed-bid contracts magnify execution and margin risk. Permit delays and shifting customer schedules create idle time that compresses margins, and many firms reported cash-flow swings of up to 40% quarter-to-quarter despite steady annual demand.
Skilled labor dependency
Execution depends on experienced crews and certified technicians, and 2024 skill shortages remain acute—ManpowerGroup reported about 69% of employers struggled to fill roles. Tight labor markets drove wage inflation (BLS: average hourly earnings ~4.5% YoY in 2024) and retention challenges. Mandatory training and safety compliance increase costs and onboarding time, and persistent labor gaps can cap growth even when demand is strong.
Capital intensity and working capital
Equipment fleets, tools and staging needs force ongoing capex and refresh cycles, often representing a meaningful share of project budgets; project startups tie up cash for materials and mobilization before billing milestones hit. Receivables from large utilities commonly extend DSO into the 60–90 day range, elevating liquidity management risk and the need for working capital financing.
- High capex burden: ongoing fleet/tool investment
- Cash drag: mobilization and materials pre-billing
- Extended receivables: utilities push DSO 60–90 days
Customer concentration in utilities
Customer concentration in utilities leaves ESA with revenue skewed toward a few large buyers; as of 2024 many sector suppliers report >50% of sales from top three utility accounts, compressing pricing power and exposing margins to buyer-driven contract terms.
Loss of a key account would materially cut backlog and cashflow, and stringent vendor qualification thresholds for major utilities slow rapid customer diversification.
- Revenue concentration: >50% from top 3 accounts (2024)
- Pricing pressure: large buyers set stricter terms
- Backlog risk: single account loss materially reduces orders
- Qualification barriers: slow diversification
Concentration risk: >50% top-3 revenue, backlog swings and DSO 60-90 days
Operations concentrated regionally and >50% revenue from top three utility accounts (2024) create pricing and backlog risk; loss of a key account would materially reduce cashflow. Project-based revenue drives volatility (58% cite backlog/change-orders as main swing factor in 2024) and DSO often runs 60–90 days. 2024 labor shortages (69% employers struggled) and 4.5% wage inflation raise costs and limit scaling.
| Metric | 2024 Value |
|---|---|
| Revenue concentration (top 3) | >50% |
| Backlog volatility (survey) | 58% |
| Labor fill difficulty | 69% |
| Wage inflation (avg hourly) | ≈4.5% YoY |
| DSO (utilities) | 60–90 days |
Preview the Actual Deliverable
ESA SWOT Analysis
This is the actual ESA SWOT analysis document you’ll receive upon purchase—no surprises, just professional quality. The preview below is taken directly from the full report; purchase unlocks the complete, editable file. You’re viewing a live excerpt of the final, structured analysis, ready to use after checkout.











